All Activity
- Past hour
-
You will never convince cultists of anything, despite providing data and well-rounded and unbiased observations. I admire your tenacity, in terms of using factual and logical arguments in questioning the absurdities within the climate catastrophe narrative. Good luck... you are debating science with the same folks that decided that there are an untold number of genders. Good grief... Geological timescale is something that weak-minded individuals have difficulty with. "The thirst for answers" will often create delusional mob mentality.
-
.56 imby today
-
Every week for the last month we have heard..."this will be the last one of these til October..." Yet every week is wash rinse repeat and now 2 days of clouds wet and drab turn into 4 days spilling into Monday and Tuesday and now lucky to see late sun on Wednesday Make it stop as the #yearwithoutasummer rolls on
-
"Wrongness?" I love lurking on this thread for nonsensical crud like this. I hope you were highly intoxicated when you posted this. (And just incase you are mentally retarded, my sincere apologies. I just assumed you were of sound mind.)
-
Just got a surprise pop up right overhead. Picked up .04”.
-
Pattern what CANSIPS is showing right now looks maybe similar to last winter.More NINA, weak NINA.I'm surprised it didnt show more blocking into the Hudson with the blocking its showing into around the four corners,but it still looks like a -NAO.Jan would seemingly right now be BN with the blocking its showing into the Western AK/.Bering Sea.Into Feb this blocking shifts into the Bering Sea,this seemingly could bring a early severe threat Think myself the warm SST'S into the Yellow Sea into the Sea of Japan and off the east coast of Japan are unprecedented to rely on analogs.I mean the warmest SST'S in this region was in 2023 during a strong NINO
-
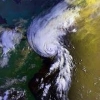
2025 Atlantic Hurricane Season
Diggiebot replied to BarryStantonGBP's topic in Tropical Headquarters
Prime for New England too. If it misses NC SC then it’s New England next -
59 and windy in Manhattan. Feels like fall.
- Today
-
Severe Weather Statement National Weather Service Baltimore MD/Washington DC 1007 PM EDT Sat Jun 14 2025 VAC137-177-150245- /O.CON.KLWX.TO.W.0026.000000T0000Z-250615T0245Z/ Orange VA-Spotsylvania VA- 1007 PM EDT Sat Jun 14 2025 ...A TORNADO WARNING REMAINS IN EFFECT UNTIL 1045 PM EDT FOR EASTERN ORANGE AND NORTH CENTRAL SPOTSYLVANIA COUNTIES... At 1007 PM EDT, a severe thunderstorm capable of producing a tornado was located 12 miles northwest of Spotsylvania, or 14 miles west of Fredericksburg, moving southeast at 10 mph. HAZARD...Tornado. SOURCE...Radar indicated rotation. IMPACT...For those in the direct path of a tornado touchdown, flying debris will be dangerous to those caught without shelter. Damage to roofs, siding, and windows may occur. Mobile homes may be damaged or destroyed. Tree damage is likely. Locations impacted include... Lake Of The Woods, Chancellorsville, Cookstown, Parker, and Flat Run. PRECAUTIONARY/PREPAREDNESS ACTIONS... TAKE COVER NOW! Move to a basement or an interior room on the lowest floor of a sturdy building. Avoid windows. If you are outdoors, in a mobile home, or in a vehicle, move to the closest substantial shelter and protect yourself from flying debris. Tornadoes are extremely difficult to see and confirm at night. Do not wait to see or hear the tornado. TAKE COVER NOW!
-

2025 summer max contest -- enter by 06z June 20
Roger Smith replied to Roger Smith's topic in Mid Atlantic
Please note, I had originally chosen June 22-23 as deadline (23rd 06z) but in view of current model projections I have adjusted the deadline forward to June 20 at 06z, or end of the day Thursday of next week ... I don't believe this will have much impact on turnout which is trending towards the usual 20-30 entries already. And I wanted to avoid a situation where a record high on the day after deadline attracts a number of very small over-run of deadline entries, this way, I can have a table of entries ready before the heat arrives and a clear barrier to last minute nowcast type entries. -
The triple threat warning(s).
-

2025-2026 ENSO
40/70 Benchmark replied to 40/70 Benchmark's topic in Weather Forecasting and Discussion
Agree. -
Tornado Warning in Spotsylvania. Velocity scans are decent
-
Pretty much all the guidance depicted this. Storms to the west tracking southeastward along the stationary front, with cooler marine air associated with HP off the Canadian Maritimes pressing southwest into the northern/eastern parts of our region. The flood watch up to the PA border was a pretty bad forecast, and has since been dropped.
-
Today had 3 periods of rain: -During the afternoon, a moderate, fairly short thunderstorm with a good bit of nearby CTG lightning but only modest rainfall. -A band of very heavy thunderstorms came through during the evening that lasted longer likely producing 2”+ of rainfall. My street flooded and there was this: 0700 PM FLOOD SAVANNAH 32.05N 81.08W 06/14/2025 CHATHAM GA EMERGENCY MNGR EMERGENCY MANAGER REPORTS SEVERAL FLOODED STREETS ACROSS SAVANNAH: VICTORY DRIVE, HABERSHAM STREET, PRICE STREET, BULL STREET, WATERS AVENUE, HODGSON MEMORIAL DRIVE, EISENHOWER DRIVE, AND DERENNE AVENUE. -An area of mainly light rain came through a little later.
-
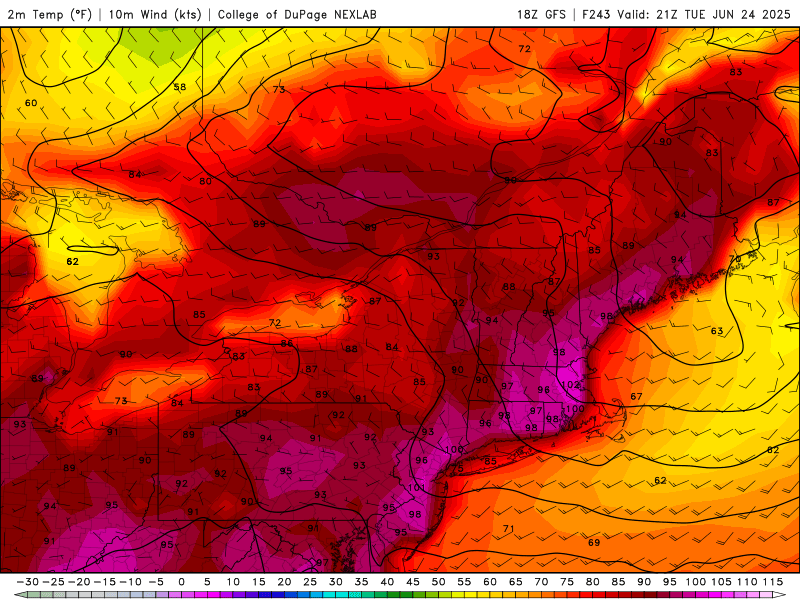
18z gfs…good starting point, but we can always go higher.
-
It's coming. EPS is ridiculously warm
-

June 2025 discussion-obs: Summerlike
WestBabylonWeather replied to wdrag's topic in New York City Metro
Safe to say we get a pattern change by next weekend. -
Got .50". The best stuff slid just south. Seeing some PWSs near Strasburg at 2".
-
We could get our 100s
-
Really noticed the hazy smoke on the drive from Burtonsville, MD back to Herndon, VA this evening.
-

2025-2026 ENSO
Stormchaserchuck1 replied to 40/70 Benchmark's topic in Weather Forecasting and Discussion
I would take my chances with either one of those seasons, too. We had a really nice upper latitude pattern in Dec 2022 and March 2023. I think whatever it was that was keeping semi-permanent ridging in the mid-latitudes 2019-2024 is breaking, maybe since the solar storms last Spring. -
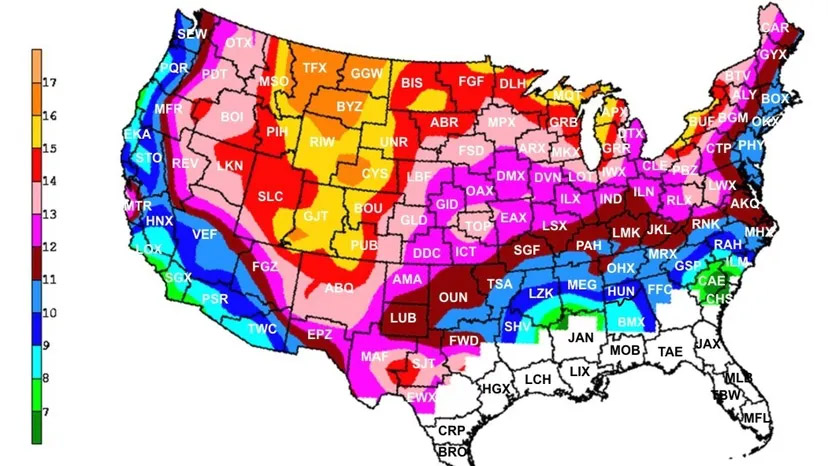
That’s always an interesting comparison, and a big factor in the difference is the very disparate snowfall climatology between the two areas. The two prominent components that go into that SDD/snowfall ratio are the density of the snowfall and the snowpack preservation. Snow preservation here at our site doesn’t appear to be an outlier in either direction locally; between the west side climates and the east side climates along the spine of the Northern Greens, our site’s snow preservation seems to be relatively average. But the east side climate areas, and moving beyond Vermont, areas just east of the Appalachians in general, hold onto cold air the longest and that can help to maximize snow preservation. At our site I’d say it’s the snowfall that has the biggest impact on the SDD/snowfall ratio. And it’s not as if there’s some sort of outrageously high average snow ratio here at our site; it seems right in line with what studies report for the area (see the map and further discussion below). It looks like the high snowfall/SDD ratio here at our site arises from a combination of the area having reasonably strong average snowfall ratios to begin with, and those ratios being elevated even more in seasons with decent amounts of LES/upslope snow. The Northeastern U.S. does represent one of the more dramatic gradients in average snowfall density as one can see from the map. With 6 to 7 snowfall density zones across the region from west to east, the gradient around here is almost as extreme as it is along the west coast of the U.S. There are various studies and maps out there that compare average snowfall ratios across the country, but Weather.com has a nice discussion bringing in data from the 2005 study by Marty Baxter of Central Michigan University, and that’s where I grabbed the map posted above. The mapping of the results from that study shows how the bulk of the BTV NWS forecast area is in that mauve pink shading, which is the 13-14 to 1 range for snowfall ratios. For the period of record in my data set, the mean snowfall ratio is 13.7 ± 1.8, and the median is 13.3, so those data represent what appears to be a strong, normal distribution that is exactly in line with the snowfall ratio range determined in that study. This is the first time I’ve checked on the ratio numbers in a while, but that comparison does give me strong confidence in the methodologies I’m using for both snowfall and liquid equivalent measurements here at our site. The snow to liquid ratio for this past season was 16.6 to 1 (i.e., the water content was 6.0% H2O), which is higher than the average, but quite consistent with this season feeling like we had a decent amount of upslope snow relative to some seasons. If you look at the map, that’s a solid Montana/Northern Rockies style winter right there, with snowfall ratios corresponding to that large area of orange shading. The highest snowfall ratio we’ve recorded here at our site across an entire season is 17.25 (5.8% H2O) in 2020-2021, and the full data set for seasonal snowfall ratios is listed below. Season: Snowfall Ratio ’10-’11: 14.54 ’11-’12: 14.20 ’12-’13: 16.41 ’13-’14: 13.44 ’14-’15: 13.26 ’15-’16: 11.53 ’16-’17: 13.26 ’17-’18: 13.08 ’18-’19: 11.45 ’19-’20: 13.05 ’20-’21: 17.25 ’21-’22: 13.60 ’22-’23: 11.92 ’23-’24: 12.28 ’24-’25: 16.58 Mean: 13.7 ± 1.8 For mountain areas with continental or intermountain snow climates that see minimal melting or winter rainstorms, I often think of the 3 to 1 snowfall to snowpack ratio that I’ve seen PF use for Mansfield (i.e., 300 inches of snowfall produces a snowpack depth of ~100 inches). I’d think a maritime snow climate would be more like 2 to 1, but I’m sure it can vary a lot. This past season, PF recorded 362” of snowfall at his Mt. Mansfield snow plot and the snowpack reached a depth of 103”, so that’s a ratio of 3.5 to 1, which is certainly in that 3 to 1 range. In winter seasons around here without heavy rainstorms, the snowfall climate seems quite intermountain/transitional, but the average snowfall ratio I recorded here at our site this past season would certainly be pushing well into a continental climate. These snow climate classifications are really dialed into the ranges of the western U.S., so there’s not going to be an exact fit for the specific climate of the Northern Greens, but they’re helpful for discussion. We get more rain and temperatures fluctuations here than in the highest elevations of the western U.S., but many of the mid to lower elevation mountain areas out there can get rain and temperature fluctuations above freezing as well, so that’s still part of the climate. These different ratios of snowfall to liquid equivalent, SDD to snowfall, snowfall to snowpack depth, etc. don’t all correlate to each other exactly of course, but they’re still informative. Below was an interesting Reddit discussion I found about the snowfall to base depth correlation – I think some of the people’s numbers are way off from reality, but it sounds like some of them are from personal experience, so that’s potentially useful: https://www.reddit.com/r/skiing/comments/1hi5rr8/how_does_snowfall_translate_into_increase_in_base/ https://avalanche.org/avalanche-encyclopedia/weather/snow-climate/
-
Jun 10 2019 last June high in the 60s for most. Today's Highs ACY: 71 PHL: 70 EWR: 70 TEB: 69 NYC: 67 New Brnswck: 67 LGA: 67 TTN: 67 JFK: 66 BLM: 66 ISP: 63
-
Thursday seems as though it may carry potential - but it's ages away.