All Activity
- Past hour
-
Wet
-
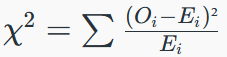
 heh...some afterthoughts.. It's primarily used in experimenting theorems - create a model based upon a theory that describes a mechanism for how whatever is being observed, works. Then, feed it inputs, test the output for significance (chi test) against the other result that occurred naturally. If the output ( as it goes...) lands on .05, and in particular, there was pig ton of data going into the the test ( sample size) then one's theory that describes the system is robust. Blah blah blah, but what is fascinating about the the last 20 years of human folly we lovingly refer to as "civility" ... arguably the more advanced technologically we are getting, "civility" as a qualitative distinction is eroding in proportion... That's A. B, the reason for that is that it has spontaneously created this refrain that if one does not understand complexity, than it is automatically insignificant. This is the precise mechanism in the Fermi Paradox explanation our species is not on a collision course with...
 -

2026 Mid-Atlantic Severe Storm General Discussion
AmericanWxFreak replied to Kmlwx's topic in Mid Atlantic
Am I the only one who can’t read these because the HTML formatting is coming thru? . -
 I lean ACATT by preference (not forecasting) but think we'll finish July AN, thanks to its first 4 days. 7/1-4 was 10.3° AN while the next 19 days have run 0.6° BN and I think the remainder will be close to norms here. Enter August 2, 1975! PWM: 103 BGR: 102 BHB: 100 at water's edge. All 3 all-timers. Since my first swim in Maine salt water (August 1952), Hot Saturday is my only time of swimming in actual warm salt water here, just south of Otter Cliffs in Acadia.
 -
 Did a few assignments in my Quantitative Analysis class using R recently. Fun stuff...interesting programming language.
 -
 we’ve been trying to tell them
 -
Yeah, this is a nice change following the record heat. The July normals have been increasing steadily across the area. So an average finish near 78.2° at a spot like Newark is still the 26th warmest July. The last time we finished in the top 20s for a cool July was 2009. So departures this month would be higher if the departures were fixed at period like 1961-1990 or even 1951-2000. Adjusting the departures warmer every 10 years really masks or normalizes the long term warming. Time Series Summary for NEWARK LIBERTY INTL AP, NJ - Month of Jul Warmest Average Temperatures Click column heading to sort ascending, click again to sort descending. 1 2011 82.7 0 2 2022 82.6 0 3 1993 82.5 0 4 2010 82.3 0 5 2025 82.1 0 6 1994 81.9 0 7 2024 81.3 0 8 2013 80.9 0 9 2020 80.8 0 - 2012 80.8 0 - 1999 80.8 0 10 2023 80.6 0 - 2019 80.6 0 11 1955 80.5 0 12 1988 80.4 0 13 2002 80.0 0 14 2016 79.9 0 15 1887 79.8 0 16 1983 79.6 0 - 1966 79.6 0 17 1995 79.5 0 - 1949 79.5 0 18 2026 79.4 8 - 2006 79.4 0 - 1987 79.4 0 19 1981 79.2 0 - 1952 79.2 0 20 2015 79.0 0 21 2021 78.8 0 - 1980 78.8 0 - 1878 78.8 0 22 2008 78.7 0 23 1973 78.6 0 24 1876 78.5 0 25 2005 78.3 0 - 1982 78.3 0 26 2018 78.2 91-20 Mean Time Series Summary for NEWARK LIBERTY INTL AP, NJ - Month of Jul Coolest Average Temperatures Click column heading to sort ascending, click again to sort descending. 1 1859 70.3 0 2 1862 71.0 0 3 1867 71.1 0 4 1860 71.3 0 5 1871 71.6 0 6 1895 71.7 0 - 1861 71.7 0 7 1884 71.8 0 - 1857 71.8 0 8 1869 72.2 0 9 1902 72.5 0 - 1865 72.5 0 10 1864 72.6 0 11 1904 72.7 0 - 1888 72.7 0 12 1914 72.9 0 13 1923 73.0 0 - 1875 73.0 0 14 1956 73.1 0 - 1863 73.1 0 15 1853 73.3 0 16 1922 73.4 0 17 1858 73.5 0 18 1909 73.6 0 - 1893 73.6 0 - 1874 73.6 0 19 2000 73.7 0 - 1903 73.7 0 20 1996 73.8 0 - 1962 73.8 0 - 1933 73.8 0 - 1918 73.8 0 - 1899 73.8 0 21 1920 73.9 0 - 1915 73.9 0 22 2001 74.1 0 - 1945 74.1 0 23 1969 74.2 0 - 1967 74.2 0 - 1873 74.2 0 24 2009 74.3 0
-

Central PA Summer 2026 Discussion/Obs Thread
Superstorm replied to Voyager's topic in Upstate New York/Pennsylvania
52.9F for low in Lancaster. . -
Oh, o-kay. I see. yeah, and that's going to be dubious for obvious reasons. Of course, muah hahaha if it is a climate threshold being breached. Ha. I guess that would be easily sussed out though if we looked at all sites and if they all exhibited the same behavior than the ( speak of the devil) significance of that above would be more useful.
-

Central PA Summer 2026 Discussion/Obs Thread
Mount Joy Snowman replied to Voyager's topic in Upstate New York/Pennsylvania
It was a white pine. I’m not entirely sure but the root ball does appear to have some rot and be a bit bundled. Maybe I’ll take a picture of the exposed root ball later and post it here and you can give me your thoughts. We do have a couple more of these pines but not quite as large or leaning. -
 Ya I was about to say the same exact thing,
 -
If we’re not all dropped to D1 or D0 I’d be surprised from triangle to your way. I too have had over 6” this week alone and now over a foot for the month with more coming
-
Central PA Summer 2026 Discussion/Obs Thread
Mount Joy Snowman replied to Voyager's topic in Upstate New York/Pennsylvania
Low of 54. Perfect days. Happy Friday. -
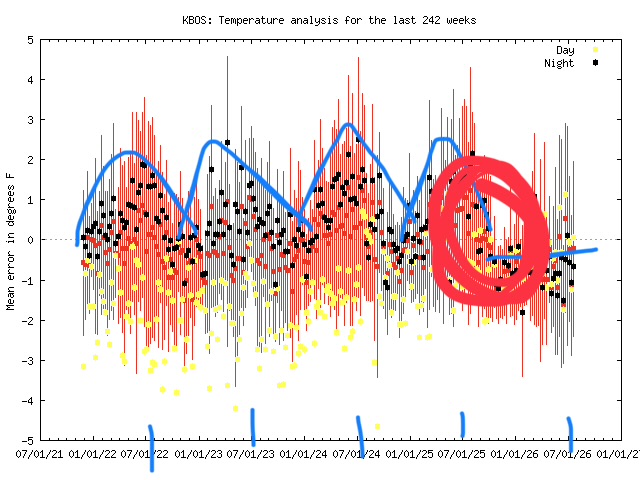
 The thing to do would be compare the BOS max and min departures with the other sites going back to spring 2025 and seeing if they start deviating last fall.
 -

2026-2027 Super El Nino
LakePaste25 replied to Stormchaserchuck1's topic in Weather Forecasting and Discussion
This is what I was referring to. If this is how someone makes their seasonal forecast, you should immediately unsubscribe from them.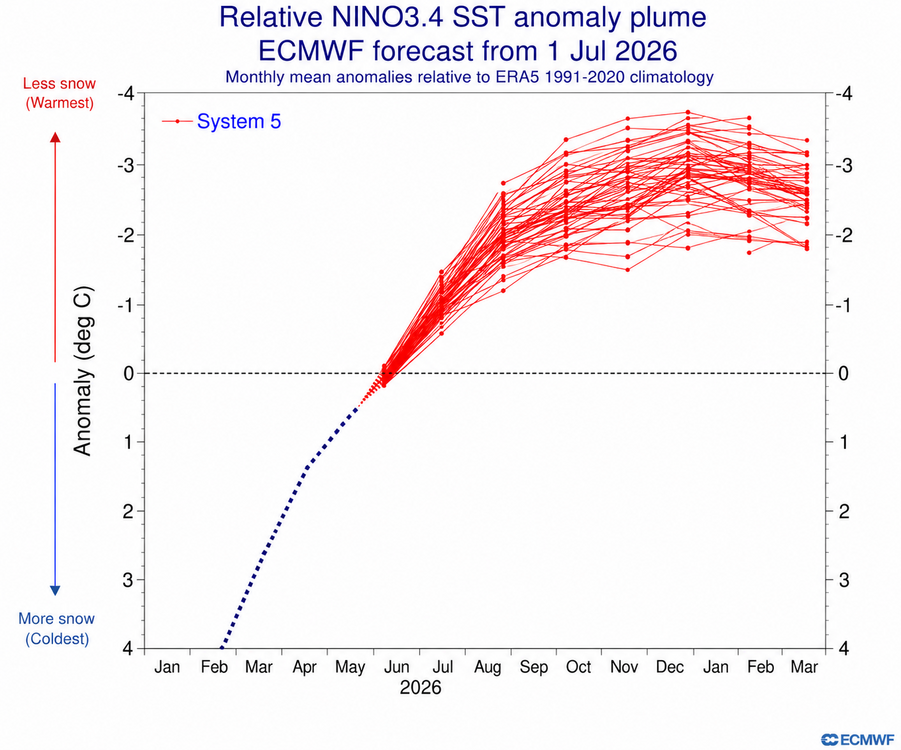
-
'normal' is a result of all events mixed together. Conceptually, even bone-heads ( well.. not Trump supporters) can see that the odds of any future event landing a result squarely on a number that is a mix of everything is thus remote. That means that actually hitting an arbitrarily occurring value dead on whatever that "normal" value is, is no different than the Lotto. Very low odds. Basically ... everything that occurs in nature, perhaps well over 90% likelihood, is going to be ABnormal. This is particularly true for decimals (to the right) of the whole number - the more of them ... the more likely you will not ever see a 'normal' daily high temperature. The significance of the abnormality is what is really needed to be evaluated for that ... we can rely in large part on common sense. If the normal is 82 and it is 104 that quite dope-slapping is obviously more significant that 82.1. But it sounds like y'all could use a refresh, or perhaps a first time introduction to what is known in statistical science as 'Chi-Square test'. A formula that produces a rational value, then interpretive as a method for determining if the frequency differs from expected result and by how much. It looks like this ... ( ...that outta clear things up )
-
With the MADIS charts you look for step changes or changes in trends. There’s a step change in there around the beginning of October last year. Positive error means the station is running cooler than expected; negative error means it’s running warmer than expected. Traditionally BOS has run positive error (cooler than MADIS “expects”) during the warm season. I marked in blue curves above the nighttime temps centered over the 7/1 plots. This warm season you don’t see that…it’s flatlined in the negative error (warmer than expected). The funny thing is that the max temps are running cooler than expected. The net is a little warmer in the means. I’m not sure what’s going on, but it’s almost like when you mount your sensor on the north side of your house…you’re keeping it in permanent shade during the day, but you’re getting radiative heat from the house at night.
-
That extreme heat was brutal, thank goodness we had so many near or even below normal days between those heat waves. I think it was the first time I had 2 consecutive above 100 degree days. After all that heat most places should end up with a near normal temperature in July, would not have expected that.
-

2026-2027 Super El Nino
bluewave replied to Stormchaserchuck1's topic in Weather Forecasting and Discussion
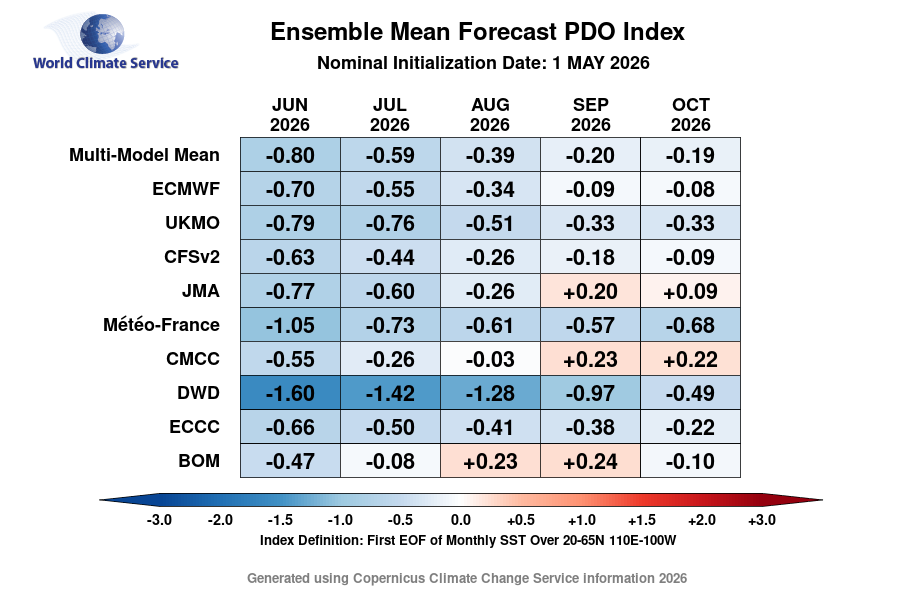
The -PDO continues to exceed seasonal model forecasts.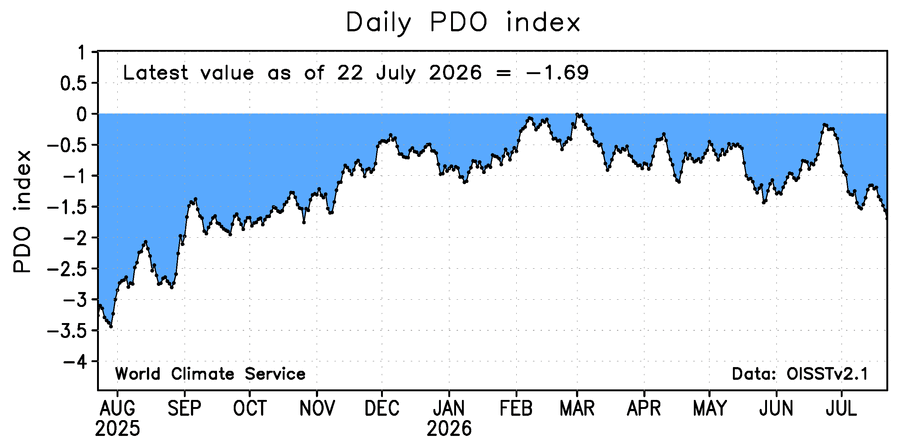
-
 Augdewst looks hotter and hotter each successive ensemble run. Super Ninos love end humid hot summers well into fall
 -

2026-2027 Super El Nino
SnoSki14 replied to Stormchaserchuck1's topic in Weather Forecasting and Discussion
A Nino is just one piece of the pie. Sure it may affect other pieces but it's still a separate entity. And in today's changing climate the signals are more muddled. -
No apparently summer is basically over just like how some said cool weather was here to stay in mid June. Ensembles clearly show more hot weather as August arrives and I wouldn't rule out more 100+ readings
-
2026-2027 Super El Nino
LakePaste25 replied to Stormchaserchuck1's topic in Weather Forecasting and Discussion
They think ENSO is just some sliding scale where the warmest ENSO = no snow and less warm ENSO = more snow and anything that counters “warmest ENSO” means more snow. It’s not true, it’s much more nuanced as it has been discussed plenty of times in this very thread. -
Very pleasant 55 this morning
-
Central PA Summer 2026 Discussion/Obs Thread
pawatch replied to Voyager's topic in Upstate New York/Pennsylvania
48 degrees again this morning. Wow! Voyager you sure got that low down on your weather station.Impressive!