All Activity
- Past hour
-
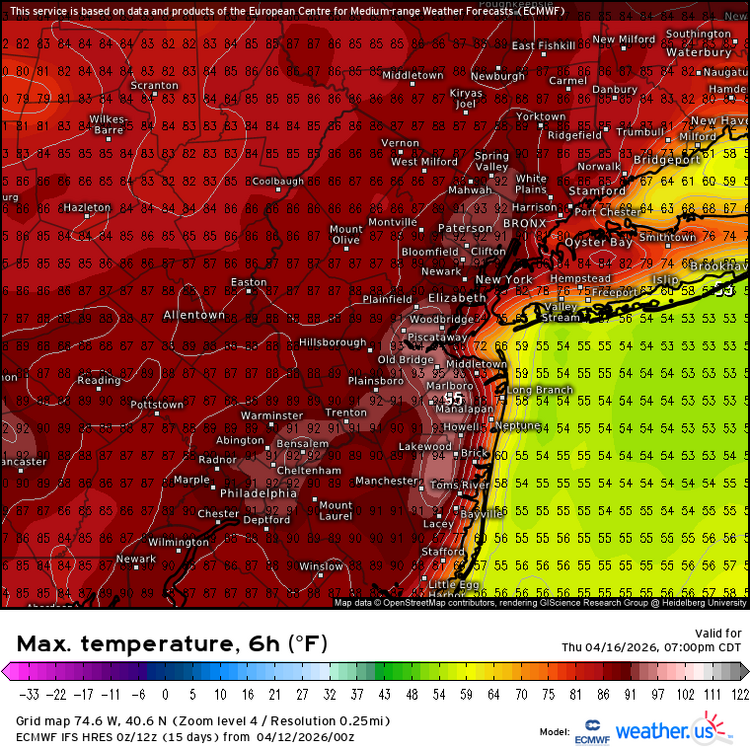
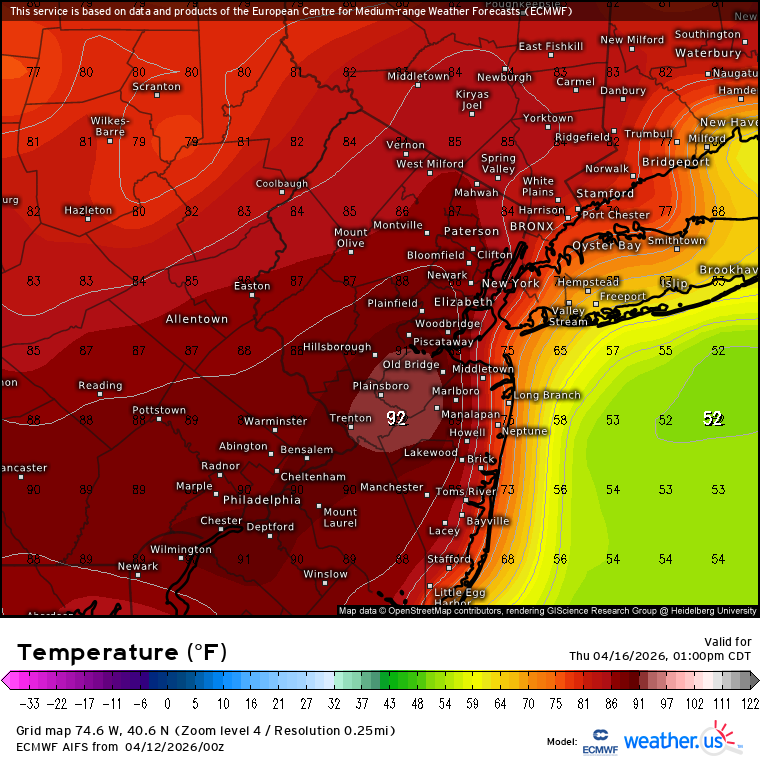
Looks like the usual NJ warm spots can see their first 90° readings of the season this week.


-

2026-2027 El Nino
snowman19 replied to Stormchaserchuck1's topic in Weather Forecasting and Discussion
Because the warm waters are getting sloshed east with the developing El Nino and a +IOD is starting to develop +IOD: https://www.climate.gov/media/11095 -

2026-2027 El Nino
bluewave replied to Stormchaserchuck1's topic in Weather Forecasting and Discussion
There was a great weather observer living in Newark back in those days. The NJ climate office added all the data to the climate record recently. The beauty of these records is that it matches other overlapping accounts from that era. The average snowfall during that era was 44.0” with a DJF average temperature of 30.4°. While this winter was the coldest and snowiest at Newark and other stations in over a decade, the temperatures were still warmer than 30 year average for that era. The snowfall this winter was a little higher than the 30 year mean for that era. Plus they measured snowfall less frequently in the old days compared to today. So the actual seasonal totals could have been around 15 to 20 percent higher if they used the current snowfall measurement techniques. https://news.ucar.edu/14009/snowfall-measurement-flaky-history Monthly a seasonal Total Snowfall for NEWARK LIBERTY INTL AP, NJ Click column heading to sort ascending, click again to sort descending. Mean 0.1 0.8 9.4 12.1 12.6 7.3 1.8 44.0 1872-1873 0.0 4.0 25.1 14.1 23.3 2.2 3.0 71.7 1871-1872 0.0 T 8.5 2.0 5.0 8.5 T 24.0 1870-1871 0.0 T 5.0 16.0 16.1 1.3 2.0 40.4 1869-1870 T T 8.1 1.8 8.5 11.0 3.0 32.4 1868-1869 T 0.0 9.5 11.0 12.0 5.0 0.6 38.1 1867-1868 0.0 T 15.5 23.8 14.0 15.0 7.0 75.3 1866-1867 0.0 T 7.0 23.5 15.5 17.5 T 63.5 1865-1866 0.0 0.0 13.1 11.8 8.0 1.5 T 34.4 1864-1865 0.0 0.3 26.0 10.5 12.5 T 0.0 49.3 1863-1864 0.0 T 4.3 7.0 1.0 7.0 T 19.3 1862-1863 0.0 6.5 8.0 10.0 13.0 10.9 1.8 50.2 1861-1862 0.0 1.0 1.0 12.0 25.5 4.6 6.0 50.1 1860-1861 0.0 T 7.0 20.6 1.3 17.0 2.0 47.9 1859-1860 3.0 0.0 5.1 11.3 25.0 2.5 T 46.9 1858-1859 0.0 5.5 6.5 12.3 15.8 6.0 T 46.1 1857-1858 0.0 T 4.5 1.8 10.5 10.5 T 27.3 1856-1857 0.0 0.5 4.3 28.1 2.1 17.0 0.0 52.0 1855-1856 0.0 T 9.0 32.8 5.0 11.0 0.0 57.8 1854-1855 0.0 T 8.0 18.5 16.0 2.5 T 45.0 1853-1854 0.0 M 14.5 15.0 23.5 2.8 13.5 69.3 1852-1853 0.0 T T 15.5 2.3 7.0 T 24.8 1851-1852 0.0 2.0 7.0 20.0 14.0 16.0 4.3 63.3 1850-1851 0.0 0.0 6.0 2.5 3.5 10.5 2.0 24.5 1849-1850 0.0 0.0 11.0 3.0 T 9.0 8.0 31.0 1848-1849 0.0 1.3 24.0 T 13.0 6.0 0.0 44.3 1847-1848 0.0 T 6.0 T 8.0 5.0 T 19.0 1846-1847 0.0 1.5 12.0 10.0 21.0 4.3 0.5 49.3 1845-1846 0.0 T 8.5 16.5 28.0 T T 53.0 1844-1845 0.0 0.5 6.5 5.5 20.5 5.5 T 38.5 1843-1844 0.0 1.3 9.5 5.5 13.5 1.8 0.0 31.6 Monthly Mean Avg Temperature for NEWARK LIBERTY INTL AP, NJ December to February Click column heading to sort ascending, click again to sort descending. Mean 31.9 28.8 30.4 30.4 1872-1873 24.7 25.1 27.4 25.7 1871-1872 28.4 29.3 29.7 29.1 1870-1871 33.6 26.5 28.6 29.6 1869-1870 32.9 35.8 30.7 33.1 1868-1869 28.2 32.8 33.3 31.4 1867-1868 26.7 26.3 21.7 24.9 1866-1867 30.7 22.9 36.4 30.0 1865-1866 35.2 25.2 29.9 30.1 1864-1865 31.9 22.8 29.2 28.0 1863-1864 31.4 29.5 32.6 31.2 1862-1863 32.7 32.9 31.4 32.3 1861-1862 33.6 27.6 30.0 30.4 1860-1861 28.8 27.8 34.2 30.3 1859-1860 29.3 29.9 28.9 29.4 1858-1859 32.7 29.6 32.6 31.6 1857-1858 37.0 36.0 26.4 33.1 1856-1857 29.8 19.0 35.7 28.2 1855-1856 33.6 21.4 24.0 26.3 1854-1855 28.8 32.3 25.8 29.0 1853-1854 32.8 28.8 30.6 30.7 1852-1853 39.7 30.5 34.9 35.0 1851-1852 27.2 25.5 31.5 28.1 1850-1851 33.8 33.3 36.9 34.7 1849-1850 33.1 34.4 35.1 34.2 1848-1849 39.9 25.8 24.9 30.2 1847-1848 36.3 32.8 30.5 33.2 1846-1847 31.5 30.4 29.7 30.5 1845-1846 27.6 30.2 27.1 28.3 1844-1845 33.0 33.2 31.3 32.5 1843-1844 33.4 25.1 31.3 29.9 -
26.2F low.
-
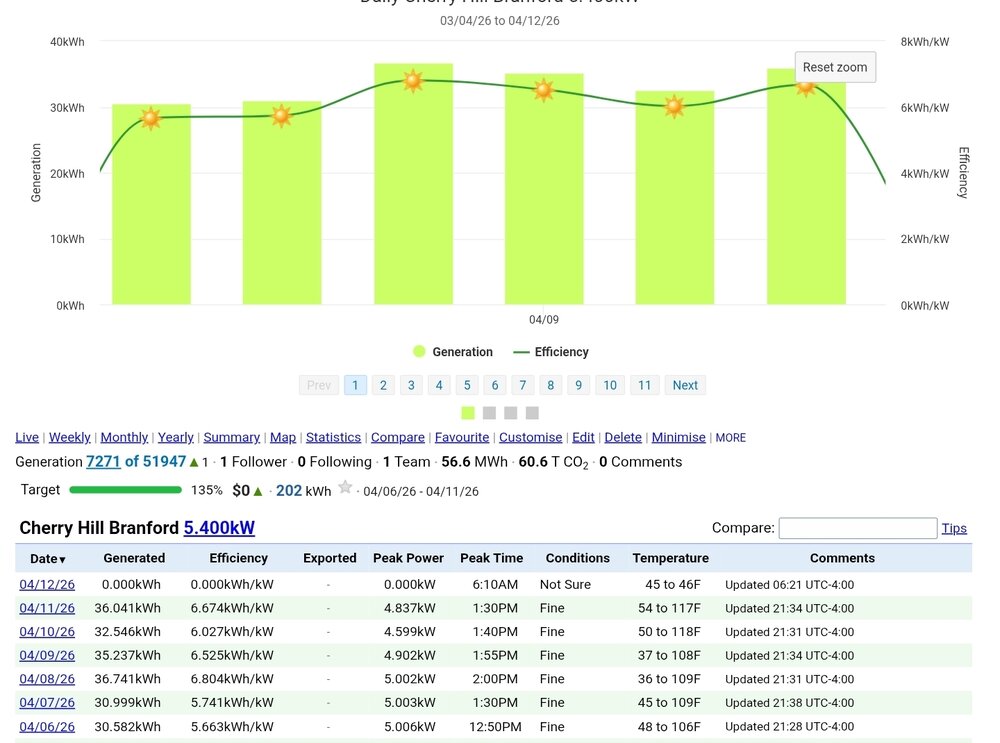
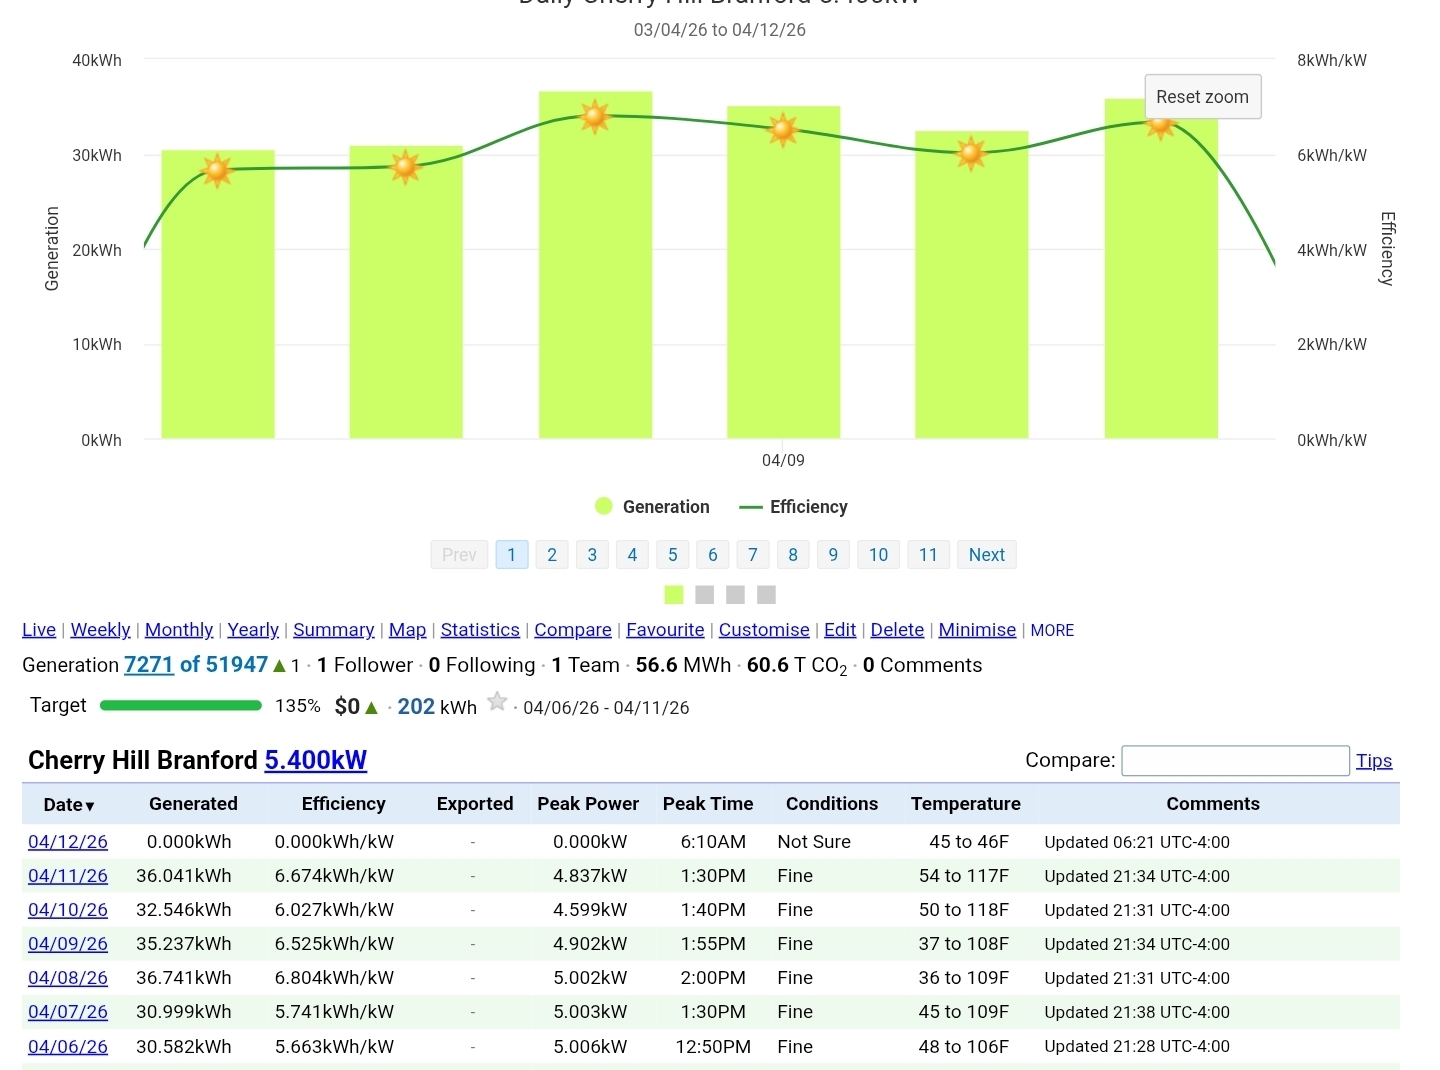
What a week for solar production. Been averaging around 6 kwh/kw which is at or near peak efficiency.
-

Central PA Spring 2026 Discussion/Obs Thread
mahantango#1 replied to Voyager's topic in Upstate New York/Pennsylvania
31 this morning. -
28.9° Glad I brought the plants in.
- Today
-

2026-2027 El Nino
mitchnick replied to Stormchaserchuck1's topic in Weather Forecasting and Discussion
Seems strange to me that the western equarltorial Pacific has cooled over the last 7 days west of the dateline. Any ideas? The wwb is to last around 10 days per Cfs2 starting around the 17th. But I expected it to be warming west of the dateline. The cooling is on 2 different maps, though more apparenton one than the other..png.f0b7a4869b463d833798f8ddd27e57dc.png)
.thumb.png.79c154b9b4483c68b211d84d6c2cda4d.png)
-
Yesterday's winds were so bad that I lasted only two innings at my grandson's HS baseball game in Stroudsburg. They were cold, and blowing from left field to right field and right into my face.
-
Congrats

-
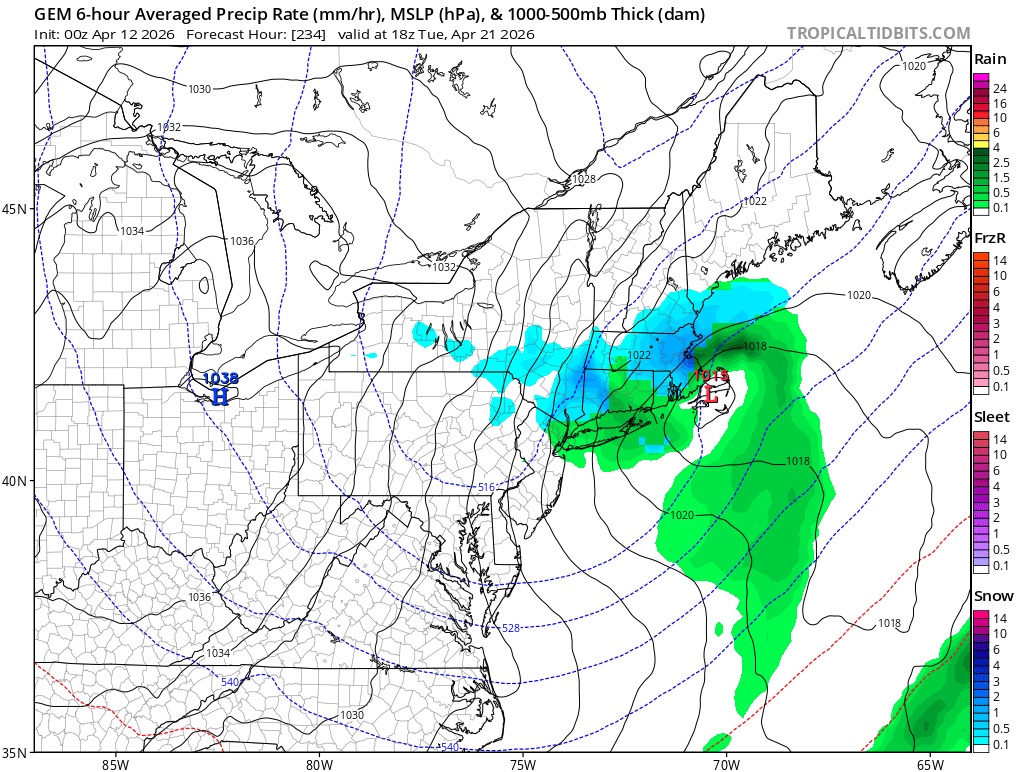
We CMC
-
Well well well I was looking at an older picture of the Woolly Camera. I reloaded it and man that place is a snow globe, with 4 inches on the Woolly Lot. That snow is blowing all over the place and visibilities are shot all to hell and back! Even the Village Level has an inch of snow and even there the snow is so heavy its unbelievable. You have to keep refreshing the damn camera! I was looking at what was likely a 5 hours old image. Well it's updated and that place is getting so fracking DEMOLISHED! https://www.mammothmountain.com/on-the-mountain/mammoth-webcam/woolly-cam https://www.mammothmountain.com/on-the-mountain/mammoth-webcam/the-village At the Woolly Lot level snow is now coming down so fracking HARD that you can't even see the ground! They are just getting utterly DESTROYED by torrential snow that is being whipped into a milkshake froth! I'd estimate 4-5 inches on the Lot with drifts on the steps to 9 inches, temp is 26 and falling! The forecast for tonight WAS 9-13 inches. They just updated it to 14 to 20 inches! I am gonna stay up all damn NIGHT LONG! Its a gray froth, wind is simply BLASTING that heavy snow sideways so hard, it's a grey froth and piling up. In other news the line of impressive storms in Texas will clip us to the north in all likelihood I will end up with 5 minutes of drizzle/light rain. But that SNOW in Mammoth is UNDENIABLE! It is just POURING DOWN in a gray froth! Plow guy has arrived on the Woolly Lot at 3am Texas time. Snow looks to be about 6-7 inches deep. Still pouring down and blowing like a wild banshee!
-
Orange and red radar returns are directly over Mammoth. Mammoth has light flurries. It's 28 degrees with winds to 60 mph. Roads are mainly wet. I have never in my entire life, ever seen such a sucky suck COC winter at Mammoth. And while I am at it, THIS IS NOT CHURCH! COC is NOT spelled COC. It is C-O-C-K! Get this damned message board whipped into shape! NOW! It's high spring at Mammoth now. Snowpack on the slopes is thin. Skiers are being warned of hidden obstacles. I hope we get such a record, devastating super ultra El Nino this year, that Mammoth gets 240 feet of snow, and Buda gets 500 inches of rain. I am completely, utterly DISGUSTED with this suck ass winter in the Sierra. This winter is so horrible at Mammoth, with wet streets at 28 degrees with light flurries under stark red/orange returns, that we need to change the NAME, to the DMV Resort. The Washington DC Resort. Because even at 11,000 feet, Mammoth has light flurries and wet roads just like Northern Virginia in mid January. And it sucks gigantic GOAT BALLS!
-
Was driving through Grand Rapids yesterday and noticed the Grand River was awfully high. Same with local rivers and streams around my neck of the woods in Battle Creek. Going to be a humid summer.
-
Oh i agree with you,but at least we are seeing the tropical convection getting displaced in the upcoming days,we havent seen this in quite some time,which seems to be by a Rossby Wave in the EP and not WP
-

E PA/NJ/DE Spring 2026 Obs/Discussion
Birds~69 replied to PhiEaglesfan712's topic in Philadelphia Region
Drought guy! Only thing I have to add at 12:15am as I was walking through a park in upper Mont County today....stuff does appear to be dry, streams weak flow...perhaps Blatter problems. (RedSky?) Montgomery drought maps: Stuff is dry but not super smash yourself in the face horrible... https://www.drought.gov/states/pennsylvania/county/montgomery -

2026-2027 El Nino
e pluribus unum replied to Stormchaserchuck1's topic in Weather Forecasting and Discussion
1889-90 and 1892-93 both appeared to be very strong La Ninas, as well as 1909-10. The 1893 Nina was possibly the strongest on record. https://psl.noaa.gov/enso/mei.ext/table.ext.html -
E PA/NJ/DE Spring 2026 Obs/Discussion
Albedoman replied to PhiEaglesfan712's topic in Philadelphia Region
not looking long term guys. I just want to get through May. If I do not see a major pattern change where more gulf moisture infused in these cold frontal passages, we are really screwed. Every front is coming through bone dry as this progressive pattern is relentless. Folks, I cannot actually remember the last time when we had a stationary front over the east coast/mid atlantic with a barrage of LP shortwaves riding the front with temps producing warm enough to produce instability and thunderstorms. I am hoping May will bring this change or we are in trouble. Past history indicates a major pattern change in mid May. -
Have a shot at our first 70 degree dew Tue or Wed. This would be less than a month after the blizzard on March 16th.
-
We did…but that set the stage for the next two winters(92-93, and 93-94) which started the big run. And then we had a shit year, and then 95-96 broke 93-94! Before all that started everybody thought the big winters were a thing of the past. That’s why I laugh at the pessimists now…I lived through the horror, and we came back stronger than ever. And we will AGAIN!
-
'91-'92 was a strong El Nino and we had Bob and the perfect storm leading into that winter. Unfortunately, snowfall around here was paltry. I wouldn't mind some anomalous storms again this fall but would hope the winter is better than back then.
-
This week back in ‘23 was very warm here… 70’s to 80’s to mid 90’s in the same week. It happens. Maybe the Pope can ride a wheelie to that shit..yet saying he’s never seen anything like this benign run of the mill garbage? What a dam JOKE!
-
Yeah, sure
-
For some reason I think it was ‘92..? But in April of ‘02 we had a banger heatwave where daytime highs were 90’s…cuz I had my Fatboy out all evening having a blast riding all over this area…was like a July/August night in April!!! Awesome!
-
73.4 here - mowed the yard for the first time, it was actually enjoyable.


.png.e69ced4a2cc2fa2a51b3db3a5f7d97cb.png)


.thumb.jpg.ad3a2e31d30aff035044689b311a0540.jpg)