All Activity
- Past hour
-
Brad P with more good news. Make this shit show stop please.
-
It's not like they had all offseason to come up with a few creative 2pt conversion plays when the game is on the line. When I saw that play, all I could think of was all the times I stuffed the Broncos in Super Tecmo Bowl when they would run that trash play. It only works if you execute blocks, so let's expose our weakest unit out there. Bates is 6'6" and 256 pounds, if you are going to use him, have him go two yards, box out and throw him a jump ball.
-
Forgetting, of course, that the warmest December on record at BWI, 12/15, was followed the next month with the single biggest snowstorm on record during a strong Niño. Not to mention the 3rd or 4th largest snowfall in 2/83 was an east based strong Niño. You should know better that's how it works around here.
-
Ice was pretty diffuse this year so the extent numbers aren't impressive. Too early to call the min quite yet as we're only about 20k above the 2026 min of 4.574 million sq km....but if that number holds, this would rank 11th lowest for extent minimum. This is for NSIDC (SSMI/S) extent....other sources like AMSR2 or DMI might be a bit different, but looking at them al, it's the same general idea. Extent minimum wasn't very low this year given the ice staying pretty diffuse and not compact.
-

2026-2027 Record-breaking El Nino
buckeye replied to Stormchaserchuck1's topic in Weather Forecasting and Discussion
WAD > CAD I'll take it -
107 feels like temp 97.2 so far seriously f this
-
NSIDC area is currently at 2.86 million sq km...which is about 150k above the minimum back on 9/8. I think it is getting fairly safe to say we've reached the minimum. It would be highly unlikely to achieve a loss greater than 150k this late in the season and with lots of easy lower concentration to refreeze near the pole right now. The 2026 minimum of 2.711 million sq km would be 7th lowest (barely staying above 2025's 2.706 million sq km)....so we just barely miss on a top 5. Last 20 years of SSMI/S minimums since 2007's benchmark season: 1 2012 2.228429 2 2016 2.463209 3 2024 2.470035 4 2020 2.5859 5 2023 2.62866 6 2025 2.707455 7 2026 2.71105 8 2019 2.871403 9 2011 2.916451 10 2007 2.954993 11 2017 3.000742 12 2010 3.072129 13 2008 3.079552 14 2015 3.139137 15 2021 3.1658 16 2022 3.20126 17 2018 3.235357 18 2009 3.547109 19 2014 3.576643 20 2013 3.607877
-
That was a great storm.
-
Oh I lost hope decades ago
-
As long as you have an ID you can either take the more advanced classes, or slide in for a refresher.
- Today
-

Septorcher 2026 Discussion - Endless Summer
kdxken replied to Damage In Tolland's topic in New England
You are Not alone.
-
Thanks Chuck
-

Septorcher 2026 Discussion - Endless Summer
ineedsnow replied to Damage In Tolland's topic in New England
66/41 beautiful day -
you aren't getting a negative epo. blocking in a nino this strong just means a bunch of well placed rainstorms
-
this is stronger and further east than 1997. why is anyone remotely hopeful
-
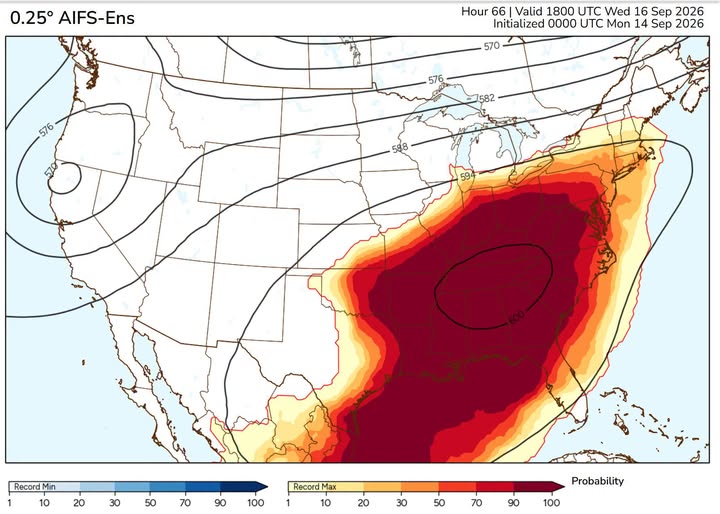
12z Euro/GFS both try to pop a 600dm ridge later this week over the southeast
-

Augdewst 2026: Summer's Last Stand
OceanStWx replied to Prismshine Productions's topic in New England
Just seeing this now. Big help I know. I don't recall seeing something quite like this. Maybe a whole box upgraded to a Tornado Watch as situational awareness changes. I would just look back at the timing and reasoning in the MCDs and watch texts: MCD issued 1230 pm - SVR watch issued at 230 pm - TOR watch issued 255 pm - MCD issued 326 pm explaining things intensified more than expected I would prefer a MCD explaining the reasoning first, but maybe there was ongoing discussion between WFOs and SPC behind the scenes and it needed to happen fast. -
 nw baltimore wx changed their profile photo
 -
still not enough protection for #5, but towards the end of the game, he was looking pretty good IMO
-

Septorcher 2026 Discussion - Endless Summer
MJOatleast7 replied to Damage In Tolland's topic in New England
And you'll both be secure in the knowledge that men are, with some exceptions, hardwired to be 10-15 degrees F warmer than women. Seriously, there ought to be a power-generating doohickey that sits between us in bed and somehow makes use of the thermal gradient and converts it into storable energy to power your house. Much like those machines that float in the ocean and generate electricity from wave energy. -
Sub-50s on the mesonet!
-
Always a safe bet south of NYC.
-
This is what September should be
-

2026-2027 Record-breaking El Nino
csnavywx replied to Stormchaserchuck1's topic in Weather Forecasting and Discussion
No surprise the CFS is having problems here. It's been having issues maintaining the initialized thermocline slope for a while now -- hence the reason it continues to underforecast Nino 1+2. Some of that may be related to the model's native climo, and/or a bias towards reverting towards stronger easterlies. This is particularly important for a very strong, very east-based event. -
I just look at 72-73,82-83,97-98 and 15-16..those are warm winters..those are the strong ninos of the past 50 years.Doesnt mean it cant snow..but many here will be complaining in December and January with temps in the 50s and rain, like we were those winters.
-
Had AI summarize an update based off the latest August readings. : ENSO 2026 The latest August readings show Niño 3.4 near +1.9°C, Niño 3 near +2.8°C, Niño 1+2 over +3.0°C, and Niño 4 still warm in the PSL dataset. MEI.v2 is also very strong at +2.54, while RONI is up to +1.67. The key point is that this is not just a weak or central-Pacific event right now. The current structure still looks very east-Pacific to east-central-Pacific, with some basinwide support depending on which Niño 4 dataset is used. Parameter Latest 2026 Reading Period What It Shows Niño 3.4 +1.89°C PSL / +1.8°C CPC Aug 2026 Strong; near very strong threshold Niño 3 +2.83°C PSL / +2.5°C CPC Aug 2026 Very strong east-central warming Niño 1+2 +3.28°C PSL / +3.4°C CPC Aug 2026 Extreme far-eastern Pacific warmth Niño 4 +1.29°C PSL / +0.1°C CPC Aug 2026 Dataset-dependent; PSL basinwide warm, CPC relative index lower RONI +1.67 Aug 2026 Strong relative Niño 3.4 signal ONI +1.80 Latest available Strong 3-month oceanic El Niño MEI.v2 +2.54 Aug 2026 Very strong coupled ocean-atmosphere signal SOI -4.00 Latest available July value Very strong atmospheric El Niño response OLR -1.00 Aug 2026 Enhanced tropical convection Heat Content +2.75 Aug 2026 Strong subsurface warm support 200mb Zonal Winds -6.44 Aug 2026 Strong upper-level easterly anomaly Looking at the August SST structure, 1997 still comes out as the best overall match because of the very strong east-Pacific signal. August 2026 is actually warmer than August 1997 in Niño 3.4, but 1997 remains a strong match in Niño 3 and Niño 1+2. 2015 is the best basinwide/intensity analog, especially with the warmer Niño 4 support. 2023 remains a useful recent analog for the eastern-Pacific SST shape, but it was much weaker on the coupled-atmosphere side at the same point. Rank Analog Year Aug Niño 3.4 Aug Niño 3 Aug Niño 1+2 Aug Niño 4 Match to Aug 2026 Baseline 2026 +1.89 +2.83 +3.28 +1.29 Current 1 1997 +1.40 +2.60 +3.64 +0.67 Closest east-Pacific structure; very strong Niño 3 / 1+2 match 2 2015 +1.49 +1.87 +1.73 +1.04 Best basinwide/central support match; weaker eastern zones than 2026 3 2023 +1.20 +1.88 +2.54 +0.90 Good recent east-Pacific analog, but weaker Niño 3.4 and coupling 4 1982 +0.44 +0.83 +0.89 +0.13 Poor August SST match, but major-event trajectory later 5 1972 +0.73 +1.60 +2.00 +0.06 Good east-Pacific analog, much weaker Niño 3.4 / Niño 4 6 1965 +0.68 +0.96 N/A N/A Useful historical analog, but weaker August intensity 7 1957 +0.81 +1.20 N/A N/A Strong older event, but weaker than 2026 in August 8 1991 +0.73 +0.63 +0.18 +0.56 Warm/coupled event, but far weaker east-Pacific structure 9 2002 +0.67 +0.40 +0.12 +0.65 More central/basinwide, not close to the east-Pacific warmth 10 2009 +0.61 +0.72 +0.75 +0.64 Developing El Niño, much weaker than 2026 The coupling side is also impressive. MEI.v2 for August 2026 is +2.54, which is higher than August 1997, 2015, and 1982. That is a major reason this event should not be dismissed as just ocean warmth without atmospheric support. SOI was also extremely negative in July, though the August SOI value was not available in the same dataset at the time of comparison. On the coupled ocean-atmosphere side, 1997 and 2015 remain the strongest matches, with 1982 still important as a major-event trajectory analog. Rank Analog Year MEI.v2 Aug RONI JJA / Latest Coupling Match Baseline 2026 +2.54 +1.67 latest Current 1 1997 +2.27 +1.8 Very close; strongest full coupling analog 2 2015 +1.95 +1.5 Very strong, but weaker than 2026 3 1982 +1.91 +1.1 Strong; event exploded later 4 1972 N/A +1.4 Strong RONI trajectory; pre-MEI.v2 5 1991 +0.37 +0.8 Weaker coupling at same time 6 1994 +0.88 +0.6 Moderate coupling, less similar 7 2002 +1.01 +0.8 Moderate, weaker than 2026 8 2009 +0.56 +0.4 Much weaker 9 2023 +0.51 +0.8 Much weaker coupled signal at same point 10 1986 +0.97 +0.6 Slower-developing event Overall, I would rank the analog package as 1997–98 first, 2015–16 second, 2023–24 third for SST structure but lower for coupling, then 1982–83 and 1972–73. The biggest takeaway is that 2026 is already running warmer than many of the classic strong El Niño years at the August checkpoint, especially in Niño 3.4 and MEI. The event still does not look like a classic Modoki right now because Niño 1+2 and Niño 3 remain extremely warm. If anything, the current look is more east-Pacific / east-central-Pacific with some basinwide support. Overall Rank Analog Current Match Why 1 1997–98 Best overall Best blend of very strong eastern-Pacific warmth, rapid strengthening, strong MEI, and major-event trajectory 2 2015–16 Very high Strongest basinwide/intensity analog; Niño 4 and Niño 3.4 support are good matches 3 2023–24 High for SST shape, lower for coupling Good recent east-Pacific SST analog, but much weaker MEI/SOI coupling at same time 4 1982–83 High trajectory analog Not close in August SSTs, but strong historical major-event analog by fall/winter 5 1972–73 High secondary Classic east-Pacific El Niño, but weaker Niño 3.4 and Niño 4 in August 6 1965–66 Moderate-high Useful historical east-Pacific/SOI analog, weaker SST intensity 7 1957–58 Moderate-high Strong older event, but August 2026 is already warmer 8 1991–92 Moderate Warm-event analog, but much weaker east-Pacific structure 9 2002–03 Moderate More central/basinwide and weaker eastern Pacific 10 2009–10 Lower-moderate El Niño winter analog, but weaker August development/coupling Bottom line: the latest August data keep 1997 as the best overall analog, 2015 as the best basinwide/intensity analog, and 1982 as a key major-event trajectory analog. 2023 is still useful for the east-Pacific SST pattern, but it is not nearly as good for coupling. Right now, this continues to look like a strong to potentially very strong east-Pacific / basinwide El Niño rather than a classic Modoki.