All Activity
- Past hour
-
Central PA Summer 2026 Discussion/Obs Thread
Mount Joy Snowman replied to Voyager's topic in Upstate New York/Pennsylvania
Nope, beautiful day. I think it was just his time ha. Yeah I have a neighbor who is a tree guy and his crew is here right now taking care of it, glad it's nice conditions for them. -
Probably up enough to end water restrictions soon
-
Temps stayed in the mid/upper 70's yesterday. Point has backed off the heat for the weekend. Screw the heat, just bring some good stms
-

2026 Mid-Atlantic Severe Storm General Discussion
NorthArlington101 replied to Kmlwx's topic in Mid Atlantic
In my experience it doesn't work in Tapatalk but works otherwise -
July 24 1987: A historic deluge ends in the Twin Cities. Two-day totals include over a foot of rain at Bloomington. Nearly 10 inches falls in downtown Minneapolis, and near 9 inches is recorded in St. Paul. At one time the water reaches a depth of 13.5 feet on I-494 near East Bush Lake Road. I-494 in Bloomington would be closed for nearly 5 days. 1891: Heavy frost hits Elkton in Mower County in southeast Minnesota. The frost kills all vegetable crops. The low in Elkton is 34, and the Twin Cities have a low of 49. For Friday, July 24, 2026 1886 - Rain fell at Lawrence, KS, for the first time in four weeks. Rain fell over much of the state of Kansas that day relieving a severe drought which began in May. The very dry weather ruined crops in Kansas. (David Ludlum) 1936 - A record all time Kansas state high temperature set just 6 days earlier was tied in the town of Alton, located in Osborne County. (US National Weather Service Wichita) 1942 - The temperature at Las Vegas, NV, hit 117 degrees to set an all-time record for that location. The record was tied on July 19, 2005. 1947 - One of the most powerful strokes of lightning ever measured yielded 345,000 amperes of electricity in Pittsburgh, PA. (The Weather Channel) 1952 - The temperature at Louisville, GA, soared to 112 degrees to establish a state record. (The Weather Channel) 1980 - Claudette, a weak tropical storm, deluged southeastern Texas with torrential rains. The Houston suburb of Alvin received 43 inches, a 24 hour record for the U.S. (David Ludlum) 1987 - Twenty-one cities in the eastern U.S. reported record high temperatures for the date. The high of 91 degrees at Beckley, WV, was their hottest reading in 25 years of records, and marked their third straight day of record 90 degree heat. Bakersfield, CA, dipped to 60 degrees, marking their eighth straight morning of record cool weather. (The National Weather Summary) 1988 - Afternoon and evening thunderstorms produced large hail and damaging winds in Oklahoma, and over Nebraska and Wisconsin. Thunderstorms produced wind gusts to 75 mph at Brainerd, NE. (The National Weather Summary) (Storm Data) 1989 - Afternoon thunderstorms produced some flash flooding in New Mexico. Albuquerque, NM, was deluged with an inch and a half of rain in forty minutes. Evening thunderstorms soaked Whie Pine, PA, with two inches of rain in one hour. (The National Weather Summary) (Storm Data) Observances: 24 Fri National Tequila Day 24 Fri Cousins Day 24 Fri National Drive-Thru Day 24 Fri Pioneer Day 24 Fri International Self Care Day 24 Fri Amelia Earhart Day 24 Fri National Cousins Day 24 Fri National Day of Motoring 24 Fri National Thermal Engineer Day 24 Fri Tell An Old Joke Day
-

Central PA Summer 2026 Discussion/Obs Thread
Voyager replied to Voyager's topic in Upstate New York/Pennsylvania
For sure. That was amazing! -
Central PA Summer 2026 Discussion/Obs Thread
Mount Joy Snowman replied to Voyager's topic in Upstate New York/Pennsylvania
For @Yardstickgozinya or any other tree dudes who want to chime in. Pic of the uprooted base.....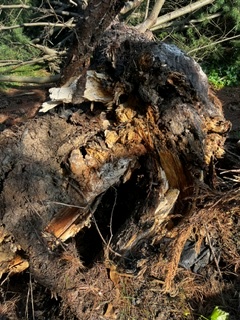
-
 Just a nasty mix of weed smoke, sawdust, and gasoline exhaust clouding vision
 -
 Next week kind of all over the place on models in NNE, some aren’t bad, and some wash out like 3 days.
 -
 An aug 1944 like stretch could be staring them right in the face and they wouldn't even be able to tell with all the curtains of smoke wafting between them and the computer screen
 -
(002).thumb.png.6e3d9d46bca5fe41aab7a74871dd8af8.png) @chubbs you didn't answer my previous post "The problem that NCEI and Charlie has is that in reality Coatesville was home to Lukens Steel — a continuously operating steel mill since 1810, one of the largest specialty steel producers in the country, still headquartered there through 1982 and beyond this is a station within a mile of significant industrial activity! This of course is a textbook candidate for a persistent local warm bias — waste heat, paved/industrial surfaces, altered local airflow. But here's the problem for NCEI and Charlie to address - the Coatesville 1SW move explanation doesn't match the data adjustments made by NCEI. The facts are that Lukens was arguably at its industrial peak in the postwar decades (1946–82) — yet that's exactly the period where the adjustment (and the residual) is smallest, not largest. If growing industrial heat were the main driver, the bias should have gotten worse over the 20th century, not better. So it is not TOB adjustments and clearly not site moves behind these adjustments so what say you Charlie?
@chubbs you didn't answer my previous post "The problem that NCEI and Charlie has is that in reality Coatesville was home to Lukens Steel — a continuously operating steel mill since 1810, one of the largest specialty steel producers in the country, still headquartered there through 1982 and beyond this is a station within a mile of significant industrial activity! This of course is a textbook candidate for a persistent local warm bias — waste heat, paved/industrial surfaces, altered local airflow. But here's the problem for NCEI and Charlie to address - the Coatesville 1SW move explanation doesn't match the data adjustments made by NCEI. The facts are that Lukens was arguably at its industrial peak in the postwar decades (1946–82) — yet that's exactly the period where the adjustment (and the residual) is smallest, not largest. If growing industrial heat were the main driver, the bias should have gotten worse over the 20th century, not better. So it is not TOB adjustments and clearly not site moves behind these adjustments so what say you Charlie? -
.thumb.gif.f92b16c631a1d15d405ed77b33f0710d.gif) hope we shatter some records. Or at least get a few days 80+ dews
hope we shatter some records. Or at least get a few days 80+ dews -

Central PA Summer 2026 Discussion/Obs Thread
Jns2183 replied to Voyager's topic in Upstate New York/Pennsylvania
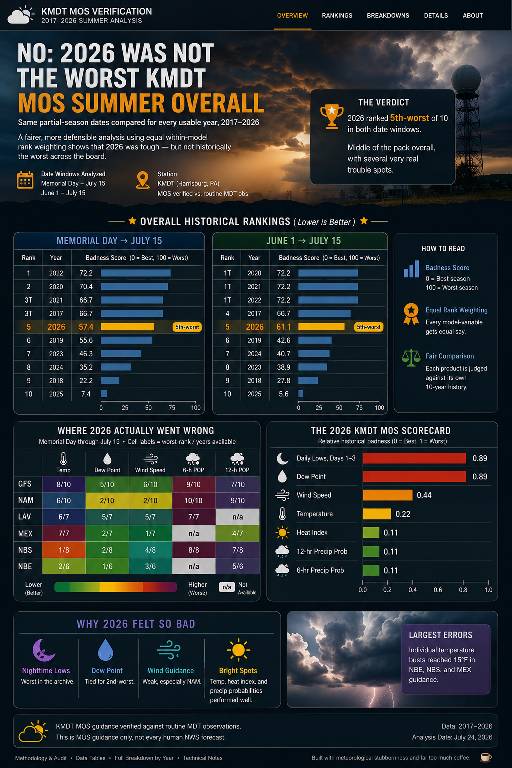
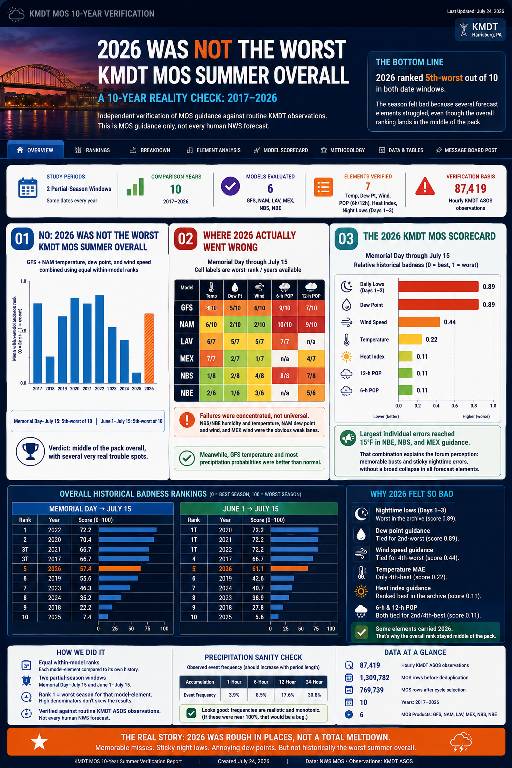
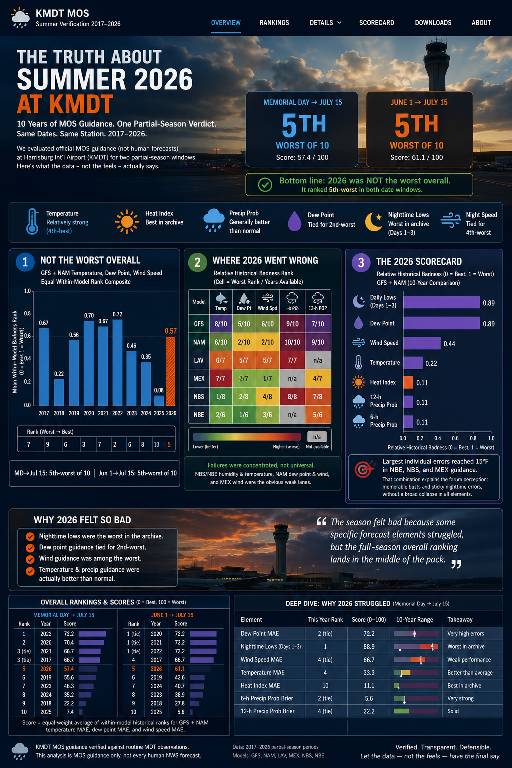
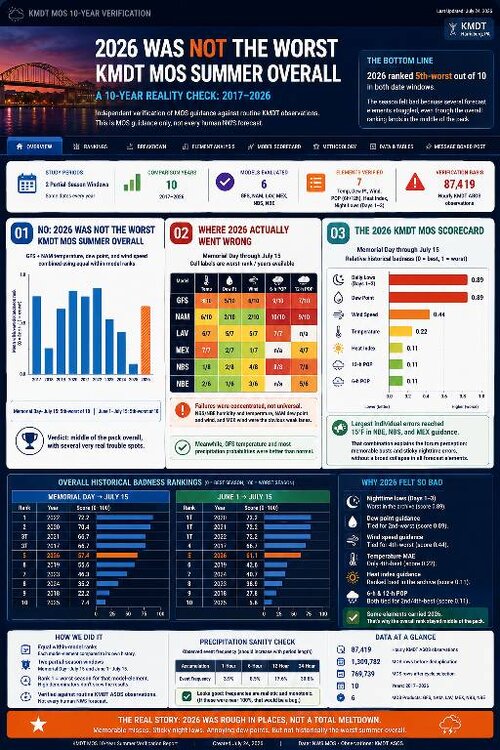
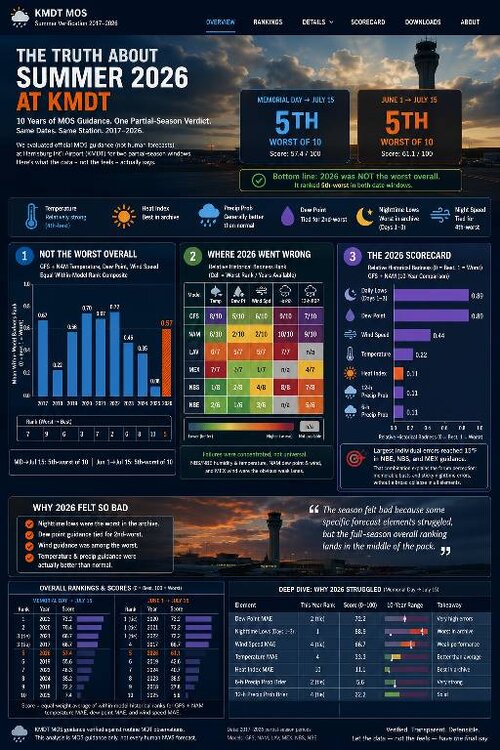
I need some feedback before a website page that's basically a report which is better a, b or c Sent from my SM-S731U using Tapatalk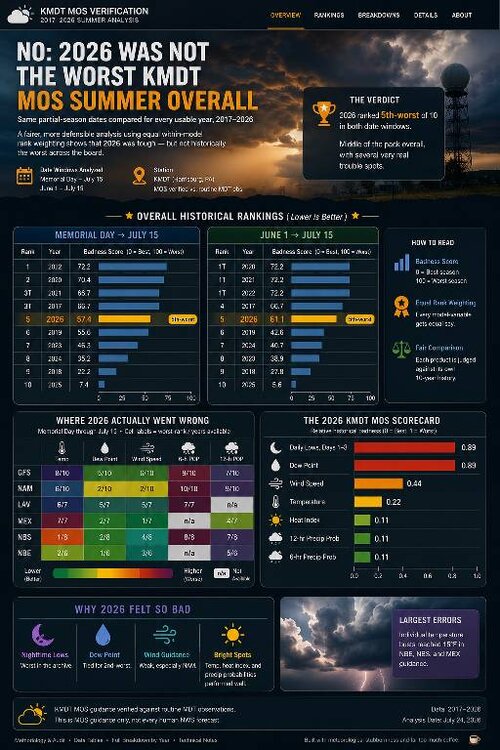
-
Central PA Summer 2026 Discussion/Obs Thread
Jns2183 replied to Voyager's topic in Upstate New York/Pennsylvania
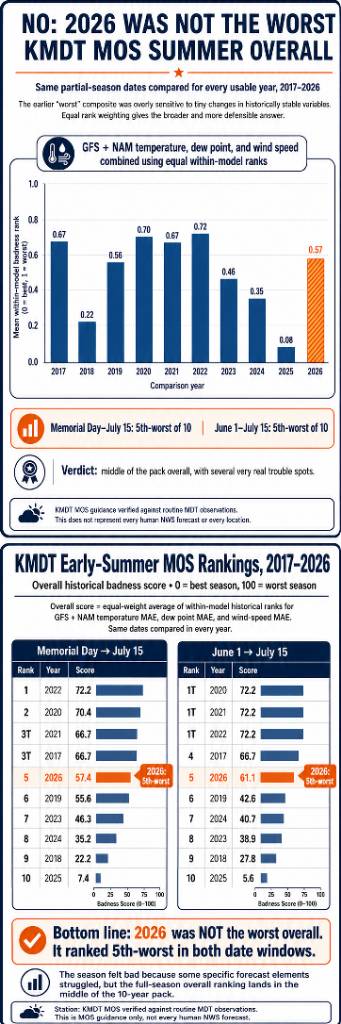
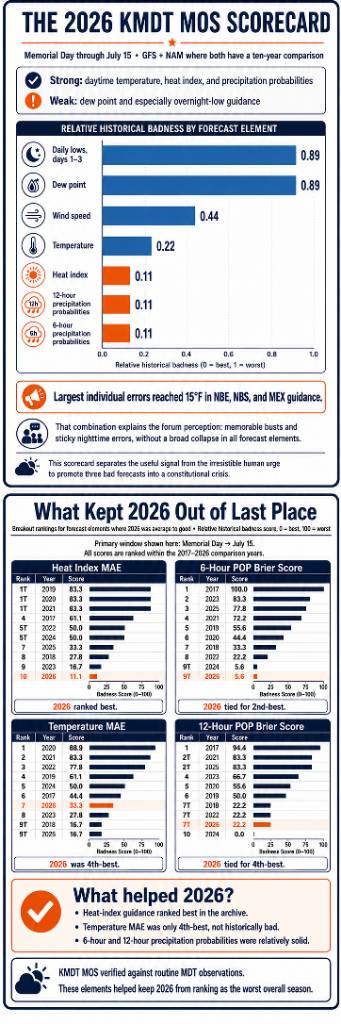
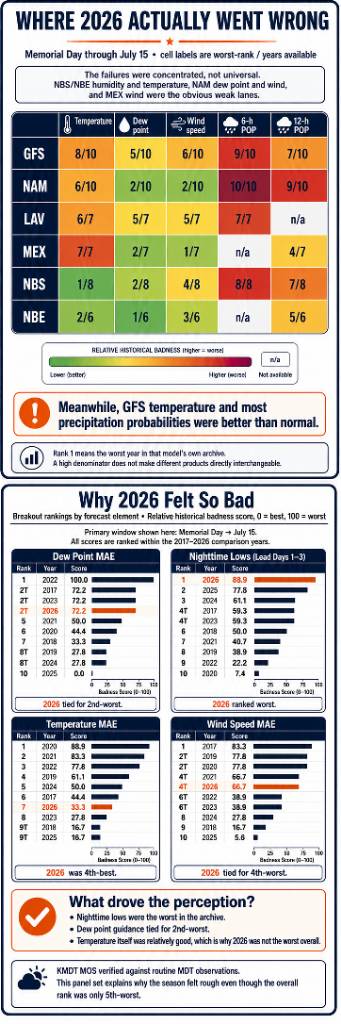
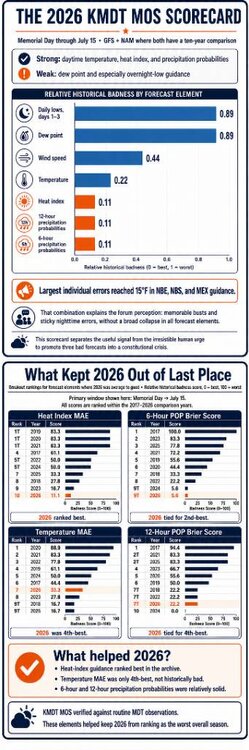
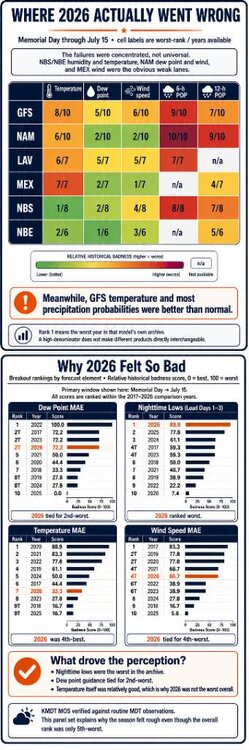
I tested the “worst forecast summer ever” claim by verifying KMDT MOS guidance against routine MDT observations and comparing the same partial-season dates in every usable year from 2017 through 2026. The broad claim does **not** hold up. Using equal within-model ranks for GFS and NAM temperature, dew point, and wind speed, 2026 ranks **5th-worst out of 10** for both Memorial Day–July 15 and June 1–July 15. In other words, this season lands in the middle of the pack overall, not at the bottom of the archive. That does **not** mean the complaints were imagined. Dew-point guidance was poor, overnight-low forecasts were the real train wreck, and several NBS, NBE, and MEX temperature busts reached **15°F**. NAM wind guidance also had some ugly stretches. Meanwhile, daytime temperature guidance, heat-index guidance, and precipitation probabilities were comparatively solid. So this was an **uneven** forecast season, not a universal collapse. Bottom line: **2026 was not the worst overall, but it absolutely had some loud, memorable failure modes**. I attached the infographic panels below Sent from my SM-S731U using Tapatalk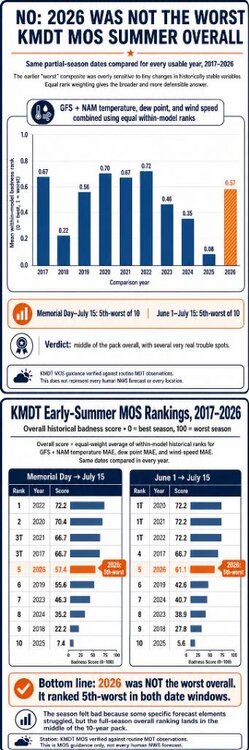
-
The format comes through fine for me.
- 1,460 replies
-
- 1
-

-
- severe
- thunderstorms
- (and 7 more)
-
Falls Lake is recovering nicely and has risen 2 feet since the low point.
-

2026-2027 Super El Nino
BlizzardWx replied to Stormchaserchuck1's topic in Weather Forecasting and Discussion
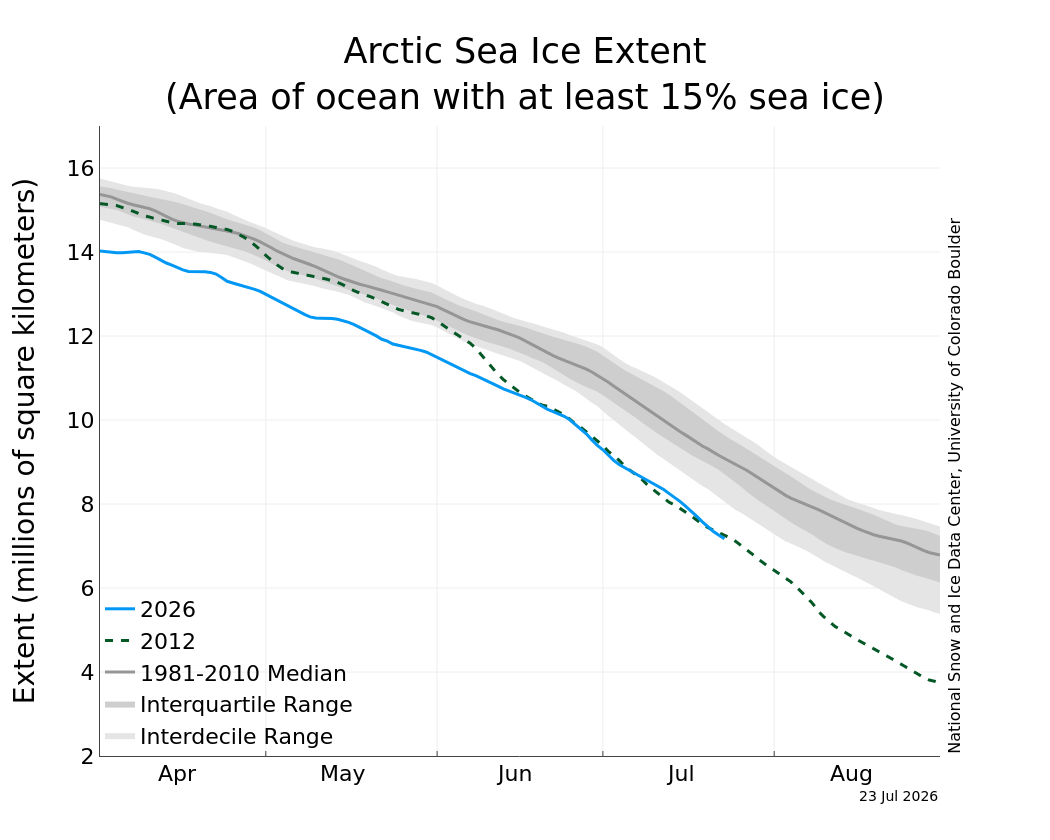
Somebody had made a comment on the cold 80+ N area the other day, but worth noting that sea ice continues to remain near record lows for the date.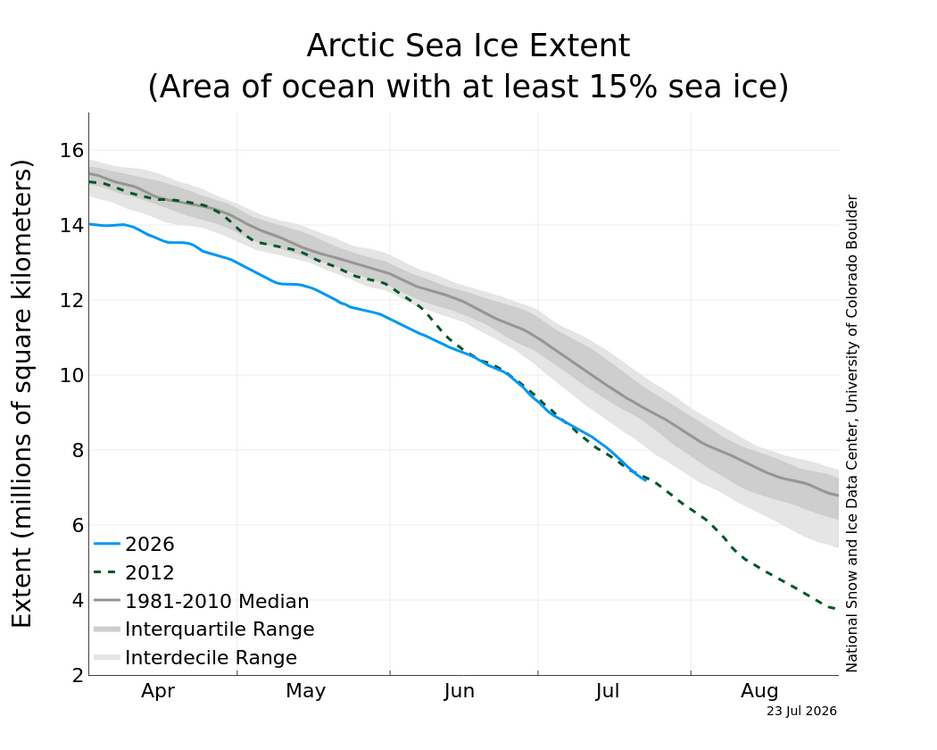
-
2026-2027 Super El Nino
BlizzardWx replied to Stormchaserchuck1's topic in Weather Forecasting and Discussion
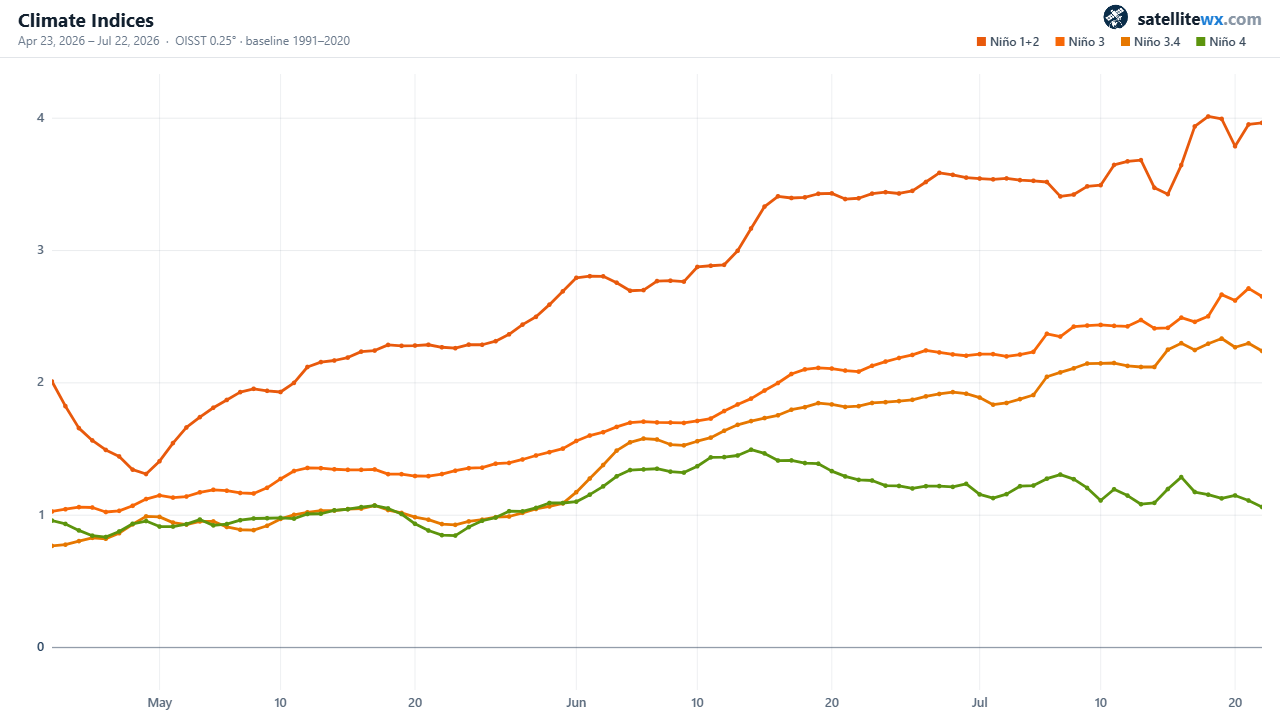
Recent trends of all the nino regions together. You can really see nino 4 leveling off while the others continue to build.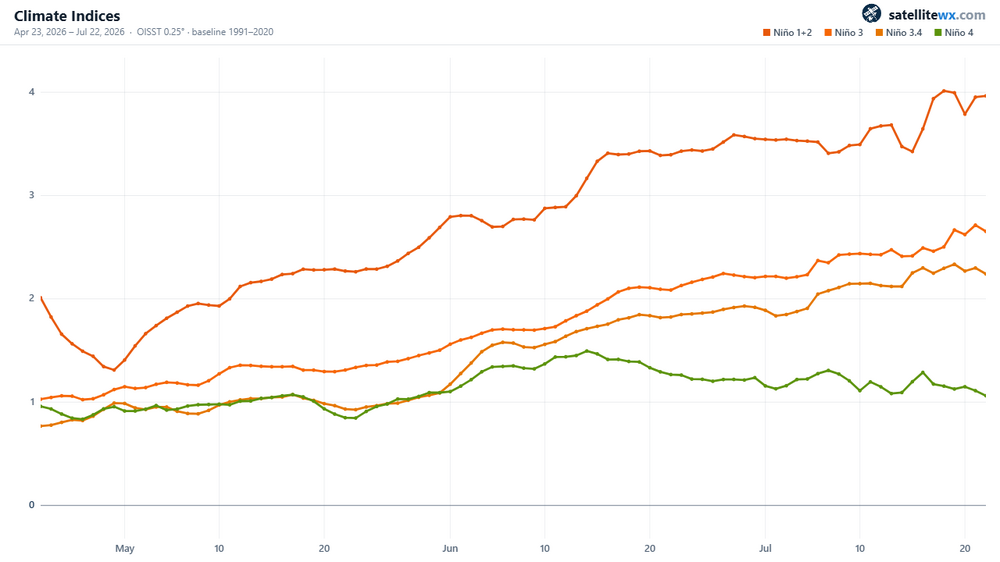
-

Central PA Summer 2026 Discussion/Obs Thread
canderson replied to Voyager's topic in Upstate New York/Pennsylvania
53 here for the low. More please. -
2026-2027 Super El Nino
BlizzardWx replied to Stormchaserchuck1's topic in Weather Forecasting and Discussion
In fact, I think that the odds of this changing into fall are pretty good. At some point the el nino pattern may just break in as tropics and midlatitude better connect with time. - Today
-
Central PA Summer 2026 Discussion/Obs Thread
ChescoWx replied to Voyager's topic in Upstate New York/Pennsylvania
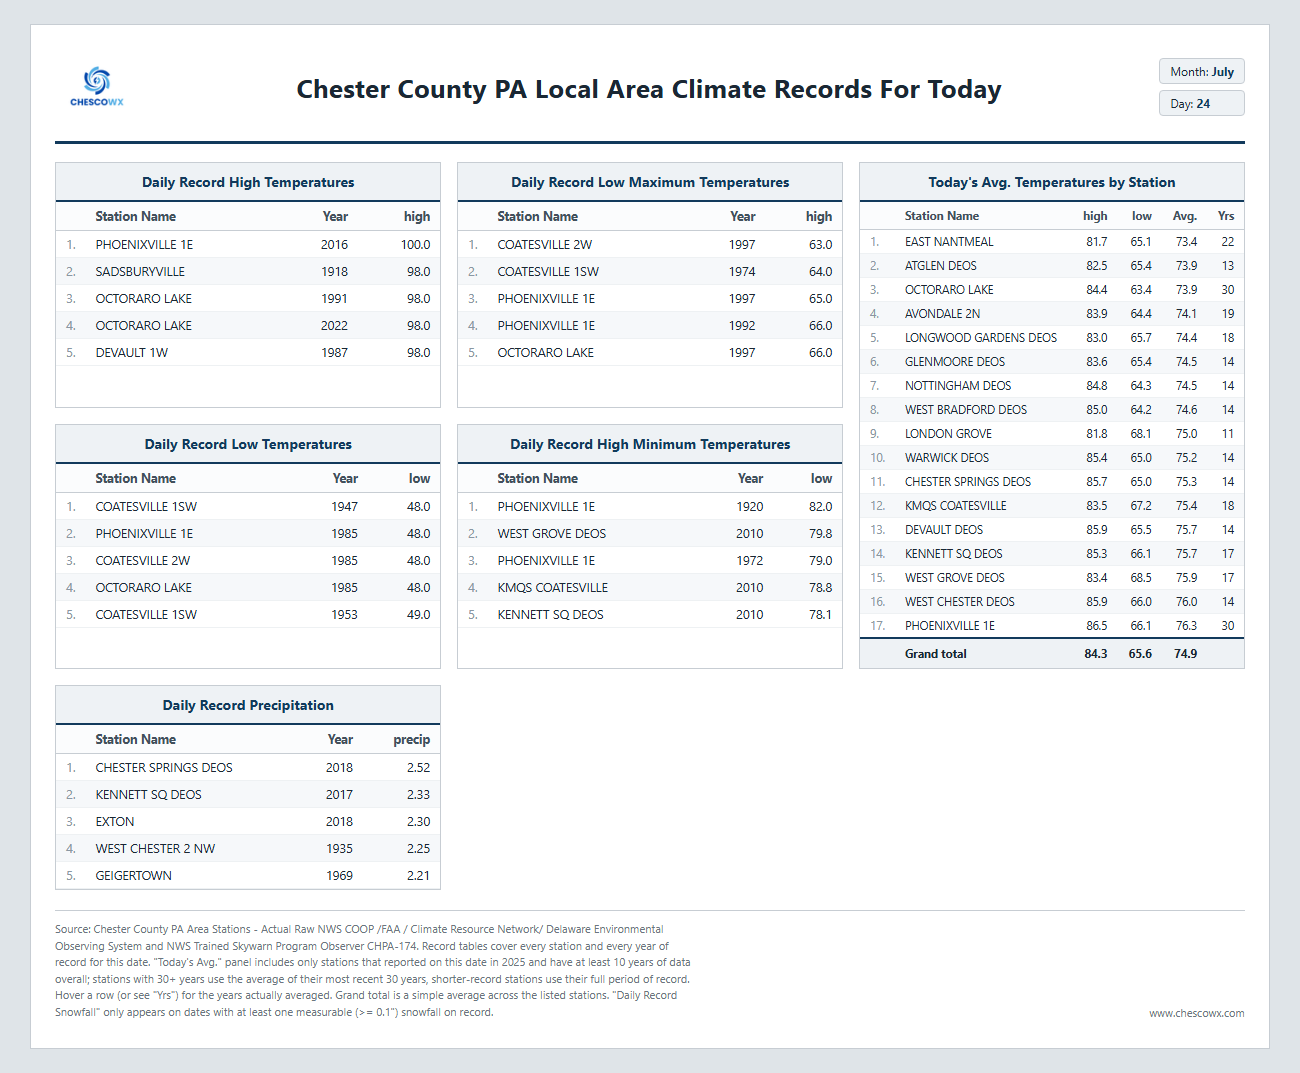
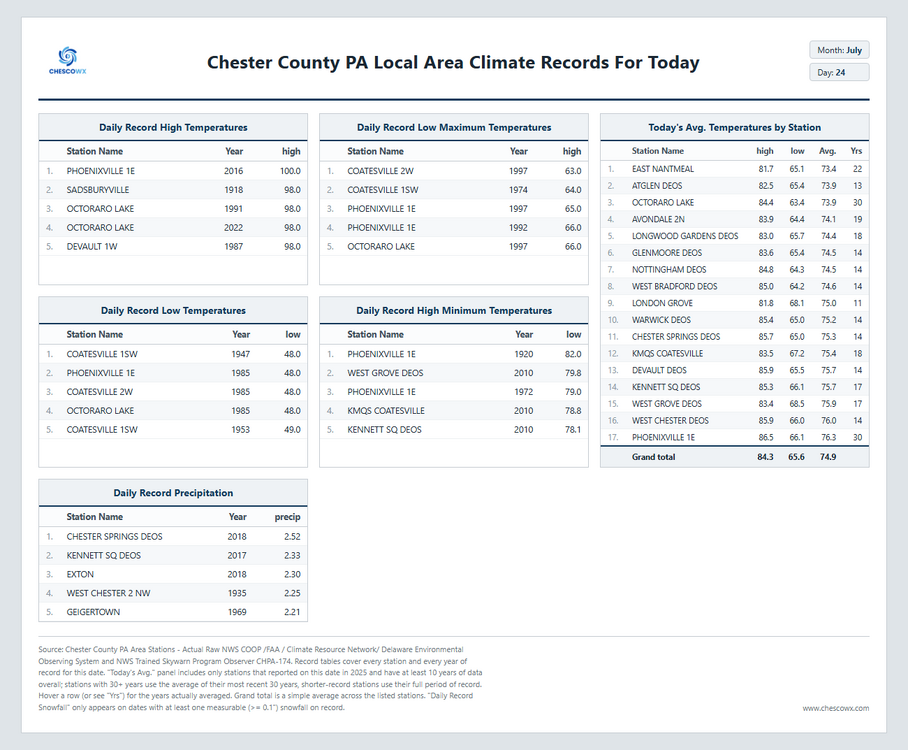
Another chilly start for much of the area again today with the Warwick DEOS as low as 48.6 degrees this AM. A great weather weekend on the way with highs from the upper 70's to low 80's and lows in the 50's to low 60's. Rain chances look to increase both Monday and Tuesday - there could be some heavy rain chances for the area.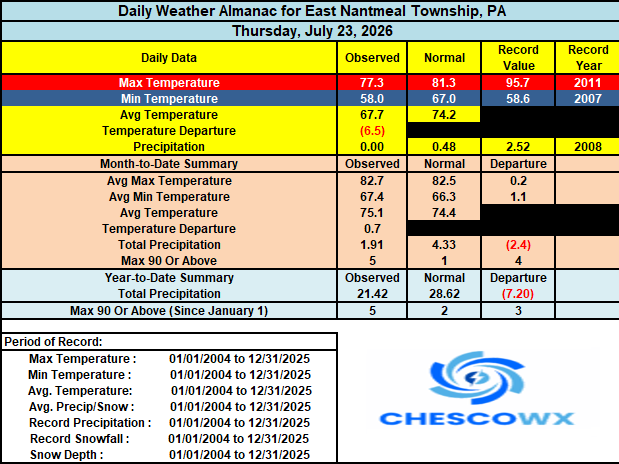
-
E PA/NJ/DE Summer 2026 Obs/Discussion
ChescoWx replied to PhiEaglesfan712's topic in Philadelphia Region
Another chilly start for much of the area again today with the Warwick DEOS as low as 48.6 degrees this AM. A great weather weekend on the way with highs from the upper 70's to low 80's and lows in the 50's to low 60's. Rain chances look to increase both Monday and Tuesday - there could be some heavy rain chances for the area.
-

E PA/NJ/DE Summer 2026 Obs/Discussion
Chadzachadam replied to PhiEaglesfan712's topic in Philadelphia Region
Yesterday was as nice a day as you could ask for in July, high was 80F and dew points stayed in the 50s. Feels a little warmer/stickier today but still nice. Low 60s in the mornings have been awesome -

2026-2027 Super El Nino
George001 replied to Stormchaserchuck1's topic in Weather Forecasting and Discussion
I get the whole wanting to get clicks and money thing (the east coast is a populated area with a bigger market)…. But for me as a skier I want a realistic forecast, not wishcasting or doom casting. That’s why I don’t pay attention to what they are saying on social media, I have a select few people I listen to on here and elsewhere and block out the noise when it comes to winter forecasts. I care about results and track record, so clickbaiters like JB don’t get my views. I know we don’t always see eye to eye, but I do think you are correct that the super Nino + -PDO = snowy narrative is a load of horseshit for several reasons: 1. 57-58 and 65-66 happened in an older, cooler climate. 57-58 in particular I looked at the temp profiles, and they were more borderline than cold east, it isn’t clear to me one way or another whether a repeat of that pattern would favor a snowy outcome in today’s climate. It’s not like 14-15 where a repeat of that would be cold + snowy east today. 2. Those years are cherry-picked. I haven’t heard one peep about 72-73 and 23-24, which were also -PDO super El Niños and horrific winters in the east. If you are going to be objective, you include all the -PDO strong or super El Niño years, not just the ones you like. Cherry-picking data to push a narrative is something I cannot stand, I see this bullshit all the time in sports too with young players and or prospects. What I and or others want to happen is irrelevant, the data is the data, and it is unscientific to cherry pick to fit a narrative. Also, weren’t those cherry picked years more strongly -NAO (I’m pretty sure 65-66 was)? From my understanding the part of the solar cycle we are in favors more of a neutral to positive NAO, not negative (this was brought up last year, and the NAO was indeed slightly positive this past winter. Actually the past few winters have been +NAO). Chucks NAO formula last I checked predicts an NAO close to neutral (Chuck, feel free to correct me if I’m wrong here). I know there are mixed signals, but the point is there isn’t really much support for the NAO to be as negative like it was during some of the snowier big Nino years. I would consider that to be a big issue when years like say 09-10 are brought up as well. -
And all they do is smoke bongs, saw logs , and copy cold summer tweets they find . When will they admit the obvious?