All Activity
- Past hour
-

2026-2027 Super El Nino
TriPol replied to Stormchaserchuck1's topic in Weather Forecasting and Discussion
Hopefully there will be a big one in October! -
I just got woken up by a loud lightning strike. I love that. It looks like another round headed my way. AA County looks like the winner this morning. Headed your way, CAPE.
- Today
-

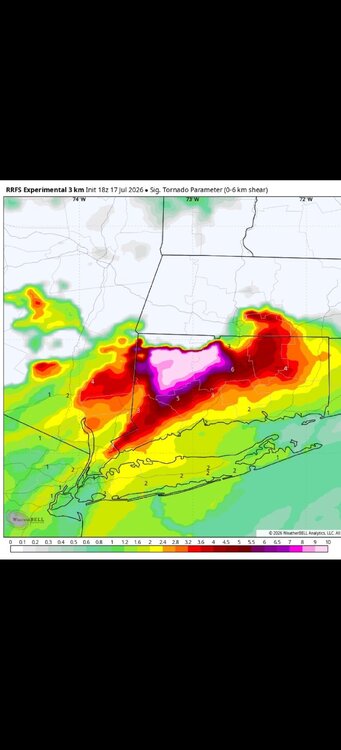
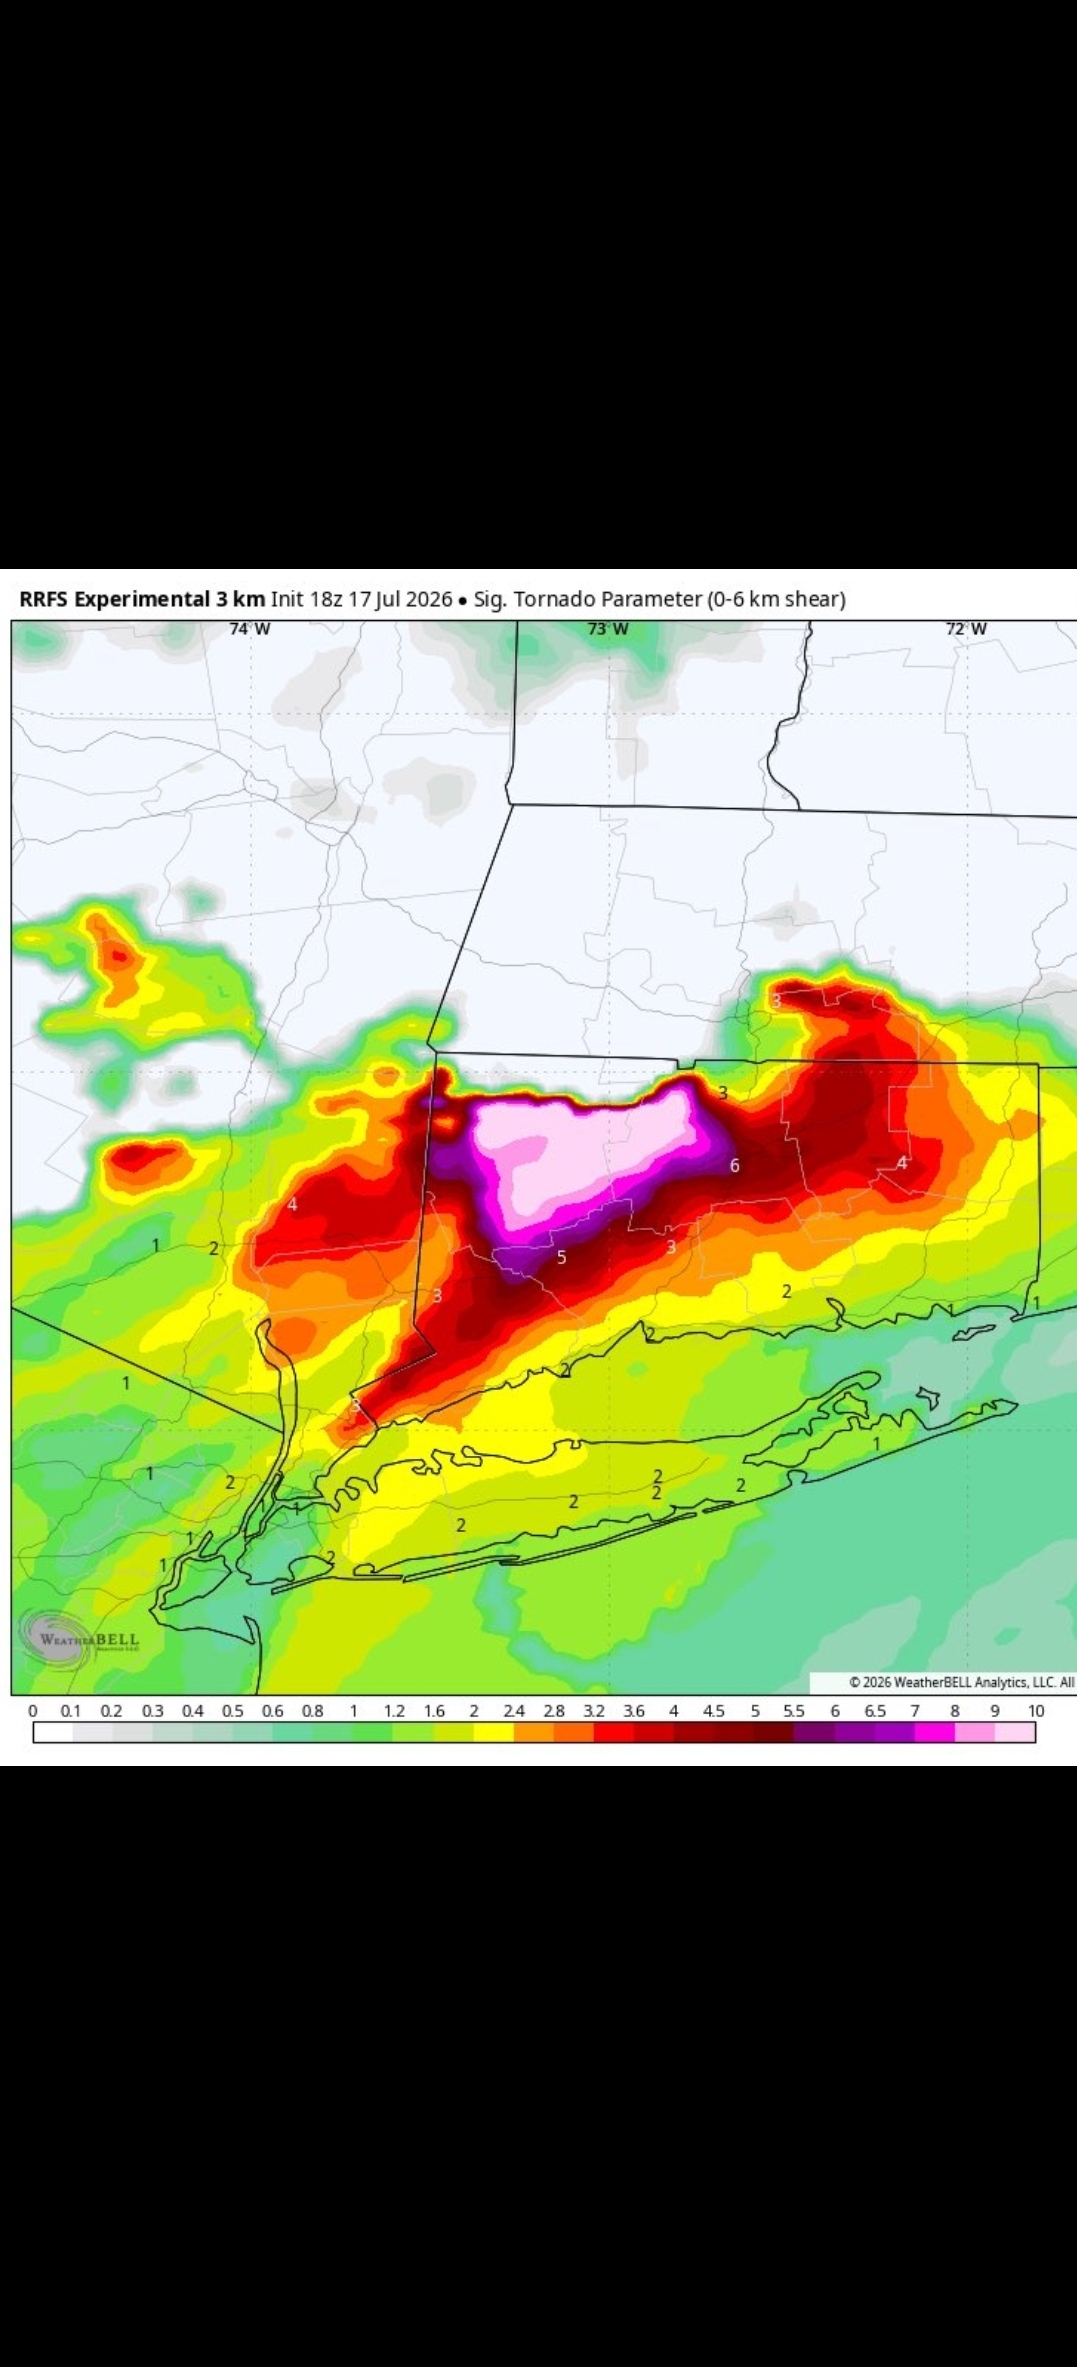
Saturday, July 18, 2026 Thunderstorm/Severe Weather Potential
WinterWolf replied to weatherwiz's topic in New England
We’ve been wet for sure…your area SW of here even a bit more…but all of us WOR have gotten our share. We’ll see what later today brings. -
Orioles only 2gb of the wild card?
-
1. The RRFS, which will replace NAM, has been developing this into a TS. 2. 0Z UKMET moves up TCG to 8PM Saturday and is stronger (winds almost to H strength Tue AM, which is high for the typically conservatively low UK) as it moves mainly slowly W to the NW GOM: NEW TROPICAL CYCLONE FORECAST TO DEVELOP AFTER 24 HOURS FORECAST POSITION AT T+ 24 : 27.1N 83.8W LEAD CENTRAL MAXIMUM WIND VERIFYING TIME TIME POSITION PRESSURE (MB) SPEED (KNOTS) -------------- ---- -------- ------------- ------------- 0000UTC 19.07.2026 24 27.1N 83.8W 1011 27 1200UTC 19.07.2026 36 27.6N 84.5W 1008 30 0000UTC 20.07.2026 48 28.0N 85.0W 1004 30 1200UTC 20.07.2026 60 27.9N 85.1W 1002 33 0000UTC 21.07.2026 72 28.0N 85.4W 999 37 1200UTC 21.07.2026 84 28.9N 85.5W 997 46 0000UTC 22.07.2026 96 29.1N 85.4W 993 56 1200UTC 22.07.2026 108 29.6N 85.4W 995 59 0000UTC 23.07.2026 120 29.2N 86.1W 996 53 1200UTC 23.07.2026 132 28.6N 87.2W 999 44 0000UTC 24.07.2026 144 28.0N 88.6W 998 41 1200UTC 24.07.2026 156 27.6N 89.9W 999 39 0000UTC 25.07.2026 168 29.0N 91.4W 1002 35
-
lol - the Nats are beating the A's 23-2 in the 9th.
-
2026 Mid-Atlantic Severe Storm General Discussion
AmericanWxFreak replied to Kmlwx's topic in Mid Atlantic
...Days 4-6/Mon-Wed -- Great Lakes/Midwest to the Mid-Atlantic/Northeast... A shortwave upper trough initially over the Canadian Prairies and northern Plains will develop east/southeast across the Upper Midwest/Great Lakes on Monday, then the Ohio Valley and Mid-Atlantic vicinity on Tuesday. Meanwhile, another upper shortwave trough will develop across the Great Lakes to the Northeast/Mid-Atlantic on Wednesday. These features will support enhancement of mid/upper level flow as a surface low tracks across Ontario/Quebec and New England during this time. A trailing cold front will likewise progress east/southeast over this three day period, with a very moist and unstable airmass present ahead of the front. This overall pattern will likely bring multiple days of severe storm potential from the Upper Midwest/Great Lakes to portions of the Ohio Valley, Northeast and Mid-Atlantic vicinity Monday through Wednesday, necessitating severe probabilities. While these areas may shift some over the coming day as the timing of mesoscale features and influence of prior days convection becomes more clear, these general regions are most likely to see at least isolated to widely scattered damaging wind potential as the upper trough and surface cold front sweep across the area. -
The timing on tonight's HRRR and NAM3km is around 2 to 4 in the afternoon, and they really hammer us with a big line of strong storms. I'm looking forward to big storms with heavy rain, but hopefully it won't be so severe that there's a lot of damage. Obviously the potential for that is there though.
-
Interesting how dry it is off the SE coast and Gulf. Tropics look shutdown for the time being.
-
Just saw my first back-to-school commercial from Kohl’s. Better get your Halloween candy before the shelves are empty.
-
 I recently discovered [url=https://mexicanrxnews.top/#]MexiMedsExpress[/url] and I can confirm they offer excellent prices for uninsured buyers.
 -
I recently discovered [url=https://mexicanrxnews.top/#]MexiMedsExpress[/url] and I can confirm they offer excellent prices for uninsured buyers.
-
I recently discovered [url=https://mexicanrxnews.top/#]MexiMedsExpress[/url] and I can confirm they offer excellent prices for uninsured buyers.
-

2026-2027 Super El Nino
raindancewx replied to Stormchaserchuck1's topic in Weather Forecasting and Discussion
These are your y/y changes in 27.0C DJFs in Nino 3.4 winters. I've also found this to be essentially four real patterns: Cold South/Warm North, Cold SW/NE, Cool East/Warm West, Cold East/Mild West. El Nino Y/Y Change Nino 3.4 1951 +1.3 1953 +0.4 1957 +2.0 1958 -1.2 1963 +1.5 1965 +2.0 1968 +1.7 1969 -0.6 1972 +2.5 1976 +2.3 1977 +0.0 1982 +2.2 1986 +1.7 1987 -0.4 1991 +1.3 1994 +0.9 1997 +2.7 2002 +1.0 2004 +0.2 2006 +1.6 2009 +2.3 2014 +1.0 2015 +1.9 2018 +1.7 2019: -0.3 2023 +2.4 2026 +3.1? Look at the signals - +2.0C gain or more: 1957, 1965, 1972, 1976, 1982, 1997, 2009, 2023 +1.0C to +1.99C gain: 1951, 1963, 1968, 1986, 1991, 2002, 2006, 2014, 2015, 2018 +0.0C to +0.99C gain: 1953, 1977, 1994, 2002, 2004, 2014 <0.0C gain: 1958, 1969, 1977, 1987, 2019 Big Gain El Ninos (2.0C or greater warmer y/y in Dec-Feb). Coldest Southeast US. Average Gain El Ninos (1-2C warmer y/y Dec-Feb). Coldest SW & NE US. Small Gain El Ninos (0-1C warmer y/y Dec-Feb). +PDO driven / cold East & warm West. Small Loss El Ninos (0-1C colder y/y Dec-Feb than prior El Nino, but still El Nino). All pretty severe Eastern winters, except 2019-20. -
NGL for a minute I thought it was your backyard in Stephens City before looking closer.
-
same - just walked to meet a few friends for a drink, i didn't really smell anything. still VERY hazy though.
-
2026-2027 Super El Nino
raindancewx replied to Stormchaserchuck1's topic in Weather Forecasting and Discussion
My local indicators based on Summer don't support full-on idealized El Nino conditions locally. I have two approaches for that: Low Solar + ENSO Prior + ENSO Current. So ideal is a) solar minimum plus b) big La Nina in prior winter c) big El Nino in current winter. Factors B/C are relational - cold winters here are directly correlated to the biggest warm-ups y/y in Nino 3.4. 2023-2024 was a notable failure - although that's likely due to both high solar and the strong -PDO offsetting a strong y/y warm up to some extent (Nino 3.4 warmed +2.4C from 2022-23 to 2023-24 in Nino 3.4, v. +1.7C from 2017-18 to 2018-19, but 2018-19 had low solar, and a neutral PDO. So with solar/PDO more favorable 2018-19 was much colder than 2023-24 even though 2023-24 was stronger.) 2018-19 netted out to about 2.2F colder than the 1991-2020 average high, while 2023-24 was 1.1 warmer than that 1991-2020 average high. For 2026-27, you have potentially: +3.5C in Nino 3.4 (biggest gain on record, call it -0.4C to +3.1C in DJF y/y) High Solar (75-100 sunspots for July 2026-June 2027) So I'd expect temps colder than 2023-24 locally as both the SST gain and solar conditions are better, especially with the -PDO looking weaker. The biggest misses on this image are also tied to volcano influenced El Ninos (1963-64 Agung is the big cold miss, 1994-95 is the big warm miss (54F) and then 2023-24 (Tonga?). Low solar is more directly correlated to lower lows and less rain/snow here, but it tends to indirectly make highs colder too (El Ninos starting 1963, 1965, 1976, 1986, 1997, 2006, 2009, 2018 are all low solar and very cold here). My other indicator is Summer conditions. Snowy winters tend to follow Summers that are cold in June-Sept, El Nino, with a wet Monsoon, and three years or more since above average snow. Right now, we're on track for: Hot June (-) / Hot July (-) / Mild/Hot Aug (= or -) /Mild/Hot Sep (= or -) Dry Monsoon (-) /El Nino (+) / ENSO + Monsoon (=) / Duration since big Winter (+) The monsoon could still flip. But I doubt we get a cold Aug AND Sept. Best case: There was a signal in the data locally, hottest Marches on record tend to precede cold August unusually often. Same for extreme -WPO/+NAO Marches. That would need to coincide with a wet month. So - Good (El Nino, Wet Monsoon, ENSO + Monsoon, Aug Cold, Duration since big winter) Neutral (Hot Sept) Bad (Hot Jun, Hot July) Nets Out to ~10 inches of snow based on my historical testing, and that'd be accurate within 4 inches of snow in 70%+ of all cases. I need to dig out some of my older research. I have it on a blue thumb drive somewhere. -
 Model is trash
 -
Oh crazy, if got smoky but they predicted it.
-
Massive win.
-

2026-2027 Super El Nino
Stormchaserchuck1 replied to Stormchaserchuck1's topic in Weather Forecasting and Discussion
You can really see it in the SOI over the last 30 years. We are breaking it hard now however, but if the N. Pacific Hadley Cell was +SOI driven it should be reversing around now and that has not happened yet but it is mid-warm season Streak of the last 30 years really makes the current -26 30-day that much more impressive. I think I calculated something like 72% of months were +SOI since 1998. -

2026-2027 Super El Nino
MarcmmKU replied to Stormchaserchuck1's topic in Weather Forecasting and Discussion
The wet paste low ratio dense snow is the prettiest looking. It clings to everything and whitens everything up better. -
Yeah smell is much reduced. Could see 1 star in the sky
-
2026-2027 Super El Nino
LakePaste25 replied to Stormchaserchuck1's topic in Weather Forecasting and Discussion
The lack of H5 over the central equatorial pacific does indicate a skew towards La Niña the last 20-30 years, which could also be contributing. I don’t have the research handy, but climate models argue that more frequent La Niña will not be the case long term. Possibly a temporarily aberration the past couple of decades. We are probably due for a major decadal regression the other way. Not necessarily right now, but it could happen eventually. -
 Damage in Tolland? I'll post it in DIT format.