All Activity
- Past hour
-
July totals for RAH, feast or famine. Hoping for an area-wide soaking from Bertha's left behind moisture GSO .83 Raleigh 5.25 Chapel hill 3.15 Fayetteville 1.05 Asheboro .64 Rocky mount 1.4 Goldsboro .83 Wilson 3.63
-
A lot of sw to ne flow, which I’ve noticed, tends to work out poorly for me. The South Mts either block things or the cells anchor in that region. I wonder if you’re getting the ol Mt Mitchell block.
-
Second day in a row I’ve had a heavy shower blow up right overhead before it even showed on radar
-
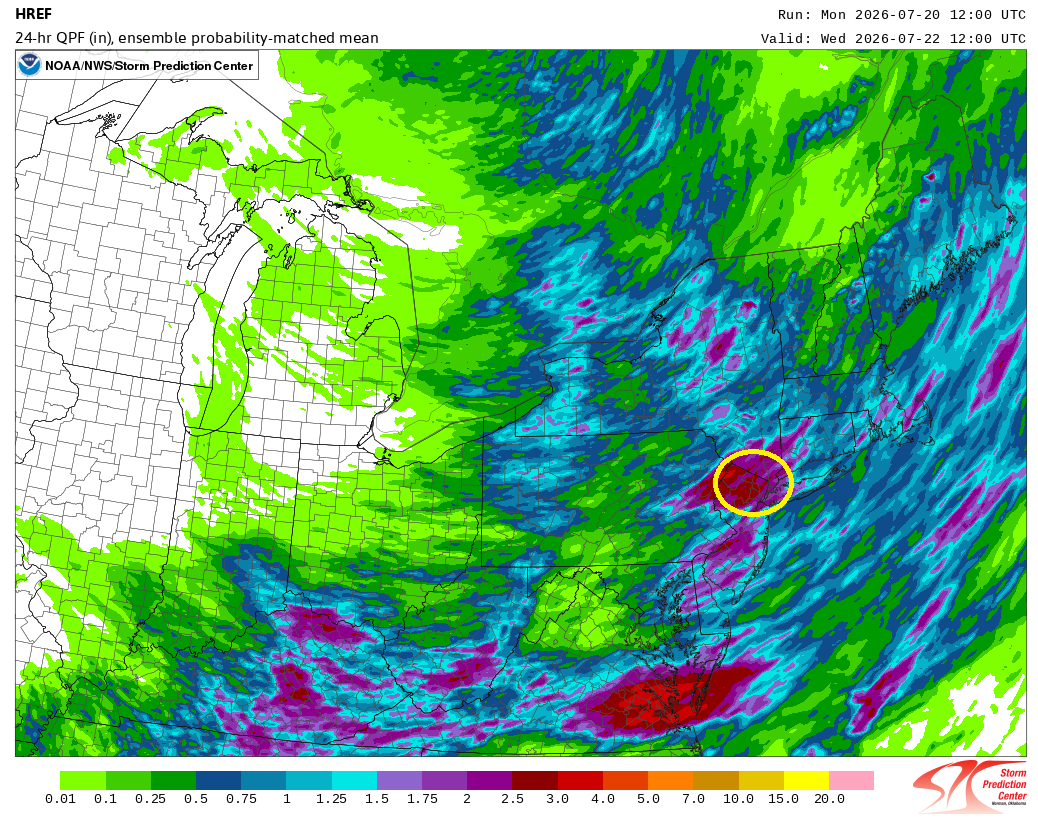
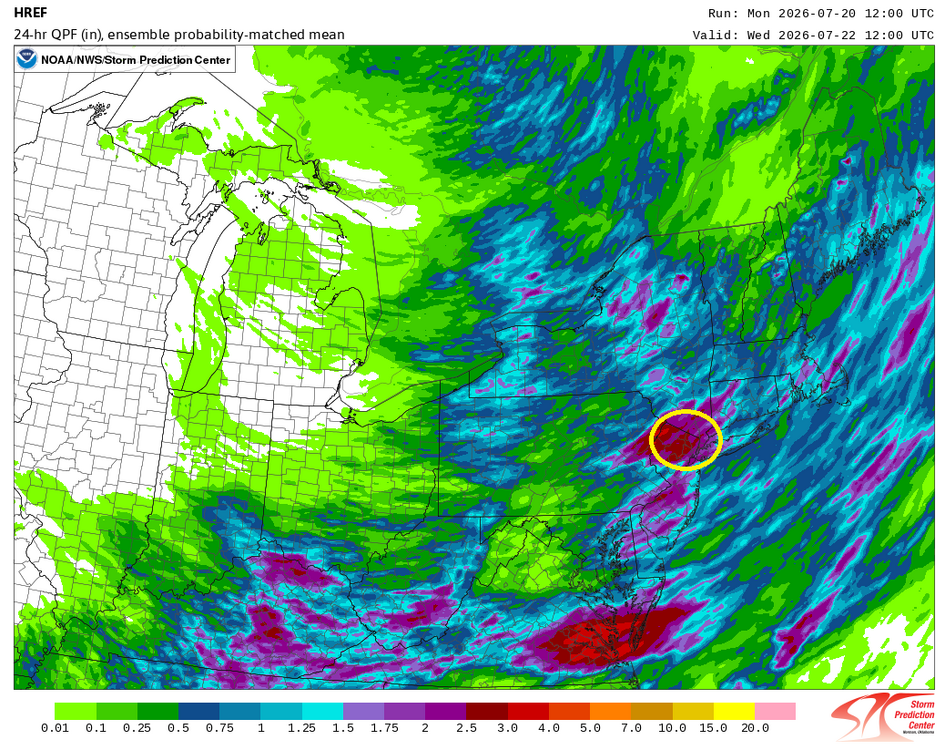
The latest HREF is showing the potential for 1.50"-3.00" of rain across the New York City Metro Area. If this holds through the 0z cycle, it wouldn't surprise me if flood watches are put in place for Tuesday into Wednesday.
-
81 / 48 just a superb out day
-
Bottomed out at 59.7 here. Up to 78 now, beautiful day
-
 So what does ACATT mean to this social media depot ?
 -
So we did Trap pond. Saw that we could do a tour through the Bald Head Cypresses. Mr. J is quite fair skinned and it worked good for shaded waterways. But also seeing the Cypress up here was lovely! Even saw a beaver up close.

-
(002).thumb.png.6e3d9d46bca5fe41aab7a74871dd8af8.png) Of course @chubbsWidening the interval to 1941 - 1975 does not change the previous answer. Both series show a real, statistically significant cooling trend on their own — this isn't noise, and it fits the well-documented mid-century cooling that shows up across the eastern US from the 1940s into the 1970s. Are the two trends statistically the same? This is the more interesting question, and the answer depends on the test: Naive comparison (treating the two trends as independent): the difference in slopes (−0.66 vs. −0.46 °F/decade) gives t = −0.92, p ≈ 0.36 — not remotely significant. By this test they're indistinguishable. Paired comparison (the right test here, since both series describe the same regional weather in the same years — they're correlated at r = 0.83, so a paired test on the year-by-year difference is more powerful): the difference series trends at −0.021 °F/yr (−0.21 °F/decade), 95% CI [−0.042, +0.001], p = 0.057. So the more rigorous test lands just on the wrong side of the conventional 0.05 cutoff — the station data cooled somewhat faster than the division average, and that gap is close to, but doesn't quite clear, statistical significance. The honest read: the two trends are not clearly, statistically different so no need to cool the raw data further as they are already a strong match.
Of course @chubbsWidening the interval to 1941 - 1975 does not change the previous answer. Both series show a real, statistically significant cooling trend on their own — this isn't noise, and it fits the well-documented mid-century cooling that shows up across the eastern US from the 1940s into the 1970s. Are the two trends statistically the same? This is the more interesting question, and the answer depends on the test: Naive comparison (treating the two trends as independent): the difference in slopes (−0.66 vs. −0.46 °F/decade) gives t = −0.92, p ≈ 0.36 — not remotely significant. By this test they're indistinguishable. Paired comparison (the right test here, since both series describe the same regional weather in the same years — they're correlated at r = 0.83, so a paired test on the year-by-year difference is more powerful): the difference series trends at −0.021 °F/yr (−0.21 °F/decade), 95% CI [−0.042, +0.001], p = 0.057. So the more rigorous test lands just on the wrong side of the conventional 0.05 cutoff — the station data cooled somewhat faster than the division average, and that gap is close to, but doesn't quite clear, statistical significance. The honest read: the two trends are not clearly, statistically different so no need to cool the raw data further as they are already a strong match. -
hrrr tries to re-fire locally but it's an ez sell imo
-
Nailed it. Getting wussy anvil rain here per usual.
-
We had a severe warning this morning. The wind was gusty, but it did not reach severe level.
-
Exact same here. Storms have missed to every direction the past 4 days and we have less than .2. Luckily we got hit good last week.
-
.thumb.gif.f92b16c631a1d15d405ed77b33f0710d.gif) Tomorrow looked like crap for convection, Wednesday was the lone longshot hope
Tomorrow looked like crap for convection, Wednesday was the lone longshot hope -
This morning's storms were more robust than models predicted. I received gusty wind and a much-needed 1.10" of rain from a solid red line that swept through the area. I don't know if this line will ruin tonight's potential.
-
Well said, it’s a gorgeous beach day. .
-
 Did @radarmanmove to Texas ?
 -
Top ten afternoon. So glad to have a day without eye stinging campfire, monsoon or 95+.
-
 You should hear our chairlift chats, ha. Guy is a ton of fun to be around on the mountain, but we do get into it on some of that stuff. A lot of it is just not wanting to “the good ol’ days” to be done… but we get that vibe on here sometimes. That by admitting it’s warming means you think it’ll never get cold or snowy again. It’s a “holding out hope” type vibe I get.
 -
Brutal gradient in Orange and Durham counties. Verbatim would be great for MBY. We shall see.
-
Kinda like last year but we got rain this year so far. Which is lucky.
-
12Z UKMET is slightly stronger than 0Z with it showing 35 knots/barely TS this time before it dissipates by hour 60 moving W into LA, a similar track to 0Z/6Z runs. It then comes out S of LA but in a weakened state below TD status as it heads into the Galveston vicinity: TROPICAL DEPRESSION 02L ANALYSED POSITION : 28.4N 85.5W ATCF IDENTIFIER : AL022026 LEAD CENTRAL MAXIMUM WIND VERIFYING TIME TIME POSITION PRESSURE (MB) SPEED (KNOTS) -------------- ---- -------- ------------- ------------- 1200UTC 20.07.2026 0 28.4N 85.5W 1008 23 0000UTC 21.07.2026 12 28.8N 85.9W 1006 25 1200UTC 21.07.2026 24 28.7N 86.3W 1005 35 0000UTC 22.07.2026 36 29.4N 86.9W 1004 33 1200UTC 22.07.2026 48 30.1N 87.6W 1006 29 0000UTC 23.07.2026 60 CEASED TRACKING
-
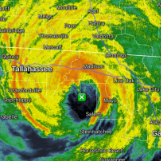
Good to see recon out there for an extended period. The center is kind of meandering out there. You have to wonder if we see additional center reformations near the deeper convection with that northeasterly shear proving to be so strong.
-
 Another decent looking setup when you look at dynamics, however, doesn't look like there is going to be any room for cloud breaks tomorrow. Quite the soupy airmass, warm front nearby, and no capping. Going to be lots of clouds and pop up showers. Timing of the front/forcing not idea either...but...there may be a shot for some strong storms on Wednesday, especially east of the River.