All Activity
- Past hour
-
Quit griping.
-
Nice!
-
I love it when the hawks return! They are awesome birds. (also on team #deathtorodents)
-

It's time to grade Winter 2025-26(now that it's actually over)
Wintrest replied to CAPE's topic in Mid Atlantic
Solid B on the winter precip front. Depending on scale we’re talking 86/87 out of 100. Temps were simply phenomenal, and that started early on. If the dynamics of the late Jan storm were just a bit different, this winter would have earned a solid A in my book. In terms of winter weather as a whole, at least in northern VA, I say A-. -
Saw a hawk swoop in and grab a squirrel in my backyard last week-poor thing never had a chance.
- Today
-
Probably best to get your hands on some chlordane and kill every living fauna on the hill.
-
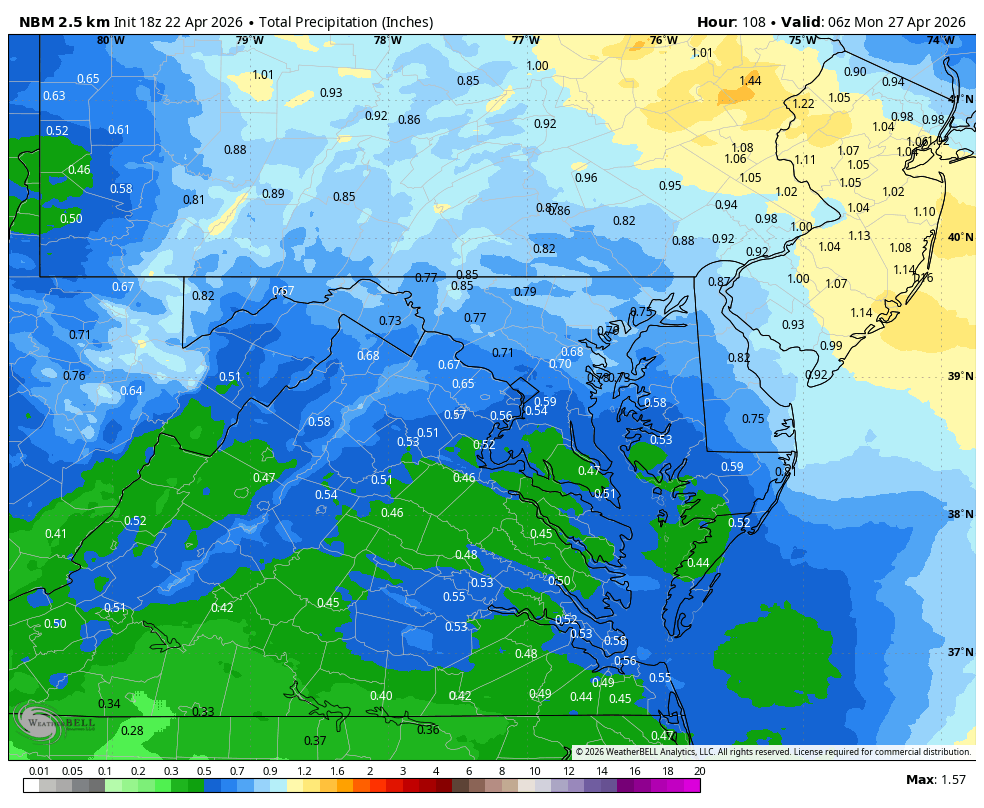
WB 18Z NBM for weekend.

-
So....It's the same as it was ALL winter until it finally snowed (for most) in February. It's always 10 days to 2 weeks out. ALWAYS. we will get rain (decent rain...I don't mean sprinkles)maybe by the middle of May. It's literally a dream to think it's going to happen before then. Keep posting the pretty colored maps, I'll keep saying show me the colors 48 hours out.
-
Enough of the raw weather. Hopefully we move into daytime minimums above 50, and no more sub freezing nights
- 788 replies
-
- 1
-

-
- april showers bring may..
- rain
- (and 2 more)
-
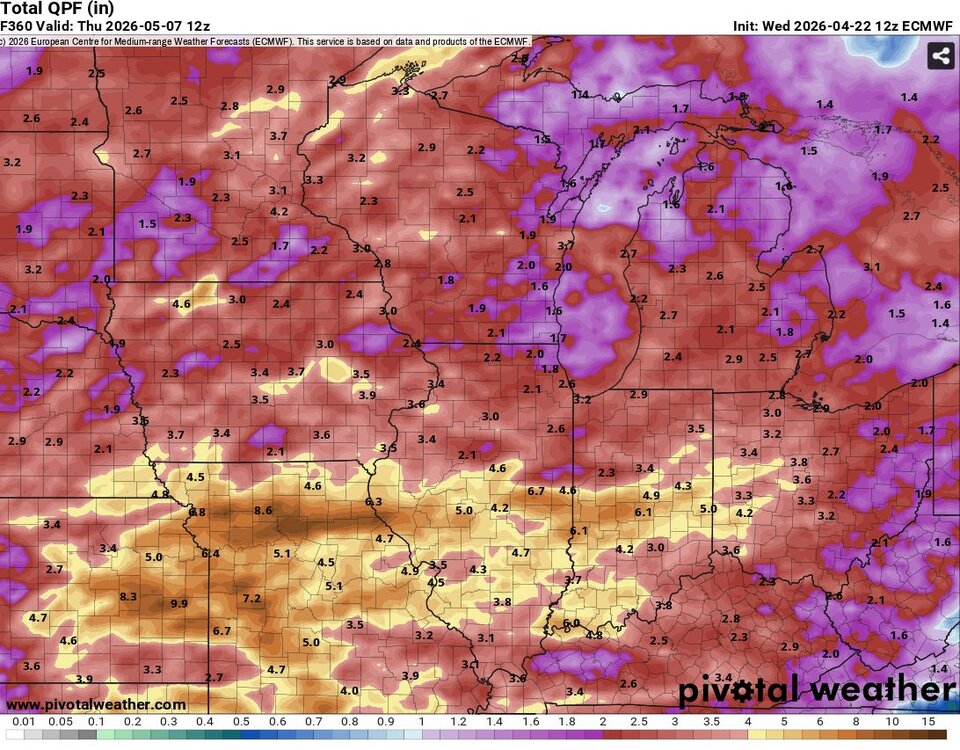
I keep seeing that pesky NW flow showing up again in early May. There will be little to no rain east of the Apps with that.
-
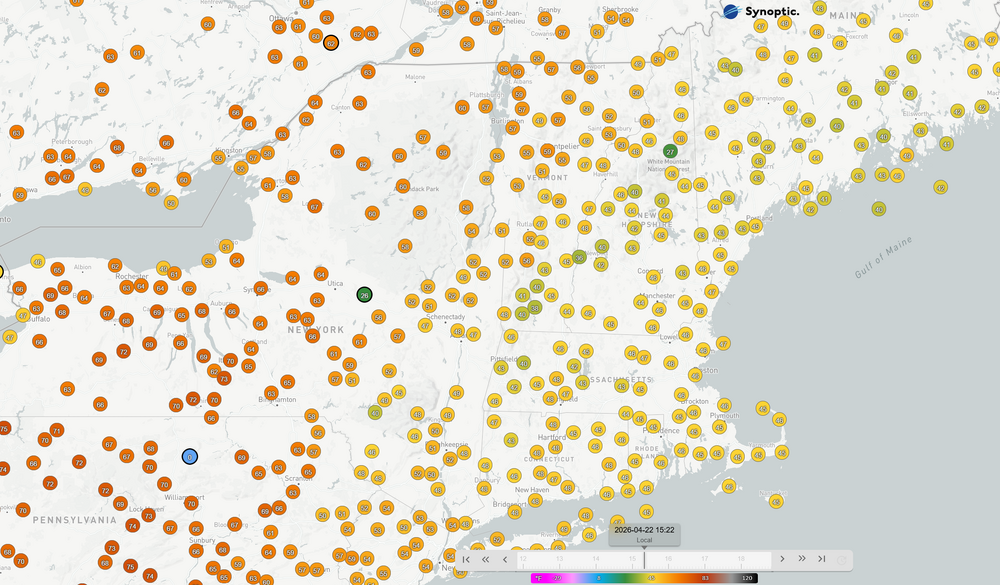
beautiful day despite lake cooling
-
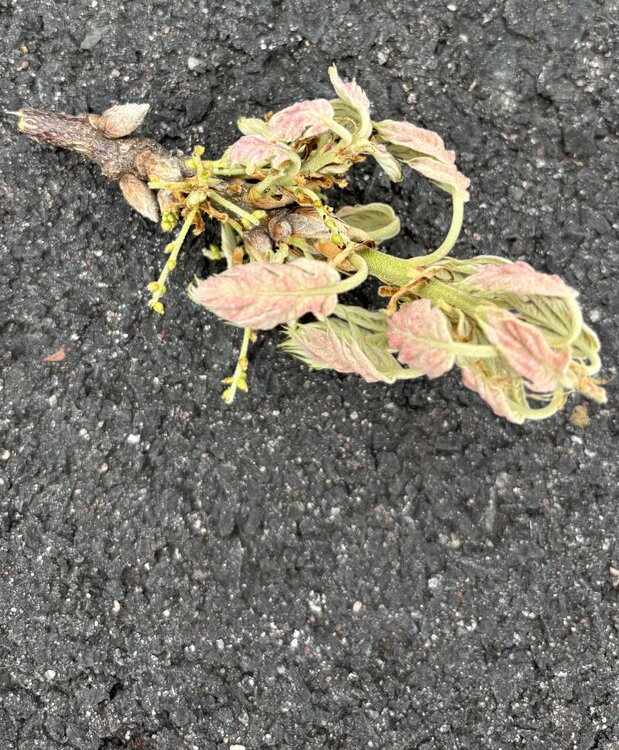
The squirrels are chewing these little branches with tiny Oak leaves all over . Making a mess . Just the worst animal alive in terms of lawn destruction
-

Occasional Thoughts on Climate Change
TheClimateChanger replied to donsutherland1's topic in Climate Change
One angle I don’t see discussed much is how “feels like” temperatures are changing relative to actual air temperature. We usually focus on raw temperature trends, but that’s not necessarily what people experience. In winter, wind chill matters; in summer, humidity does. So I pulled PIT data back to 1960 and looked at mean “feels like” temperatures (wind chill in winter, heat index in summer) alongside the air temperature trends. A couple of interesting contrasts: January: Mean “feels like” temperature is increasing at ~10–11°F per century, versus about ~6–7°F per century for air temperature. So winters aren’t just warming — they’re becoming less harsh even faster than the thermometer suggests. July: The heat index trend is also higher than the air temperature trend (by roughly ~1°F/century on average). But that actually understates the real effect. Nighttime heat indices are typically equal to the air temperature (they’re not additive until you get into ~80°F+ conditions), so averaging over the full day mutes the signal. That implies that daytime heat indices are likely increasing on the order of ~2–3°F/century in addition to the air temperature trend. -
Seems like everyone here has been to Switzerland lol. Super easy - almost everyone speaks some English. Echo the travel pass recommendations. Interlaken and Grindelwald are like my favorite places ever so have fun in that area!
-

E PA/NJ/DE Spring 2026 Obs/Discussion
Birds~69 replied to PhiEaglesfan712's topic in Philadelphia Region
I don't care but let's hope it last. Weekend still looks great so all systems go as far as I'm concerned... 58F/Sun breaking out little by little -
Occasional Thoughts on Climate Change
TheClimateChanger replied to donsutherland1's topic in Climate Change
Here are the trends since 1960 by month, sorted May to April. Month Trend (°F/decade) Trend (°F/century) May +0.60 +6.0 Jun +0.47 +4.7 Jul +0.56 +5.6 Aug +0.45 +4.5 Sep +0.54 +5.4 Oct +0.42 +4.2 Nov +0.22 +2.2 Dec +0.92 +9.2 Jan +0.68 +6.8 Feb +0.94 +9.4 Mar +0.60 +6.0 Apr +0.74 +7.4 -
Exactly. Everything needs to be 200-400 Miles further East. That would be a Drought denter.
-
Trying real hard to not kick heat on. Go pellet stove go
-
At least those mid-60's are coming for us tomorrow, but yeah, today is in the shitter.
-

2026-2027 El Nino
snowman19 replied to Stormchaserchuck1's topic in Weather Forecasting and Discussion
-
Less than 2 inches of rain in 16 days in late April/Early May is closer to average than being wet.
-
2026-2027 El Nino
snowman19 replied to Stormchaserchuck1's topic in Weather Forecasting and Discussion
+6C subsurface anomalies showing up now -
Occasional Thoughts on Climate Change
TheClimateChanger replied to donsutherland1's topic in Climate Change
I was looking at some data for Pittsburgh and, with GPT’s help, calculated the annual and monthly trends for periods starting in 1960, 1970, 1980, 1990, and 2000 (all using May–April data). For the first four start dates, warming is pretty insensitive to the choice of starting point — it comes out to roughly ~6°F per century in each case. However, starting in 2000, the trend is nearly double that rate (see table of trends below). Start Year Period Trend (°F/decade) Trend (°F/century) 1960 1960–2026 +0.59 +5.9 1970 1970–2026 +0.60 +6.0 1980 1980–2026 +0.62 +6.2 1990 1990–2026 +0.58 +5.8 2000 2000–2026 +1.14 +11.4 The obvious caveat is the shorter time window. I intentionally didn’t go any shorter than 2000 because it quickly becomes too noisy to draw meaningful conclusions. With that in mind, I wanted to get a sense of what the climate might look like 50 years from now. The table/graphic shows a range: Low end: continuation of the long-term trend (1960–present) High end: continuation of the more accelerated warming seen since 2000 This shouldn’t be interpreted as a true “high-end forecast.” If anything, one could argue warming may continue to accelerate as CO₂ increases and feedbacks come into play. This is simply a trend-based extrapolation, not a model projection. A couple interesting takeaways: Winter shows the largest absolute changes Summer warms less in °F, but still shifts meaningfully given its low variability November consistently stands out as a relative laggard Curious what others think, especially regarding the seasonal differences and whether similar patterns show up in nearby regions. A couple quick notes on the table: “Recent” refers to the most recent 7 years (May 2019 through April 2026), so it should be thought of as a snapshot of the current climate rather than a formal 30-year normal. The 2070s range is not a forecast — it’s simply an extrapolation of observed trends: Low end = continuation of the long-term (~1960–present) trend High end = continuation of the more accelerated warming seen since ~2000 Importantly, this should not be interpreted as a true upper bound. If anything, actual warming could end up higher than shown here if the recent acceleration continues or increases due to rising CO₂ and amplifying feedbacks. This is just a simple trend-based framework to give a sense of scale. -
relief for the downstate screw zone incoming?
-
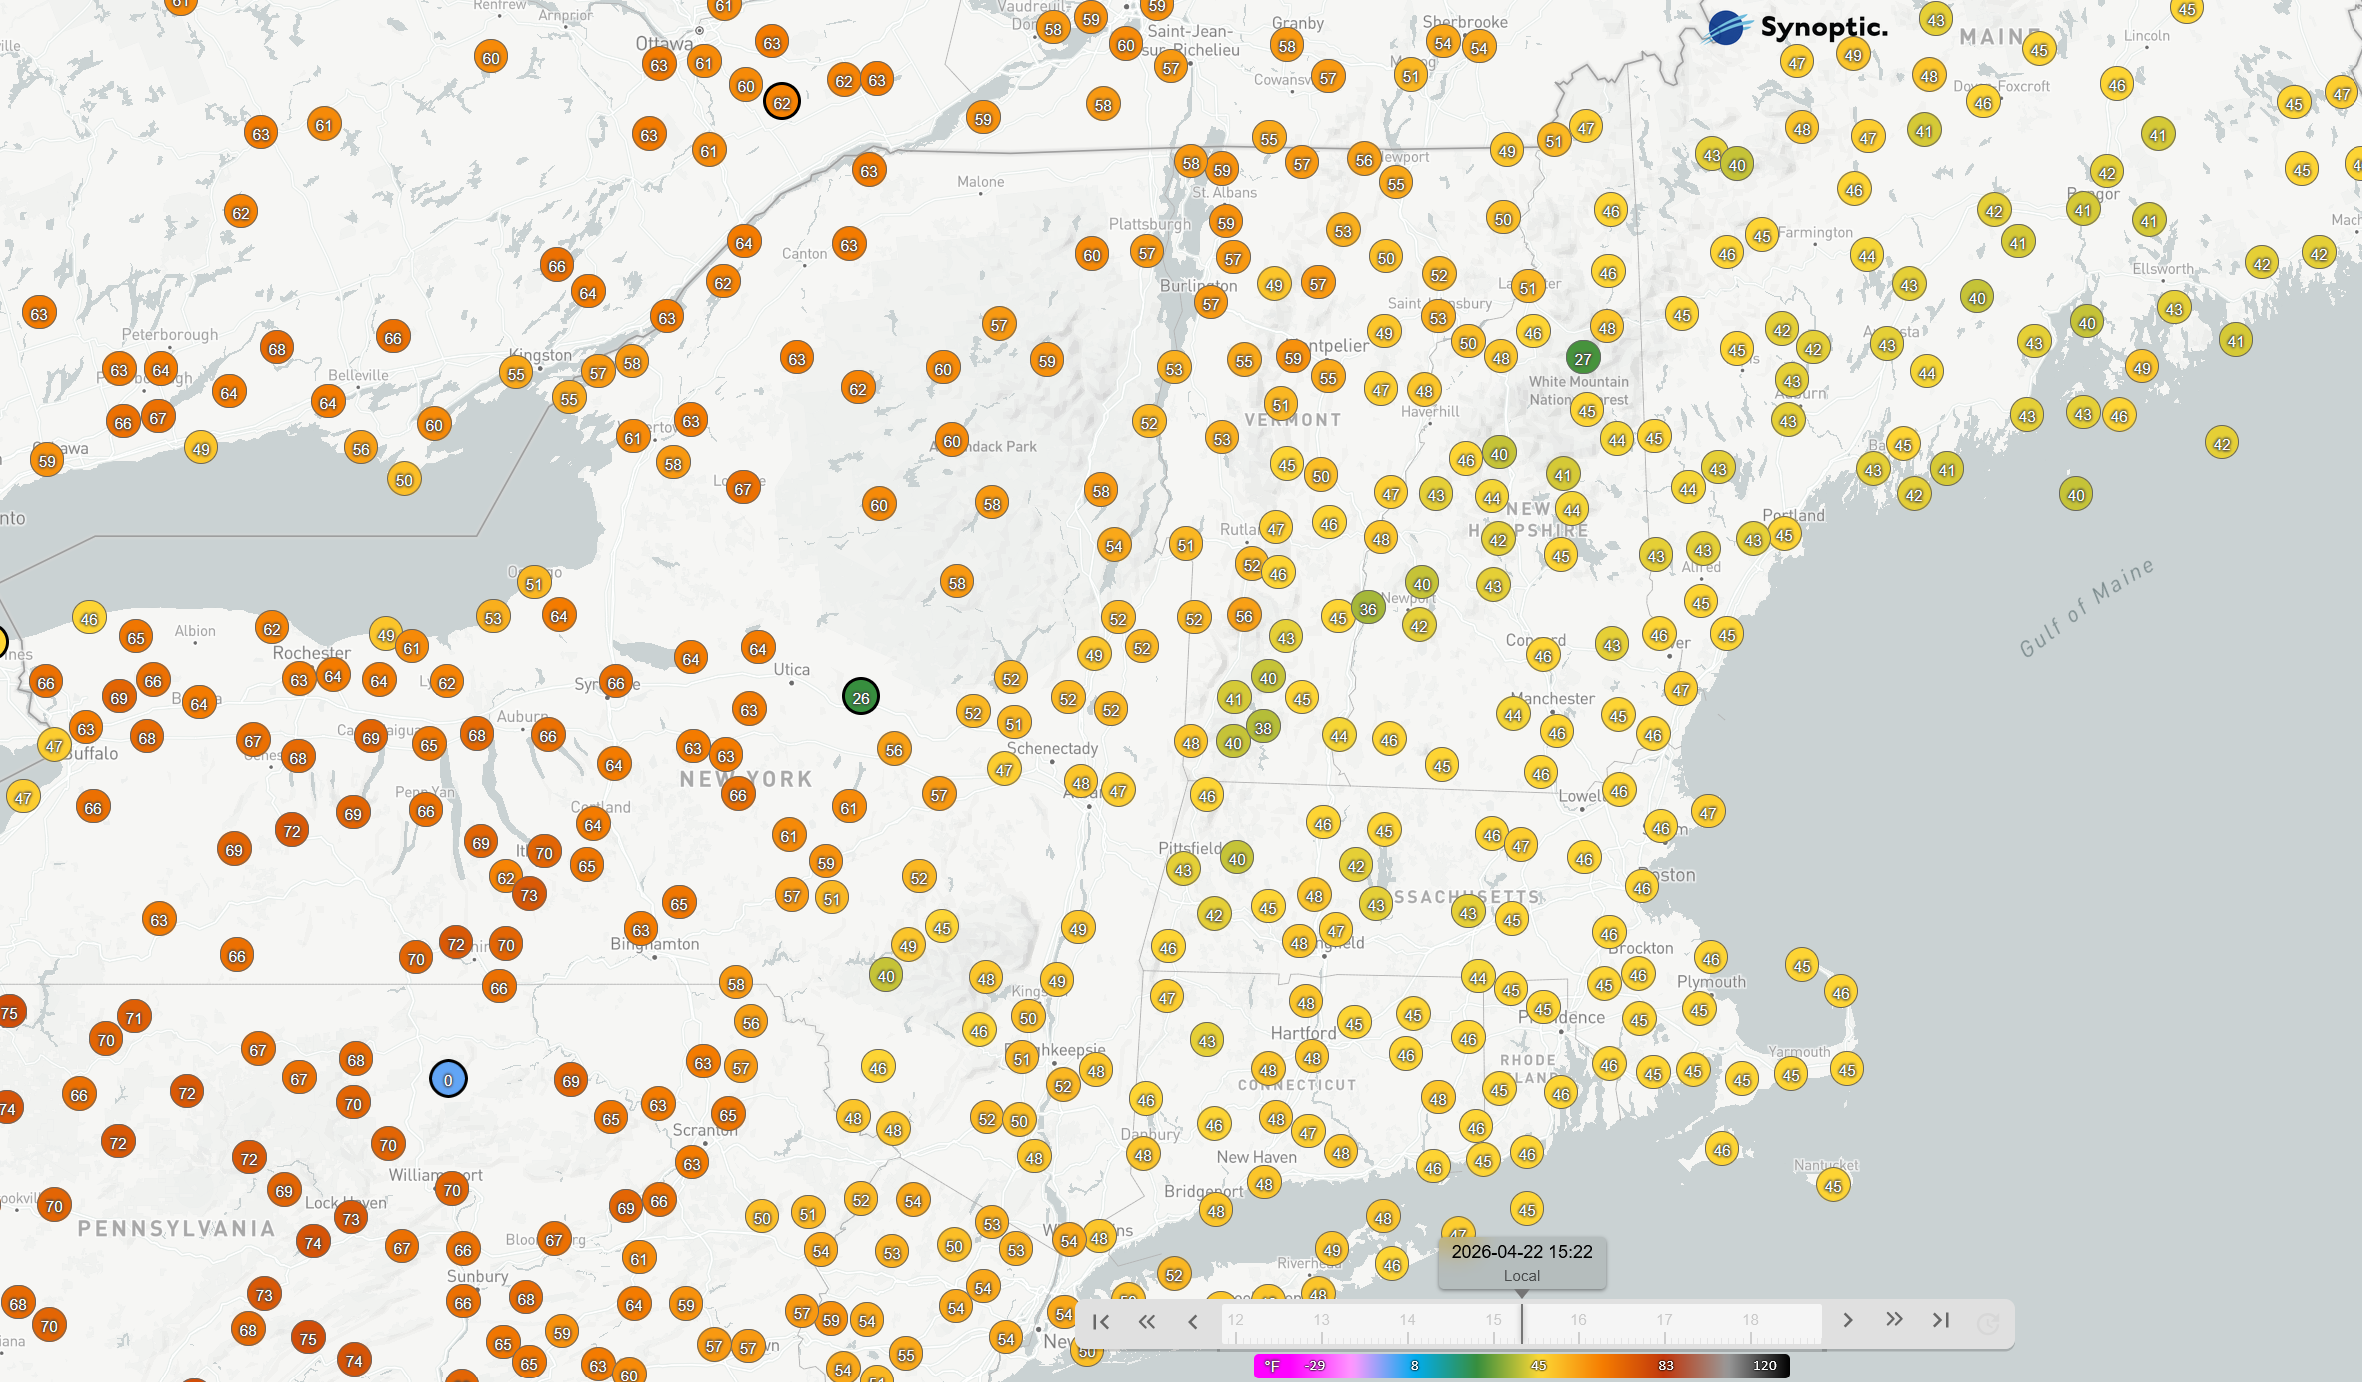
A rare (the first this season?) warm spring day here with very calm winds. usually we pay a price with these 60s/70s, but thankfully not today


.thumb.jpg.ad3a2e31d30aff035044689b311a0540.jpg)