All Activity
- Past hour
-
90/76 split here in Philadelphia today. Dewpoints fell to the upper 50’s for a bit. Thirty-fifth 90 thus far this summer.
- Yesterday
-
 mexico prescription online and pharmacy in mexico city buy drugs online https://www.google.gm/url?q=https://mexisaferx.com mexican online pharmacy wegovy and https://virtualchemicalsales.ca/user/gqsiiykaax/?um_action=edit mexican farmacia [url=https://www.google.gg/url?q=https://mexisaferx.com]farmacia online usa[/url] mexican meds or [url=https://brueckrachdorf.de/user/bxynxeursa/]mexico medication[/url] mexican farmacia
 -
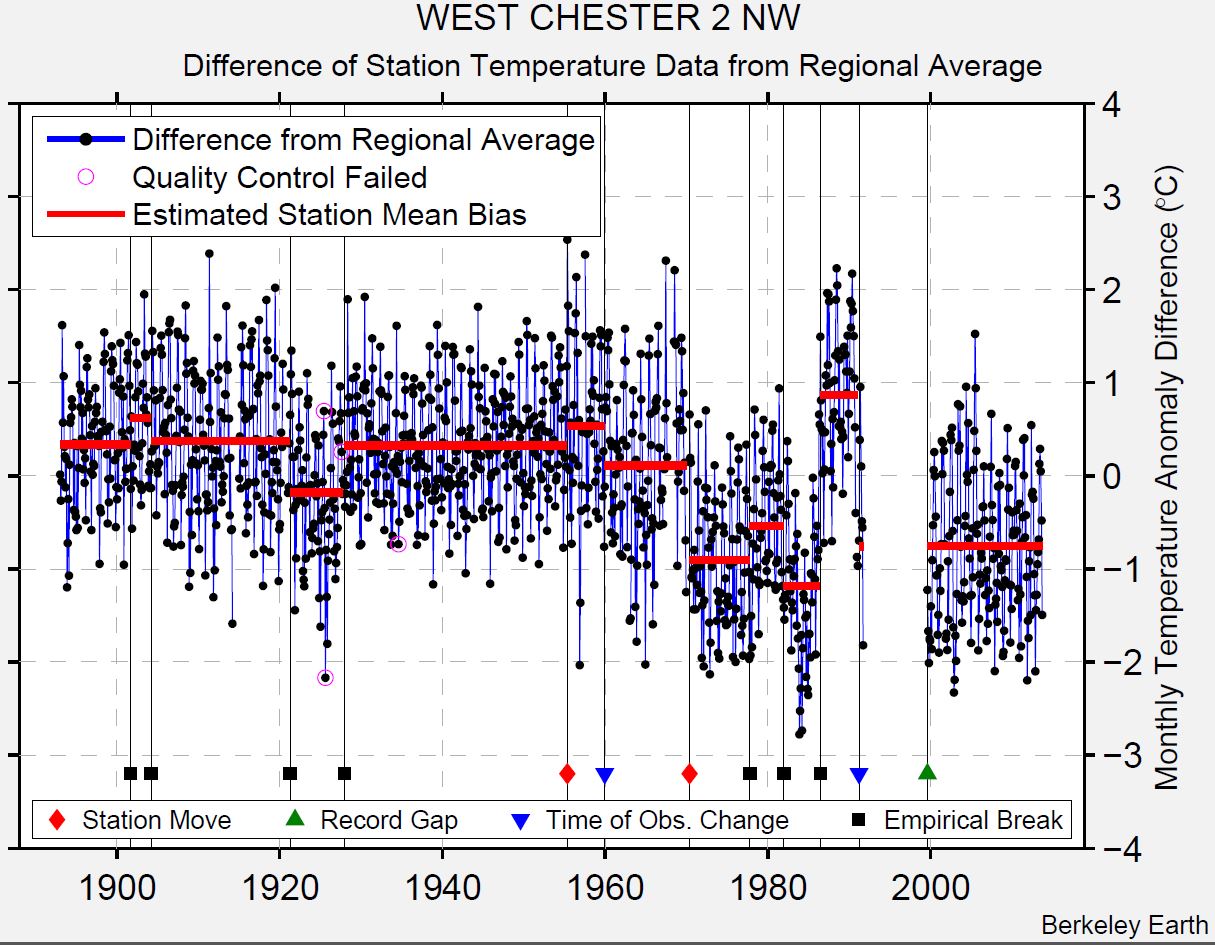
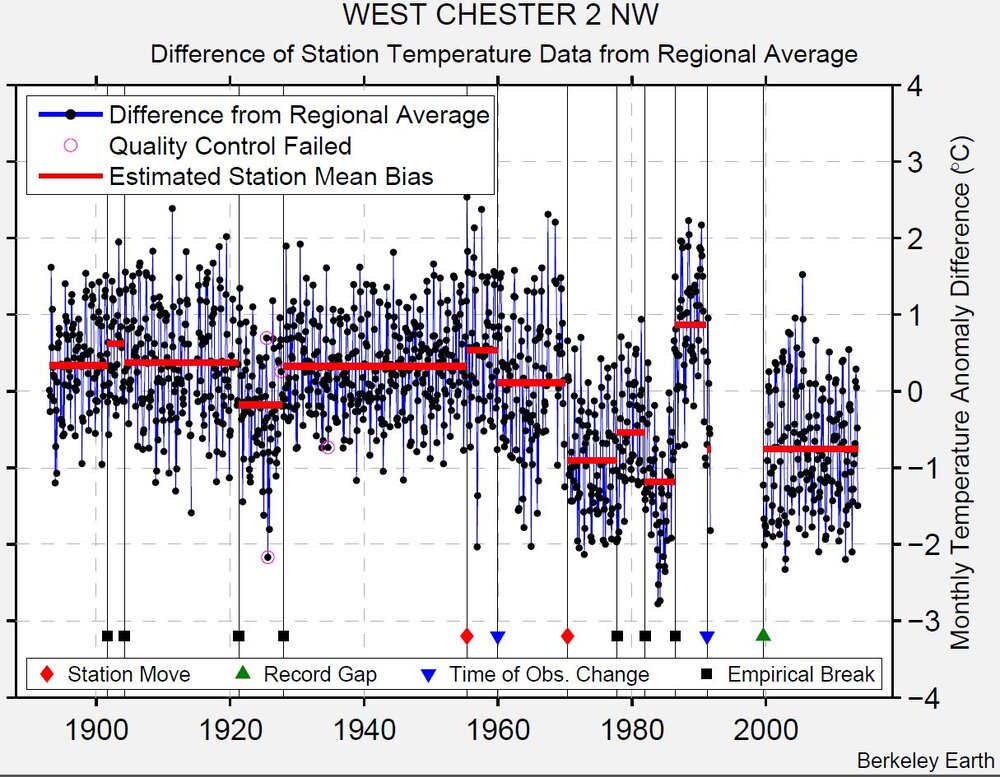
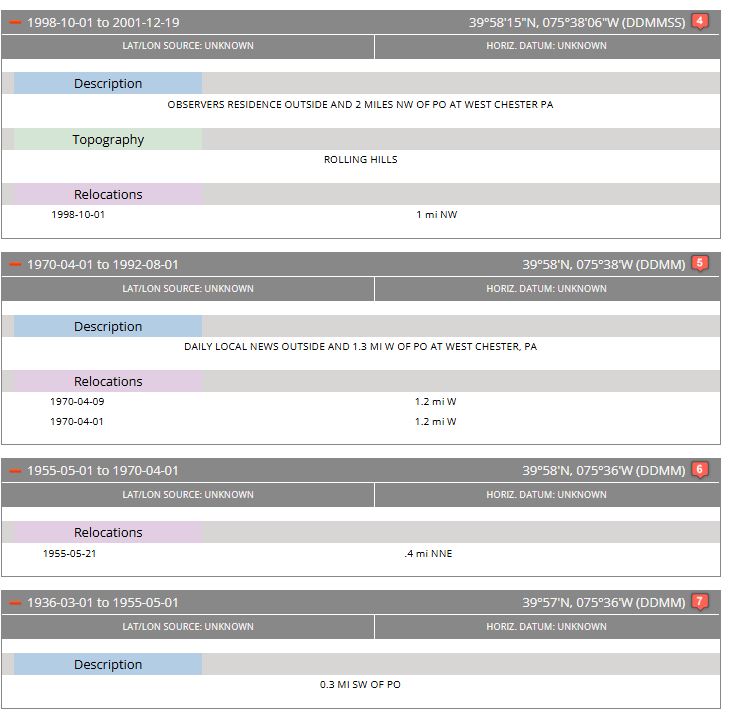
(002).thumb.png.6e3d9d46bca5fe41aab7a74871dd8af8.png) No hand waving Mike....just no clear documented reasons as only four of 51 (8%) trace to a documented real physical cause — three moves and only one TOB change. There are 2 zero break stations that are our controls: NCEI applied no adjustment to either. The Coatesville 1SW dates, all code 4: 1896-12, 1902-02, 1917-08, 1920-09, 1922-08, 1930-10, 1936-05, 1941-06, 1946-04, 1959-11, 1968-05, 1971-04, 1973-07, 1976-02. Fourteen inferred discontinuities against six documented HOMR relocations, coinciding with none of them. The linear ramp clearly fits far better than any step. And when you allow both, the step collapses to −0.050 °C while the slope survives essentially intact at +0.182 °C/dec. A one-time convention change explains basically none of it. And more importantly the actual magnitude is out of range. The Coatesville adjustment swings +1.51 °C from first decade to last (West Chester, from NCEI's own file, swings +2.38 °C). Published TOB corrections for a full afternoon-to-morning switch run roughly 0.2–0.5 °C in annual mean. So TOB, even granting it entirely (which is not valid), accounts for perhaps a third of the Coatesville adjustment and a fifth of West Chester's. To summarize how it all fits together Mike: Raw agreement across stations. Coatesville 1SW −0.366, West Chester 2NW −0.409, Phoenixville 1E −0.339 over 1941–75, all p ≤ 0.0012, inside each other's error bars. Both systems erase it. Berkeley and NCEI each render all three non-significant, with adjustment trends correlating at r = 0.9986. The correction is a "smooth ramp" which you question above but certainly not a step — which no single documented event can explain. Its size exceeds TOB by 3–5×. The breakpoints lack documentation. Fourteen at Coatesville, all code 4, against six documented relocations in HOMR. At West Chester, April 1921 and November/December 1927 are documented observer-and-site changes classified as empirically detected, and the March 1936 relocation produced no breakpoint at all. Phoenixville is the cleanest case — no detected convention change anywhere in its record, and it still cools at −0.339 (p=0.0012) - why is that? So many questions and still so few answers!! The unanswered questions that follows from this is narrow and should be answerable: exactly what documentation supports the fourteen breakpoints at USC00361589 - Coatesville 1SW and what portion of the adjustment at Coatesville is attributed to time-of-observation versus other causes? That last question is the one they can't deflect — because the shape of their own adjustment says it isn't mostly TOB!
No hand waving Mike....just no clear documented reasons as only four of 51 (8%) trace to a documented real physical cause — three moves and only one TOB change. There are 2 zero break stations that are our controls: NCEI applied no adjustment to either. The Coatesville 1SW dates, all code 4: 1896-12, 1902-02, 1917-08, 1920-09, 1922-08, 1930-10, 1936-05, 1941-06, 1946-04, 1959-11, 1968-05, 1971-04, 1973-07, 1976-02. Fourteen inferred discontinuities against six documented HOMR relocations, coinciding with none of them. The linear ramp clearly fits far better than any step. And when you allow both, the step collapses to −0.050 °C while the slope survives essentially intact at +0.182 °C/dec. A one-time convention change explains basically none of it. And more importantly the actual magnitude is out of range. The Coatesville adjustment swings +1.51 °C from first decade to last (West Chester, from NCEI's own file, swings +2.38 °C). Published TOB corrections for a full afternoon-to-morning switch run roughly 0.2–0.5 °C in annual mean. So TOB, even granting it entirely (which is not valid), accounts for perhaps a third of the Coatesville adjustment and a fifth of West Chester's. To summarize how it all fits together Mike: Raw agreement across stations. Coatesville 1SW −0.366, West Chester 2NW −0.409, Phoenixville 1E −0.339 over 1941–75, all p ≤ 0.0012, inside each other's error bars. Both systems erase it. Berkeley and NCEI each render all three non-significant, with adjustment trends correlating at r = 0.9986. The correction is a "smooth ramp" which you question above but certainly not a step — which no single documented event can explain. Its size exceeds TOB by 3–5×. The breakpoints lack documentation. Fourteen at Coatesville, all code 4, against six documented relocations in HOMR. At West Chester, April 1921 and November/December 1927 are documented observer-and-site changes classified as empirically detected, and the March 1936 relocation produced no breakpoint at all. Phoenixville is the cleanest case — no detected convention change anywhere in its record, and it still cools at −0.339 (p=0.0012) - why is that? So many questions and still so few answers!! The unanswered questions that follows from this is narrow and should be answerable: exactly what documentation supports the fourteen breakpoints at USC00361589 - Coatesville 1SW and what portion of the adjustment at Coatesville is attributed to time-of-observation versus other causes? That last question is the one they can't deflect — because the shape of their own adjustment says it isn't mostly TOB! -

2026-2027 Record-breaking El Nino
mitchnick replied to Stormchaserchuck1's topic in Weather Forecasting and Discussion
A Roundy post in honor of Snowman...sorta. https://x.com/PaulRoundy1/status/2087329199317012723?s=46&t=JYOHM881b6groqc0-RqtxA -

Spring/Summer 2026 Pattern Discussion Thread
John1122 replied to Carvers Gap's topic in Tennessee Valley
Just had another heavy shower, only had one clap of thunder but it was a loud one. Looks like more upstream. -
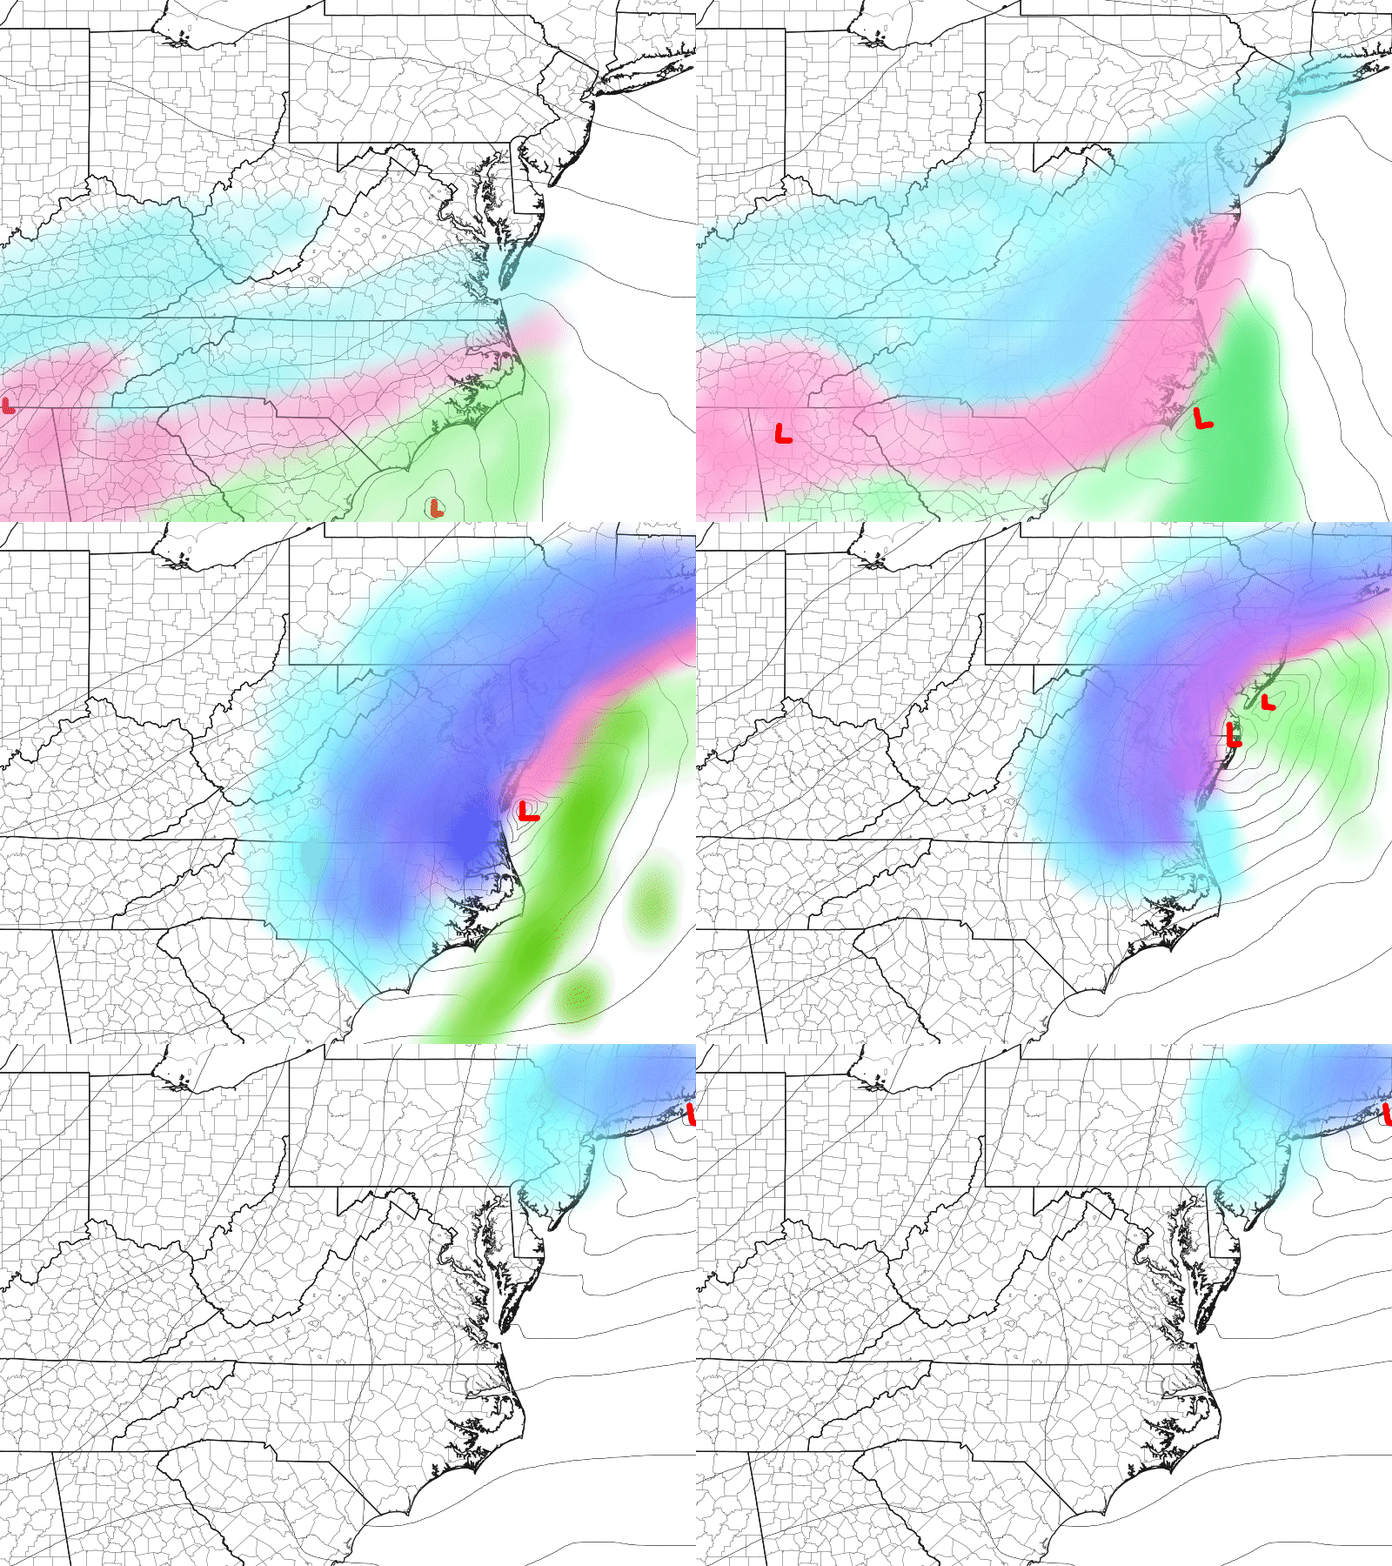
Hopefully this manifests something. Made sure not to mix @CAPE
-
http://mexisaferx.com/# mexico pharmacy list
-
 What smooth ramp do you refer to? I just glanced at the breakpoints at BEST for the stations in the table and none of them look like "smooth ramps". Coatesville's breakpoint are fully documented at this point. I have shown you that there is hard documented real world events driving the breakpoints for this station. If you think there is something off about the breakpoints for the other stations, and that the published work of scientists around the world is flawed, then it is on you to do the deep dive on the histories through all available sources and make your case. Don't just wave your hands saying "absolutely no metadata backing, that's an algorithm asserting station changes that are clearly not able to be documented"--without first scouring all source for that documentation. For West Chester, I just took a quick look at the breakpoints at BEST, the 530-1, and HOMR records. About half the breaks are clear just from the 530-1 and HOMR. There are breakpoints at ~1978, ~1982 and ~1988 that don't have explanations yet and may be in the paper forms, or other records. Its the Daily Local--there are going to be a lot of records about where they were located. Have AI write a tool to download all the paper forms from batch "AA92589" or just do it manually around those dates. Anyway, it is on you to prove there is no documentation for these moves, you cant just say there aren't any without looking at the available documentation first.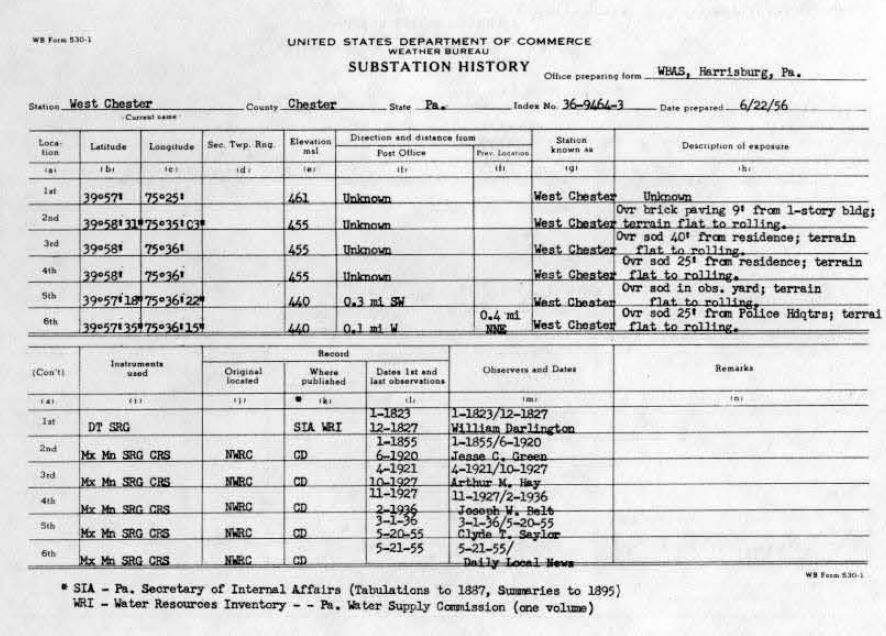
-
Fairly pleasant outside this evening. “Only” made it to 89.6 and heat index never got above 92 with tolerable DPs in the 60s. Tomorrow is back to the oven
-
You will often here folks say well while our average daytime highs may not be warming significantly....we are certain that the nightime lows are warmingg....Well I went back and did a statistical analysis to see if between 1890 and 2025 we saw statistically warming of overnight lows and daytime highs along with the overall average temperatures. We used both a pure raw all station mean which is just the raw untouched data and an anomaly composite which while still raw data, treats each individual station referenced to its own baseline so the changing station roster and locations can't fabricate some false trend. Raw all-station mean (the literal, unadjusted county average): none of the three are statistically significant. Average high: +0.055 °F/decade, p = 0.073 — warming, but just short of significance (borderline). Average low: +0.022 °F/decade, p = 0.49 — not significant. Overall average: +0.039 °F/decade, p = 0.15 — not significant. So by the pure raw mean, there's no statistically significant warming or cooling in any of the three over 1890–2025 — a slight (non-significant) warming lean in all three. Anomaly composite (still raw data, but each station referenced to its own baseline so the changing station roster can't fabricate a trend): two of the three are significant, and they point in opposite directions. Average high: +0.094 °F/decade, p = 0.003 — significant warming. Average low: −0.075 °F/decade, p = 0.008 — significant cooling. Overall average: +0.010 °F/decade, p = 0.72 — not significant (the high and low cancel out). The one thing both methods agree on firmly: the overall average temperature shows no statistically significant trend either way across the 135 years across Chester County from 1890-2025. Below are some charts that highlight all of the above.
-
2026 C and E Pacific tropical activity
NorthHillsWx replied to GaWx's topic in Tropical Headquarters
Looks like one of those CAG systems in the Caribbean -

Augdewst 2026: Summer's Last Stand
dendrite replied to Prismshine Productions's topic in New England
3 drops by the time this gets here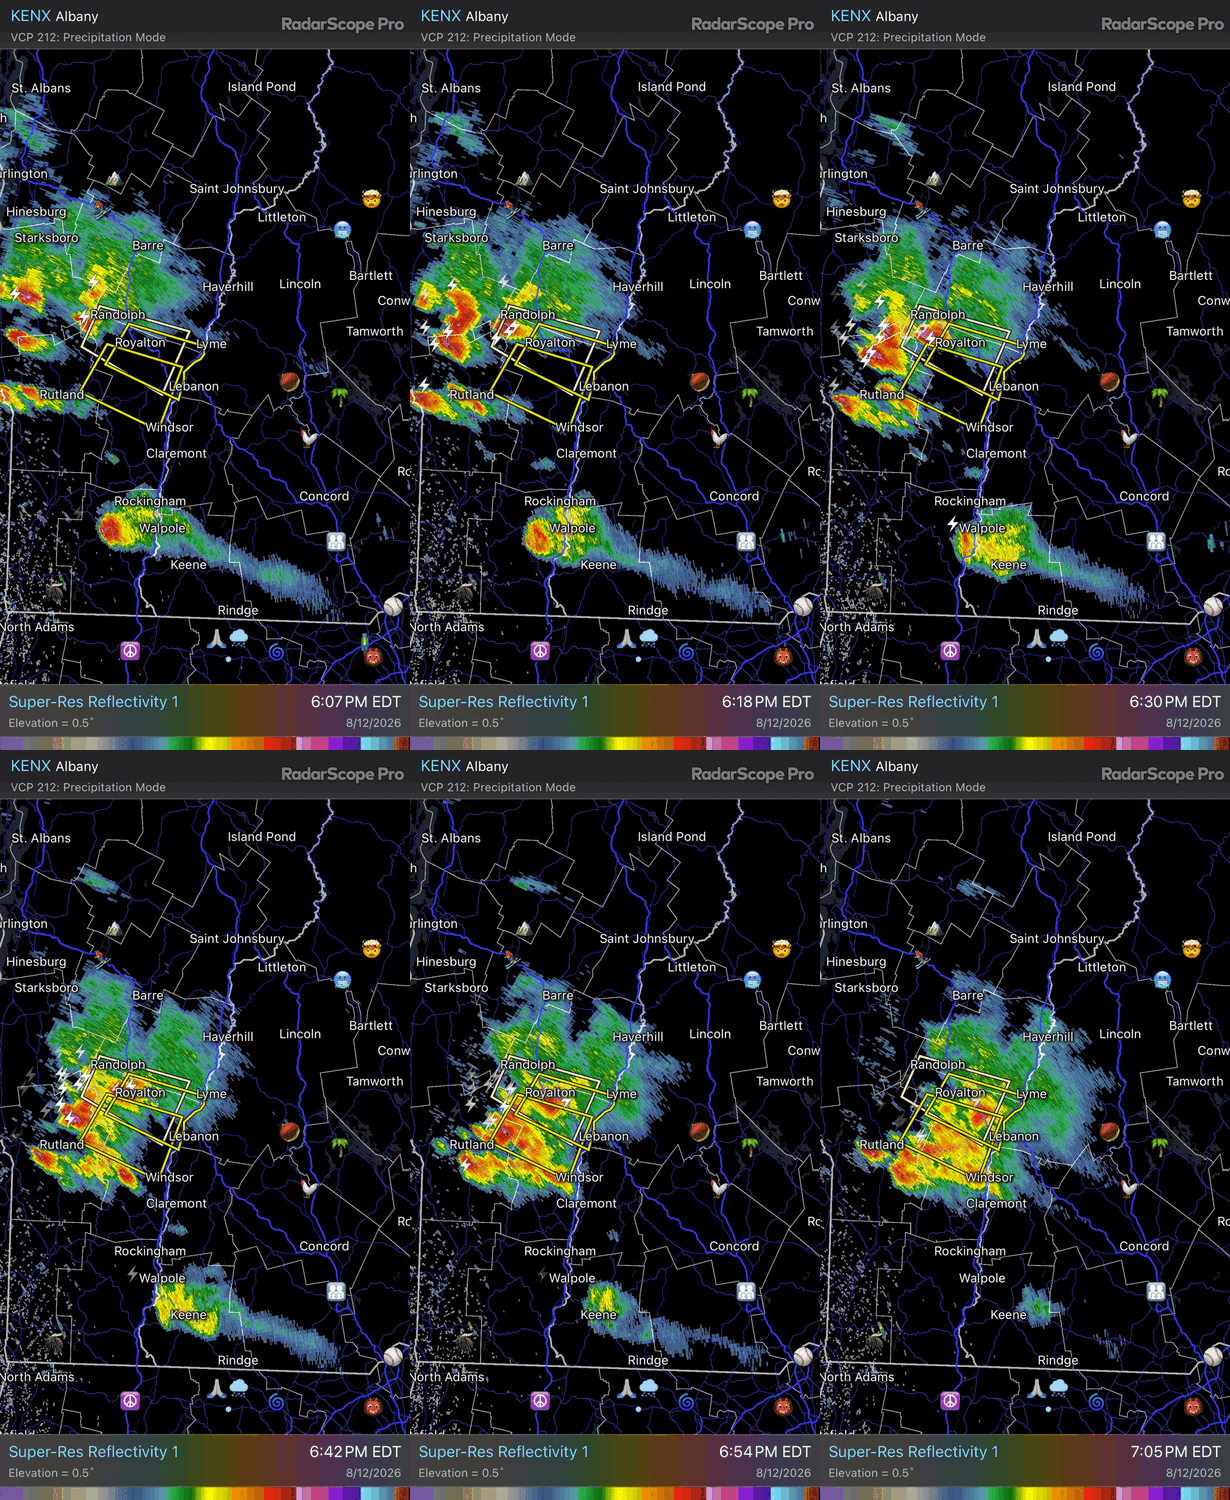
-

Central PA Summer 2026 Discussion/Obs Thread
Blizzard of 93 replied to Voyager's topic in Upstate New York/Pennsylvania
Thank goodness that this is not Winter, lol! -

2026 C and E Pacific tropical activity
gallopinggertie replied to GaWx's topic in Tropical Headquarters
Right, as it’s currently forecast it looks like just a moderate impact to Hawaii, probably similar to Iselle which hit the Big Island around 10 years ago as a 60 mph tropical storm and caused significant damage to the papaya crop. Per the NHC forecast this one could surpass Iselle by a bit, in which case it could become the strongest tropical cyclone to make landfall on the Big Island (or any of the islands other than Kauai). It looks to be moving through the islands at a good clip which hopefully cuts down on flooding. -
Only 44 more to tie the Texas record.
-
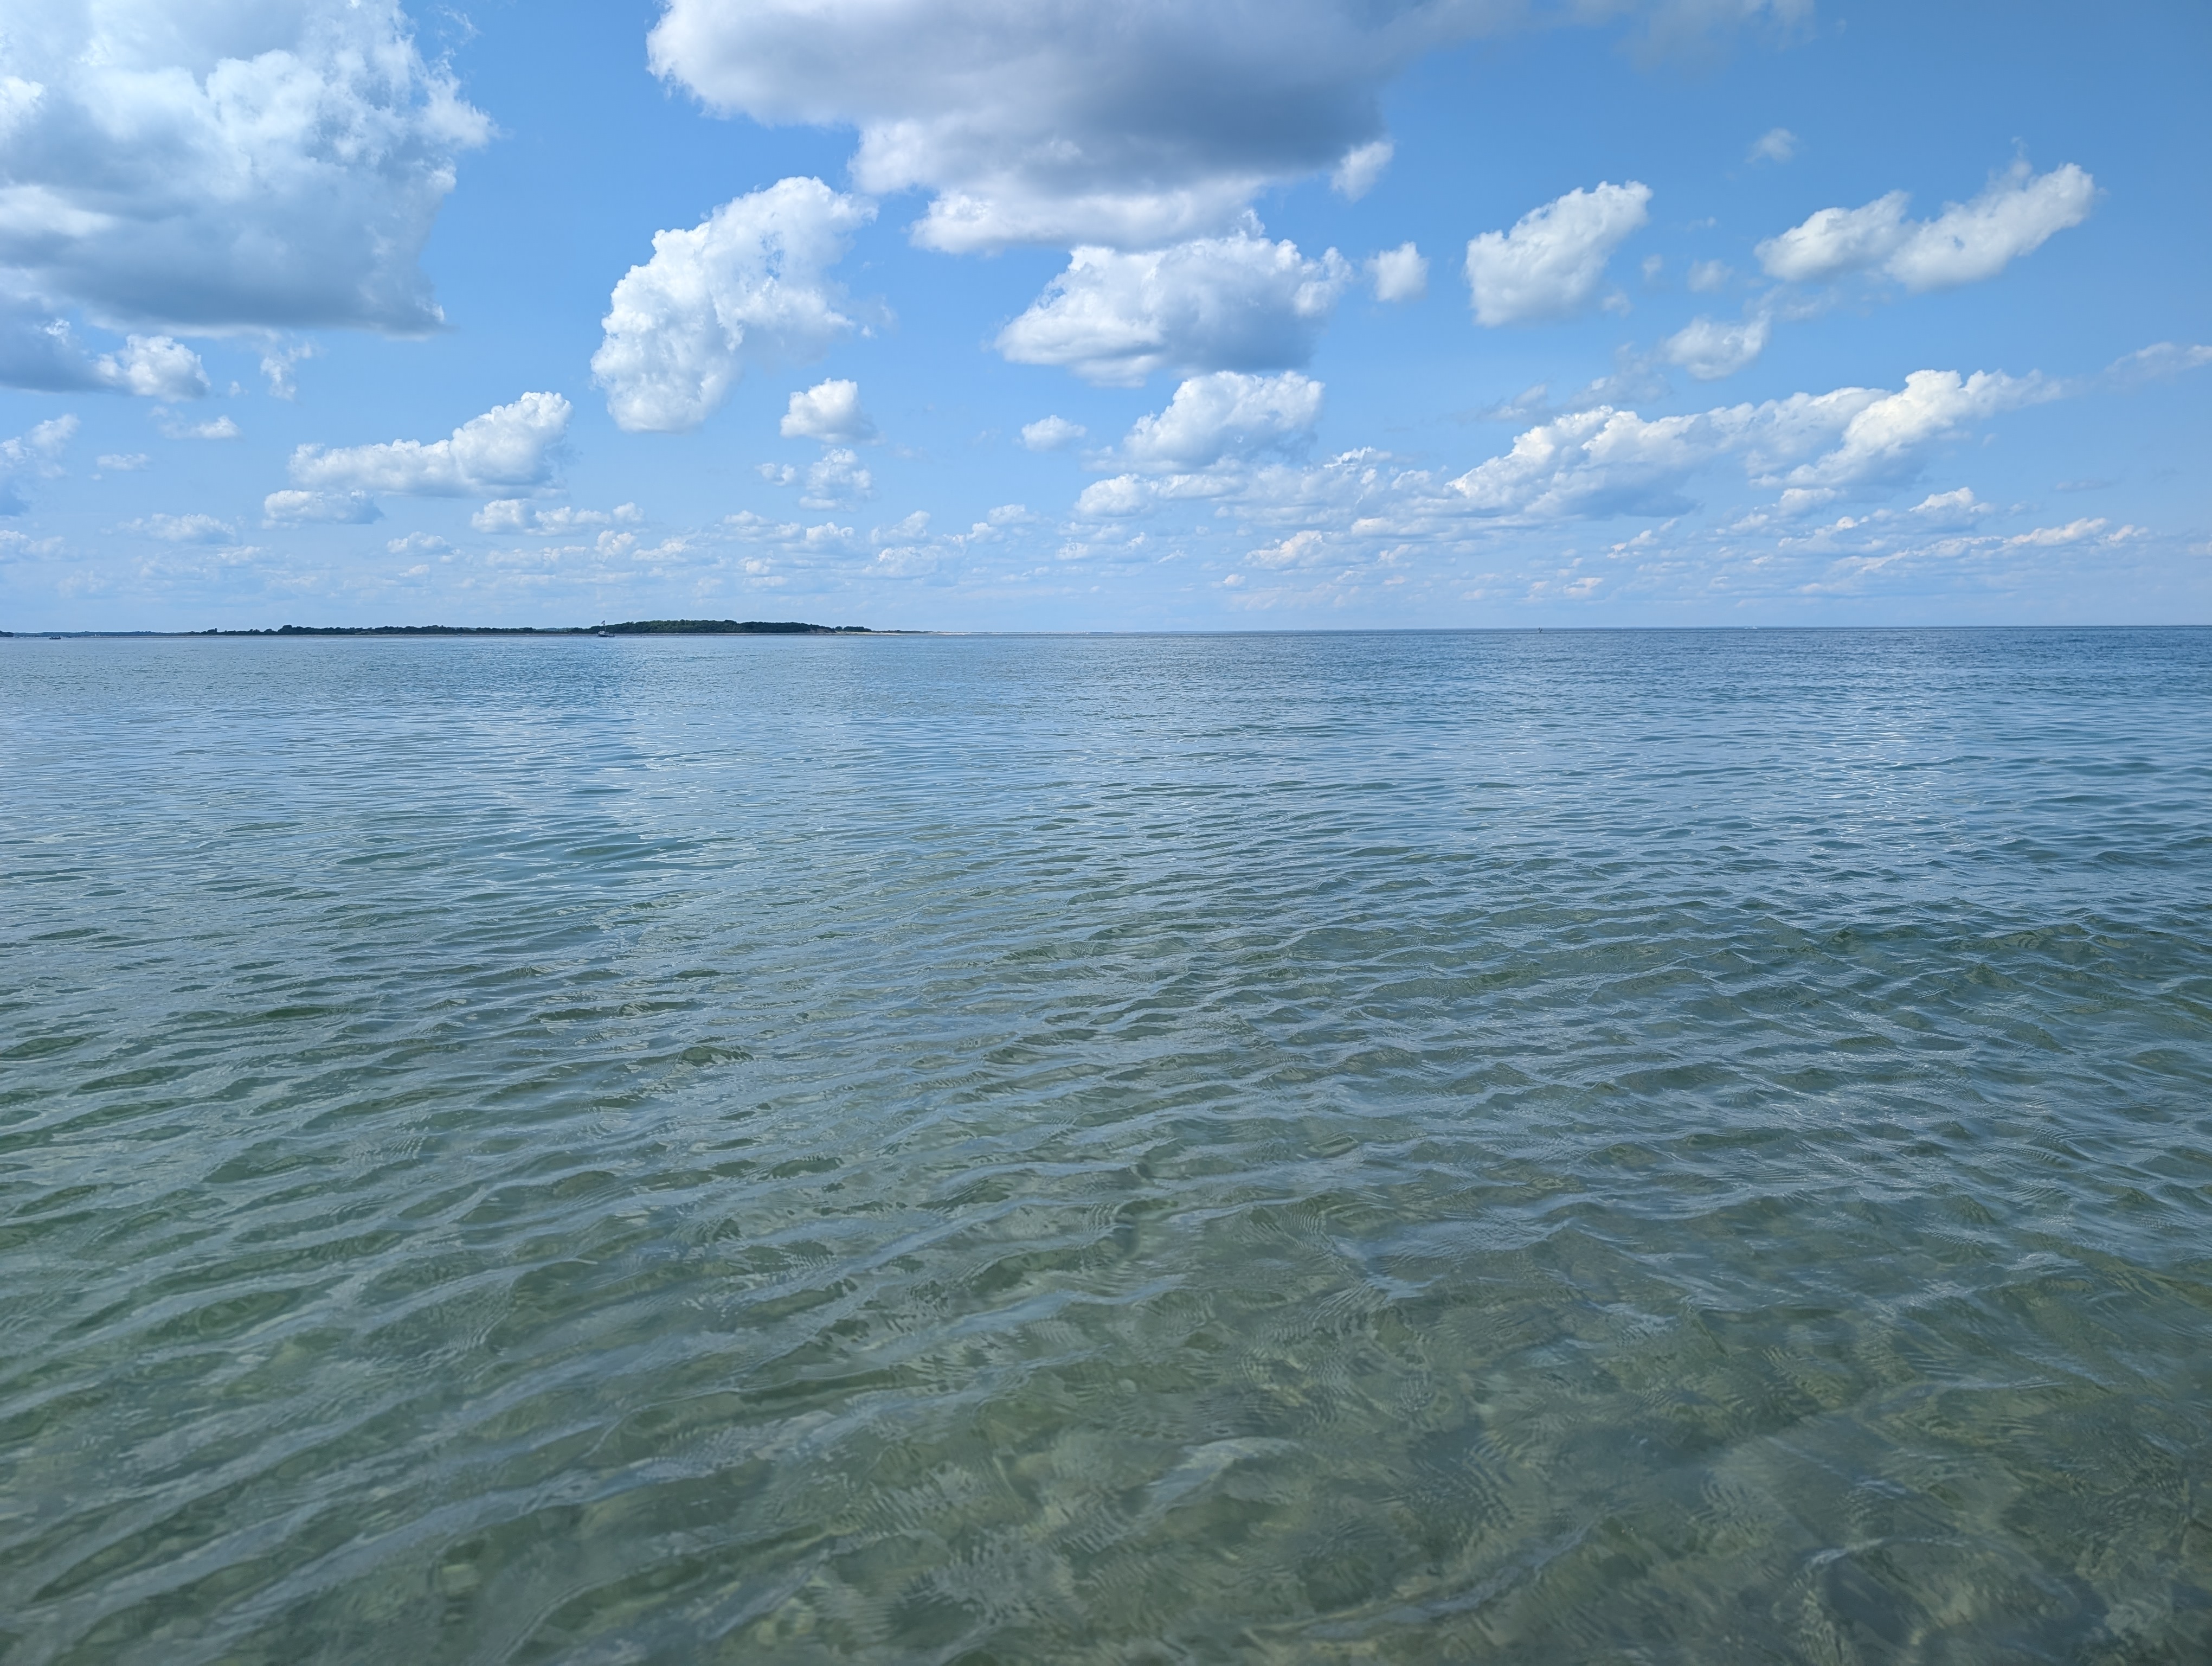
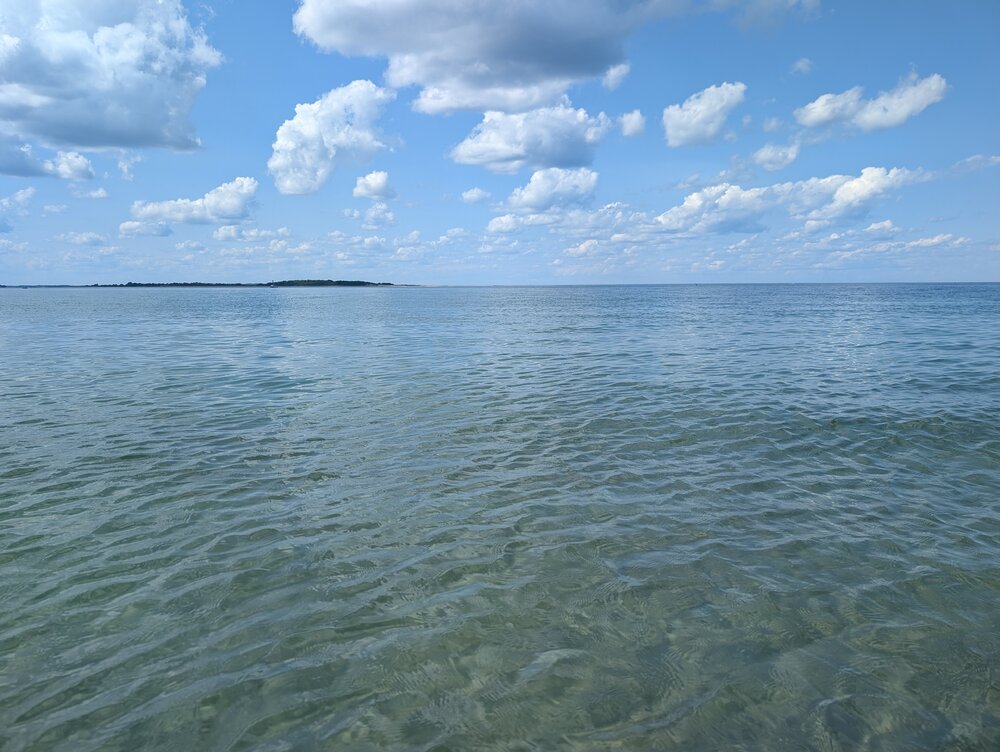
you have pretty beaches
-
With the tornadoes confirmed thus far with yesterday's derecho, the 2026 Illinois tornado count has now surpassed 200.
-
Charlottesville robbed. Gonna start every thread this season to force southern sliders.
-
2026 Atlantic Hurricane Season
NorthHillsWx replied to Stormchaserchuck1's topic in Tropical Headquarters
Pretty surprising to see this much MDR activity in a strong nino in August. Heck even some recent Augusts with La Niña couldn’t produce in MDR -
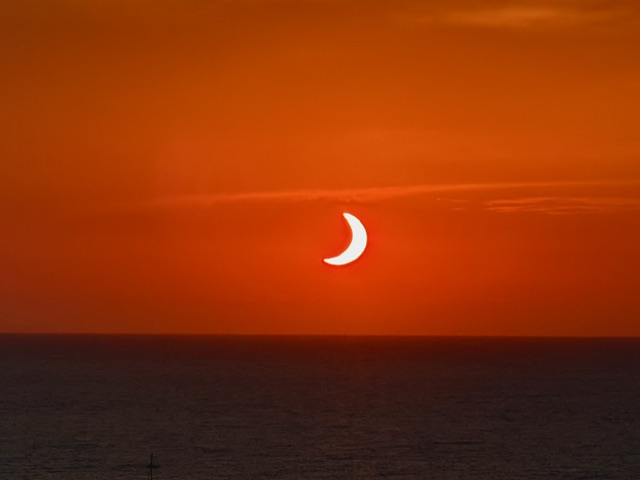
Unfortunately, at the last few minutes, some horizon clouds moved in and we didn’t see totality. Of the three eclipses that I’ve chased, this is a first for me and I am only disappointed for the newbie’s on the trip that still don’t appreciate totality. I won’t be home for a few more days, but here’s a phone pic of the “disappointment.”
-
I come back to the midwest for a couple weeks. Cant wait to get out of the humidity thats down here in the mid Atlantic. See the Great Lakes again!
-
@WxUSAF @CAPE @das@MillvilleWx @Terpeast Not sure why this isn’t getting more attention or maybe it is and I missed it but NCEP/NCAR Reanalysis has been discontinued as of March. This is the primary source of all those analog composites you see posted in the discussion threads. As of now I’ve seen nothing in terms of what’s replacing it. How can that be? It’s a major tool. Hopefully someone can tell me I’m wrong and there is another option I just don’t know about for this data moving forward.
-
2026-2027 Record-breaking El Nino
EasternLI replied to Stormchaserchuck1's topic in Weather Forecasting and Discussion
I've learned a great deal about the MJO over the years. Because I view it as an important phenomenon but also didn't like relying on others for real updates. I wanted to know more than what the simple phase space diagrams can offer. This is a challenging year to be trying to follow the MJO. Need to be able to dig into it a little deeper to really see what's going on with it. Or to even see it at all. Like I mentioned earlier in the thread, the RMM charts can be misleading sometimes. This year is one of those times. The following from the CPC global tropics discussion also points that out, updated yesterday: https://www.cpc.ncep.noaa.gov/products/precip/CWlink/ghaz/index.php "The Madden Julian Oscillation (MJO) has continued a pattern of constructive and destructive interference with the El Nino low-frequency base state over the past few months as the El Nino signal has strengthened. Over the past week, the RMM-based index showed the MJO intensifying as it moved through the Maritime Continent and into the Western Pacific (Phase 6) where it once again began to constructively interfere with El Nino. The MJO signal has now reached a stronger amplitude than the last time it emerged in Phase 6, back in late June when the El Nino signal was superimposed on the enhanced phase of the MJO. Upper-level velocity potential anomalies over the past week show a weak MJO signal farther west moving through the Indian Ocean, suggesting that the strong El Nino background state may be distorting the position of the MJO in RMM-space. With this ongoing constructive interference with the El Nino base state, RMM-based forecasts keep the MJO signal over the Western Pacific (Phase 6) for the next two weeks. Although consistent with phasing, models are split on the amplitude of the signal, with the ECMWF and CFS predicting a robust MJO over the next week and the GEFS maintaining a weaker signal. During Weeks 2 and 3, the GEFS begins to amplify the signal and maintains a strong MJO, while the ECMWF shows a weakening signal moving into the unit circle. By the end of week-3, the models agree on the signal moving into Phase 7. Over the next four weeks, the upper-level velocity potential anomalies show a stationary wave-1 pattern with the enhanced divergence envelope remaining over the Eastern Pacific. However, eastward propagation of the MJO signal can be seen in the wave filtering, showing the signal propagating from the Indian Ocean into the far Eastern Pacific." -
mexican medicine store: Mexi Safe Rx - international pharmacy
-

Central PA Summer 2026 Discussion/Obs Thread
canderson replied to Voyager's topic in Upstate New York/Pennsylvania
About 11.5” more than me lol