All Activity
- Past hour
-
TORCH this week!
-
Ridge(y) east but still suspect we are not as dry and may deal with cut off under the ridge 11/5 - 11/11
-
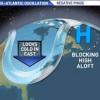
Good stuff. At this point, I'm particularly interested in whether we can get any meaningful downstream troughing into the eastern U.S. as we head into the second half of November. Obviously, it's still early in the season, but we've seen November snowfall in Tennessee before, even if it's relatively rare. Curious whether this persistent IO forcing could eventually help shake up the pattern enough to open the door for some early-season cold.
-
36.2 in Muttontown & 38.8 in Syosset this morning.
-

2026-2027 Record-breaking El Nino
Typhoon Tip replied to Stormchaserchuck1's topic in Weather Forecasting and Discussion
Fwiprobablynotworth ... this ACME road-runner show quality graphic over at CPC seems to suggest there's a secondary +anomaly node ( if not primary...) situated around the 3.4 ... interestingly trying to connect to the marine heat wave going on around San Diego ... The nearby coastal cooling astride El Salvador - I suspect - is an artifact of the enhanced TC trafficking over the last 1.5 months running up just W of that area and imposing offshore SS stressing ..speculation.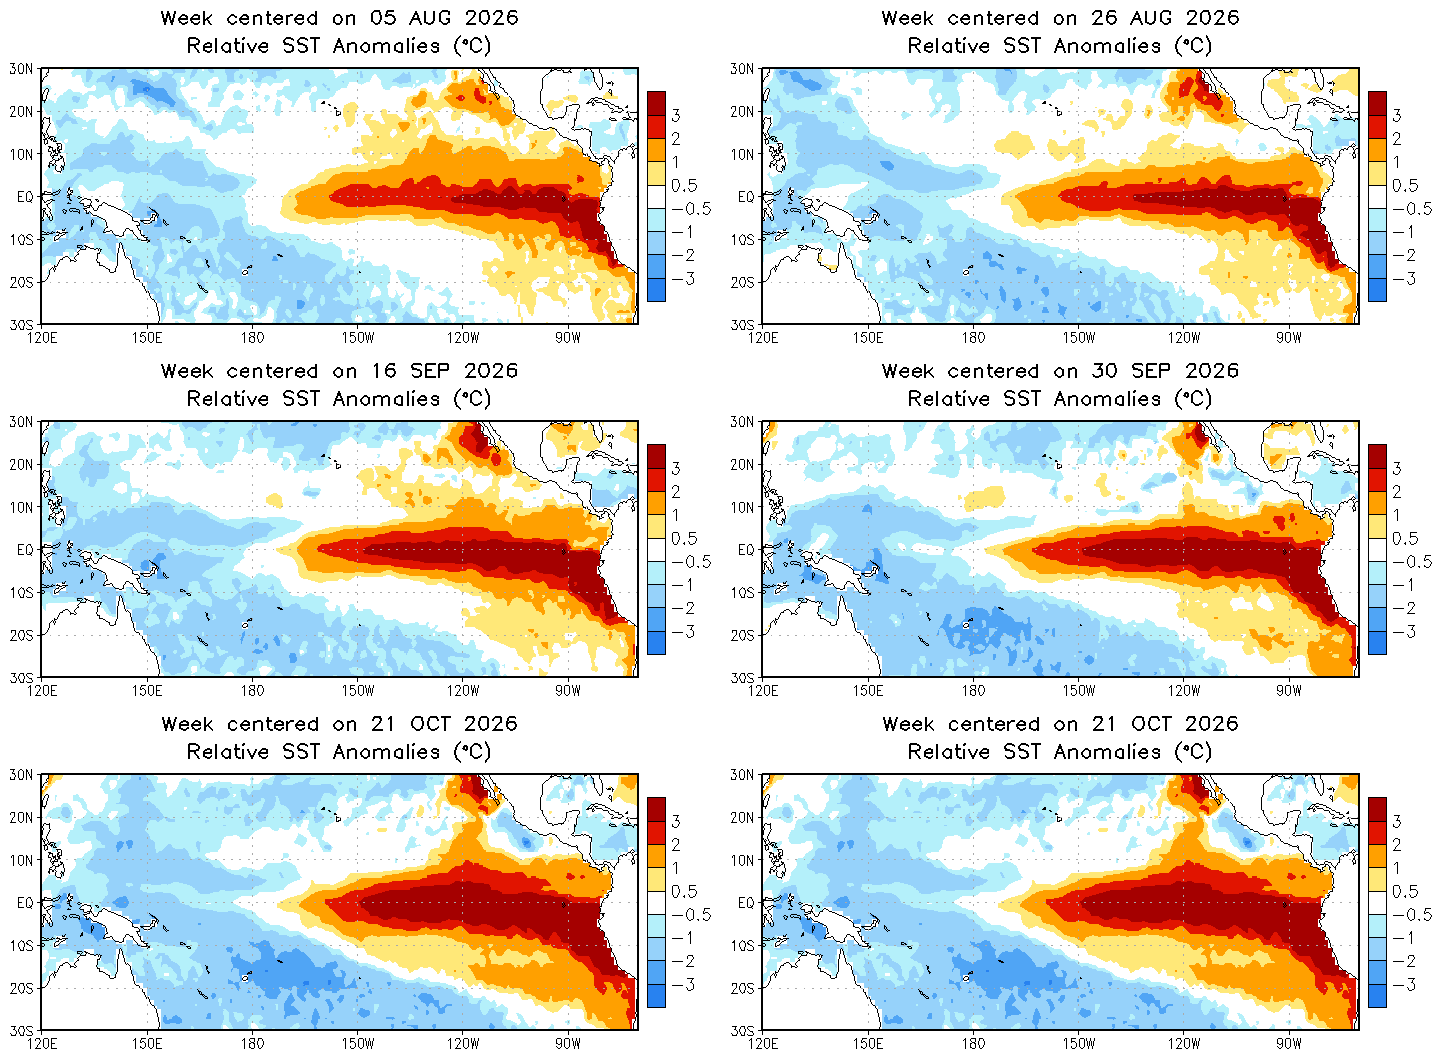
-
Records: Highs: EWR: 82 (2023) NYC: 78 (1964) LGA: 80 (2023) JFK: 78 (1971) Lows: EWR: 31 (1952) NYC: 30 (1879) LGA: 34 (1962) JFK: 32 (1962) Historical: 1859 - New York City had their earliest substantial snow of record as four inches blanketed the city. (David Ludlum) 1865: A hurricane sank the steamship USS Mobile off the Georgia coast. The wreck, laden with 20,000 gold coins, was found in 2003. 1879: Boston, Massachusetts had a low temperature of 25 °F on October 26th the coldest temperature for October. Also another 25 °F low was recorded on October 27, 1936. (Ref. NOAA Boston Weather Events) 1919 - The temperature at Bismarck, ND, plunged to ten degrees below zero, the earliest subzero reading of record for the city, and a record for the month of October. (The Weather Channel) 1926 - Barrow, AK, received a record fifteen inches of snow, and also established a 24 hour precipitation record of 1.00 inch which lasted until the 21st of July in 1987. (The Weather Channel) 1952: There have been thousands of weather reconnaissance and research flights into hurricanes in the Atlantic and Pacific since the mid-1940s. There have been several close calls, but only four flights have been lost. A B-29 Super-fortress flight into Super Typhoon Wilma 350 miles east of Leyte in the Philippines disappeared on this date. No trace was ever found of the plane or crew. In the last report, the flight was in the Super typhoon's strongest winds, which were around 160 mph. 1962 - A storm brought five to six inches of snow to Vermont and New Hampshire, with up to ten inches reported in the mountains. (The Weather Channel) 1962: An early season snowstorm hit New England with the most snow over interior sections. Greenville, ME recorded 13.9 inches Worcester, MA recorded 4.7 inches and Portland, ME had 3.6 inches. All of these amounts were new records for the greatest amount of snow for so early in the season. (Ref. AccWeather Weather History) Canadian high pressure ushered record cold from the northern Plains to the Southeast. Rockford, IL at 18° recorded their coldest October temperature. Other daily record lows included: Beckley, WV: 18°, Cincinnati, OH: 19°, Dayton, OH: 21°, Mansfield, OH: 21°, Huntington, WV: 21°, Springfield, IL: 22°, Columbus, OH: 23°, Lexington, KY: 23°, Akron, OH: 24°, Charleston, WV: 24°, Lynchburg, VA: 25°, Pittsburgh, PA: 25°, Raleigh, NC: 27°, Charlotte, NC: 29°, Atlanta, GA: 30°, Athens, GA: 31°, Montgomery, AL: 32°, Wilmington, NC: 32°, Charleston, SC: 33°, Savannah, GA: 34° and Norfolk, VA: 36°. (Ref. Wilson Wx. History) 1968: Canadian high pressure system behind a strong cold front brought chilly temperatures to the Southeast. Cross City, FL reported and all-time October record low of 30°. Other daily record lows included: Nashville, TN: 27°, Paducah, KY: 28°, Chattanooga, TN: 29°, Birmingham, AL: 29°, Atlanta, GA: 29°, Montgomery, AL: 31°, Macon, GA: 32°, Tallahassee, FL: 35°, Baton Rouge, LA: 37°-Tied, Pensacola, FL: 40°-Tied and Vero Beach, FL: 50°. (Ref. Wilson Wx. History) 1983 - A heat wave was in progress over the Northern Rockies, with record highs of 81 degrees at Sheridan WY and Billings MT.(Sandra and TI Richard Sanders - 1987) 1987 - Five cities in south central Texas reported record high temperatures for the date, including Corpus Christi and Del Rio with readings of 93 degrees. Laredo TX was the hot spot in the nation with a high of 98 degrees. Thunderstorms moving over the Lower Mississsippi Valley deluged Lake Charles LA with 2.70 inches of rain in one hour resulting in severe local flooding. (The National Weather Summary) (Storm Data) 1997: An autumn snowstorm pummeled central and south-central Nebraska with record early season snows. Wind-driven snowfall amounts totaled as much as two feet by storms' end. Several highways were closed, including Interstate 80, as near-blizzard conditions developed. Once the snow subsided, the record early season snow totals were tallied. Guide Rock measured twenty-four inches of snow, Clay Center twenty-three inches, and Hastings seventeen inches. A fifty-mile wide swath of snow more than fifteen inches fell from near Alma to York. Amounts further north averaged from four to eight inches. The heavy, wet snow was responsible for many power outages in the area as tree limbs broke and fell on power lines. At one point, the town of Hardy had no power and could not be accessed by vehicles due to the snow. Numerous schools and businesses remained closed several days following the storm. Many highways, including Interstate 80, closed at the height of the storm. On Highway 136 east of Alma, road crews worked for ten hours carving through a ten-foot drift that covered the road. Record cold accompanied the snow as temperatures dropped to the single digits on the morning of the 26th. 1988 - Thunderstorms moving out of northern Texas spawned five tornadoes in Louisiana during the morning hours. The thunderstorms also produced wind gusts to 75 mph at Jennings LA, and the driver of a vehicle was killed by a falling tree near Coushatta LA. Snow squalls in the Lower Great Lakes Region produced heavy snow in western New York State, with 12 inches reported at Colden. (The National Weather Summary) (Storm Data) 1989 - Unseasonably warm weather continued in the north central U.S. Afternoon highs of 78 degrees at Alpena MI, 75 degrees at Duluth MN, 79 degrees at Fargo ND, 77 degrees at International Falls MN, 76 degrees at Marquette MI, 75 degrees at Sault Ste Marie MI, and 80 degrees at Saint Cloud MN, were all the warmest of record for so late in the season. Morning lows of 63 degrees at Concordia KS and Omaha NE were the warmest of record for the date. (The National Weather Summary) 1997: Scientists discovered a massive "blowdown" of 20,000 acres of spruce trees in north-central Colorado. 31 square miles of old-growth forests high in the Rockies were destroyed by unusual "mountain wave" clouds that blew 120 mph winds along the western side of the Continental Divide as a major blizzard pounded the Plains from the through the 26th. Behind the storm, record low temperatures were reported across the Plains including: Scottsbluff, NE: 0°, Rapid City, SD: 2°, Goodland, KS: 10°, Grand Island, NE: 13°-Tied and Omaha, NE: 21°-Tied. (Ref. Wilson Wx. History) 1998: Hurricane Mitch, the second deadliest hurricane in the Atlantic Ocean, reached Category 5 strength on this day. 2002: The football game between the Richmond Spiders and Rhode Island was suspended due to a flooded field at Meade Stadium in Kingston, RI. The field began to become covered with water during the first half, but a halftime downpour covered the entire field. Water was knee deep on parts of the field and no grass was visible by the time the game was suspended. (Ref. Wilson Wx. History) 2005: The summit on Mt. Washington, NH received an additional 27.5 inches of snow during the overnight to break their 24-hour snowfall record set just 9 days earlier. During the previous 12 days, 72 inches fell, nearly 25 % of the normal yearly total. (Ref. Wilson Wx. History) (Ref. WxDoctor)
-
Lots of mid level clouds here. Still 37.6°
-
46 / 45 dry / nice stretch continues. Overall warmer than normal, warmest Friday mid-upper 70s, with the next threat of rain in the 11/2 - 11/5 period where trough comes east and could yield a few days stuck in the clouds after this nice stretch. Overall near / above normal 11/6 - beyond.
-
looking into November - could be a much more interesting month with a wide range of weather conditions because of this if it verifies :
-
watch us segue from this into a 46/33 mist winter hosting three historic all-time bombs at different times ...all cutters ... wah wah waaaa
-
39.9. Wind stayed up
-

Fall 2026 Med/Long range discussion
BeastFromTheEast replied to Brian D's topic in Lakes/Ohio Valley
Morch-like -
Very wet fall so far for the Southwest. Second wettest October on record for Flagstaff, with another significant storm likely this coming weekend.
-
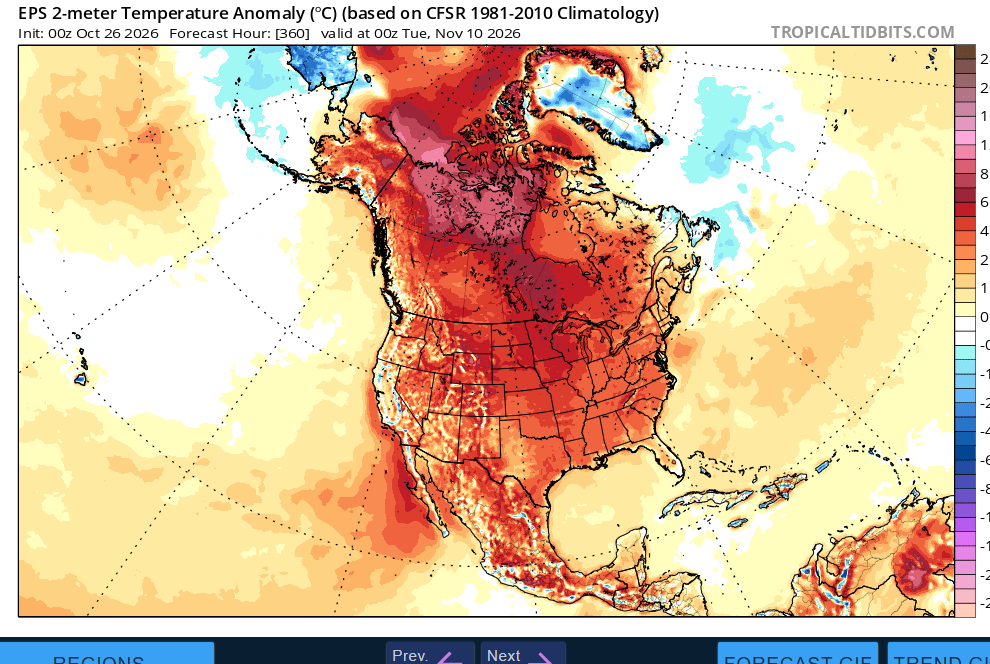
not often you see ensembles in such agreement on hemisphere wide torch
-
October 2026 General Discussion
BeastFromTheEast replied to SchaumburgStormer's topic in Lakes/Ohio Valley
I’ve got a feeling we’re going to see a “Morch 2012” type of torch somewhere in the region these upcoming months. All the ingredients seem to be in place for something historic! -
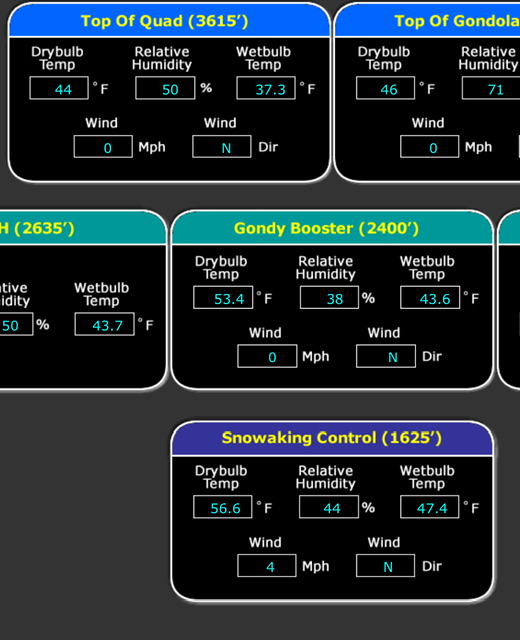
Up to 57F now lol. My drive to work went 38F to 46F back to 34F over 8 minutes and then up to 53F over the next 8 minutes.
-

2026-2027 Record-breaking El Nino
GaWx replied to Stormchaserchuck1's topic in Weather Forecasting and Discussion
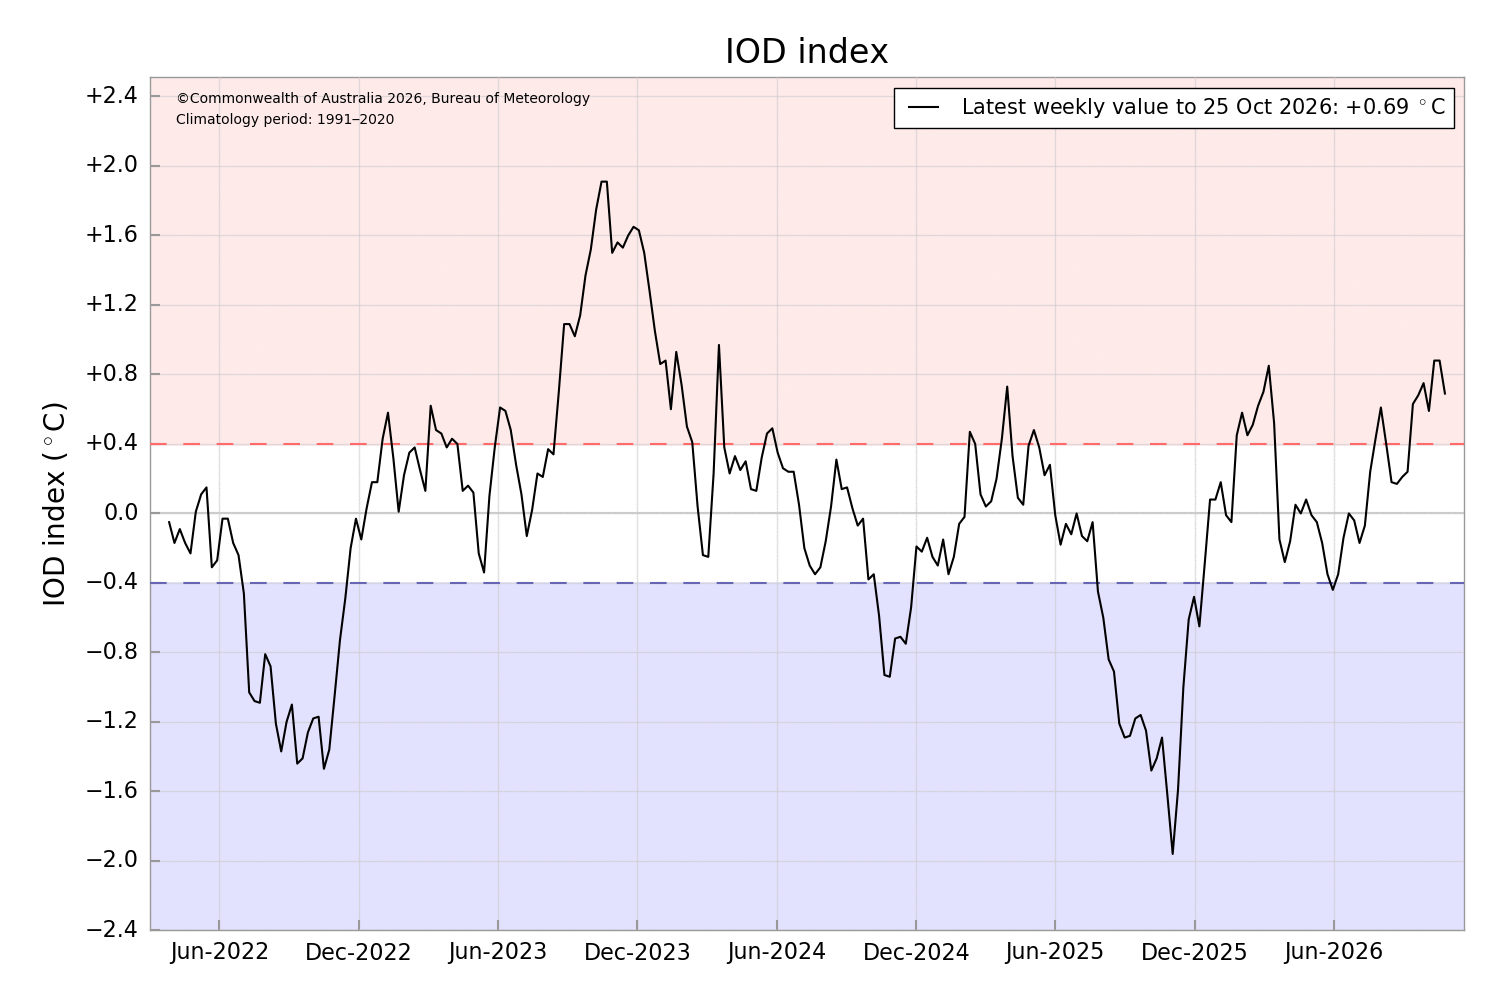
Today’s IOD release (avg for 10/19-25) came in at +0.69 vs the +0.88 of the prior week: 20260831,20260906,0.24 20260907,20260913,0.63 20260914,20260920,0.68 20260921,20260927,0.75 20260928,20261004,0.59 20261005,20261011,0.88 20261012,20261018,0.88 20261019,20261025,0.69 https://www.bom.gov.au/clim_data/IDCK000072/iod_1.txt?1791781094025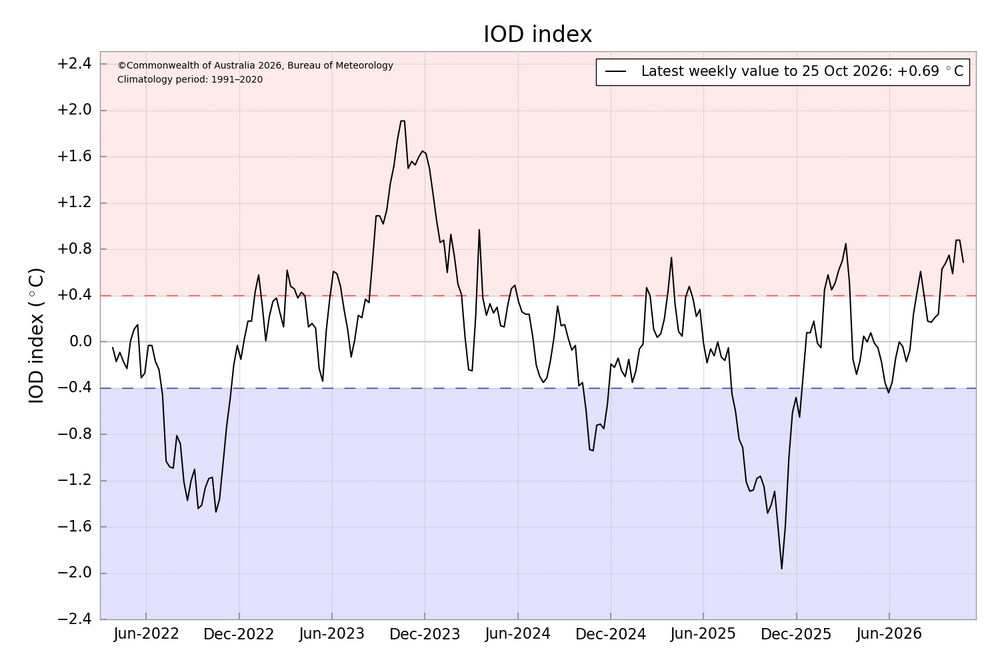
-
October 2026 General Discussion
BeastFromTheEast replied to SchaumburgStormer's topic in Lakes/Ohio Valley
Get used to it, fall/spring shoulder seasons are never going to be the same. Can pretty much extend the summer season a couple of months locally these days. Super early spring and a warm fall is a lock around these parts. Idk how familiar you are with local wx history but you should look up the historic March 2012 heatwave. Endless days of 80s to near 90 in the middle of the month across the MW! 94 in South Dakota on 3/18! The change has been happening long before “Morch 2012“ but it seems like that mega torch was a key milestone where a switch was flipped. -
Last time the Vikings were 6-0 was 2009 that was a good winter...just sayin
-
 reputable indian pharmacies for otc drugs: ZenithIndusRx - order drugs online
 -
Yesterday boasted the grandest diurnal change I've seen 'round deez parts... 44 to 46 F swing was common within 10 miles of my location, both home stations and tweener NWS sites. [EDIT, 38-43 ...helps when you're not looking at WC columns. still impressive] Today may exceed that differential where has this cold drain phenomenon occurred.
-
Probably gonna be a 42-43 diurnal here today
-
Ravens have the 2nd highest paid defense in the NFL Top 10 Most Expensive NFL Defenses in 2026 thesportscast.net Pittsburgh Steelers – $195.4 M (64.9% of cap) Baltimore Ravens – $187.4 M (62.2%) Chicago Bears – $177.9 M (59.1%) New York Giants – $174.7 M (58.0%) New England Patriots – $169.0 M (56.1%) Washington Commanders – $165.8 M (55.1%)
-
Yep about 20 degrees difference between me and Kev as well last 2 mornings.
-
Very foggy this morning. Surprised the statement didn’t stretch to the coast.