All Activity
- Past hour
-

2025-2026 Fall/Winter Mountain Thread
Maggie Valley Steve replied to Buckethead's topic in Southeastern States
Flurries have started at Valley floor. It took a while to saturate enough. -
Arctic Hounds Unleashed: Long Duration Late January Cold Snap
JACKASS replied to WxWatcher007's topic in New England
Very cool! Thanks for sharing!!! -
<<<< FEBRUARY NYC DAILY RECORDS >>>> Note: Max 2d snow is the listed date plus the previous date, so for example 17.4" fell Feb 3-4 1961. Any 2d total with * symbol had all of its snow on the calendar date and zero the previous day. Any 2d total with ** had all of its snow the previous day and none on calendar date of table listing. ... Also, any number in brackets after a Low min record is that day's non-record-low max. R or S after precip indicates whether the value was mostly rain, snow or a combination (RS). Some of those may be snow+sleet. Date _____ High max ____ High min ________ Low max ____ Low min ________ Max prec ___ Max snow ___ Max 2d snow Feb 01 ___ 67 1989 ____ 50 1988 ________12 1971 _____-2 1920 ________2.15 1915R__14.8 2021 ___16.8 2021^ Feb 02 ___ 59 1988 ____ 42 1952 ________ 8 1881 _____-3 1881 ________2.98 1973R__5.0 2015___ 15.2 2021** Feb 03 ___ 64 1991 ____ 46 1999,2006 __16 1917 _____ 0 1955 ________ 1.55 1972R___8.0 2014 ___8.0 2014* Feb 04 ___ 68 1991 ____ 46 1991 ________12 1886 _____ 0 1886,1918 ___ 2.10 1961RS_11.4 1961 ____17.4 1961 Feb 05 ___ 70 1991 ____ 51 1991 ________ 4 1918 _____ -6 1918^_________1.43 2014RS__5.9 1920 ___11.6 1920 Feb 06 ___ 68 2008 ____ 42 1884,1938 __10 1895 _____-4 1895 _______ 2.74 1896R__15.5 1978 ____15.5 1978* (11.3 1920 3d 17.0") Feb 07 ___ 56 2020 ____ 42 1904 ________10 1875 _____ 1 1910 ________ 2.96 1941R__12.5 1967 ____17.7 1978 (15.2 1967) Feb 08 ___ 62 2017 ____ 48 1965 ________ 8 1895 _____ -7 1934 _______ 1.15 2013RS__8.0 1870 ____12.5 1967** Feb 09 ___ 63 1990 ____ 46 2005 ________ 8 1934 _____-15 1934 ______ 1.74 1885R __14.0 1969 ___14.0 1969* Feb 10 ___ 61 1990,2001,2023_ 47 2024* ____ 7 1899 ___-6 1899 _______ 2.63 1970R___10.4 1926 ___15.3 1969 (12.0 1926) Feb 11 ___ 65 1960,2009 _50 1966 ________ 9 1899 _____-2 1885, 99 ____ 2.74 1886R___12.8 1994 ___12.8 1994* (12.5 1983) Feb 12 ___ 62 1999,2018 _ 45 1966 ________ 9 1899 _____-3 1914 (10) ___ 1.66 2006S___24.1 2006___26.9 2006 (17.6 1983) Feb 13 ___ 64 1951 ____ 47 1880 ________11 1899 _____-1 1914 _________ 2.42 1966R___10.7 1899^___16.0 1899 Feb 14 ___ 63 1946 ____ 50 1949 ________12 1916 _____-1 2016 (15) ____ 1.59 1914RS__ 8.1 1914 ____12.5 2014 (9.5+3.0) Feb 15 ___ 73 1949 ____ 49 1984 _________ 8 1943 _____-8 1943 _______2.60 1869R___ 5.4 1922 ____9.0 1940 (7.7+1.3) Feb 16 ___ 71 1954 ____ 56 2023^_______11 1904 _____ 1 1888 __________ 1.40 1885R___ 9.9 1996 ____9.9 1996* Feb 17 ___ 68 2022 ____ 49 2022 _______ 7 1896 _____-5 1896 ________ 1.49 2003S__16.3 2003____19.8 2003 (10.7 1996)^ Feb 18 ___ 68 1981 ____ 48 1981 ________16 1958 _____0 1979 (13,17 17th-18th)_1.50 1887R__3.5 1928 ___16.3 2003** Feb 19 ___ 66 1997 ____ 53 2017 ________16 1903 _____ 1 1936 (18) ____ 2.15 1908RS_ 12.7 1979 ___12.7 1979* Feb 20 ___ 69 1930,39__48 1939 ________16 1885 _____ 2 2015 (19) ____3.07 1898R^__ 12.5 1921 __ 12.7 1979** (7.6" 1934 4,9+2.7) Feb 21 ___ 78 2018^____55 2018 ________17 1870 _____ 4 1896 _________ 1.86 1902RS__ 8.0 1929 ___12.5 1921** _ (9.2 1929)^ Feb 22 ___ 69 1997 ____ 46 1996 ________21 1963 _____ 8 1918, 63 _____2.39 1878R___ 6.0 2008 ___6.0 2008* Feb 23 ___ 72 1874 ____ 55 1985 ________19 1873 _____ 5 1889 _________1.38 1928R___4.8 1972 ____ 5.8 2001 (5.5+0.3) Feb 24 ___ 75 1985 ____ 58 2017 ________10 1894 _____-1 1873 ________ 1.69 1977R___6.0 1907 ____ 6.0 1907* Feb 25 ___ 75 1930 ____ 51 1930 ________16 1934 _____ 1 1894, 1914 ___ 2.11 1916R___9.4 2010 ____ 9.4 2010* Feb 26 ___ 65 1890 ____ 49 1976 ________19 1900 _____ 7 1928, 1990 __ 1.87 1929R__11.5 2010 ____20.9 2010 (9.3" 1934 3.7+5.6) Feb 27 ___ 72 1997 ____ 49 1976 ________18 1886 _____ 5 1900 _________ 1.56 2013R___4.0 1873 ____11.5 2010** (8.9" 1991 8.4+0.5) Feb 28 ___ 67 1976 ____ 47 1903,10,2017 _ 19 1875 _____ 5 1934 _________ 1.21 1910R___ 9.0 1949 ____9.0 1949* Feb 29 ___ 69 1880 ____ 47 1896, 2016 __12 1884 _____ 4 1884 _______ 2.26 1896R___ 1.1 1968 ____ 5.0 1884** -- - - - - - - - - - - -- ^ 1st _ 2021 snow broke record of 9.8" (1934 -- which was a one-day snowfall event). 5th_6th ... probably very cold with some snow in 1855 *10th _ new record high min 45F 2023 broke 43, 1999; in 2024, 47F broke 2023. 13th _ The 2d 1899 snowfall in this data base may be recorded as a one-day 16.0" in other data bases, here it is broken down to 5.3" 12th and 10.7" 13th. 16th _ New record high min 56F 2023 prev rec 44F 2002 17th _ Also 2d totals of 9.6"(6.3+3.3) 1903 and 9.1" 17th-18th (7.1+2.0) 1893 (these may appear as one-day totals of same amounts in other data bases). Also, 17th max temp 68F 2022 replaced 67F 1976. high min 49F 2022 replaced 46F 1981, 2011. 19th_ 1908 prec record included 4.3" snow 20th _ also 2.68" (unknown amount rain and 12.5" snow) 1921. 21st _ also 68 max in 1930 ... also 2d snow 10.7" 1947 (4.2+6.5) ____________________________________________________________________________________
-
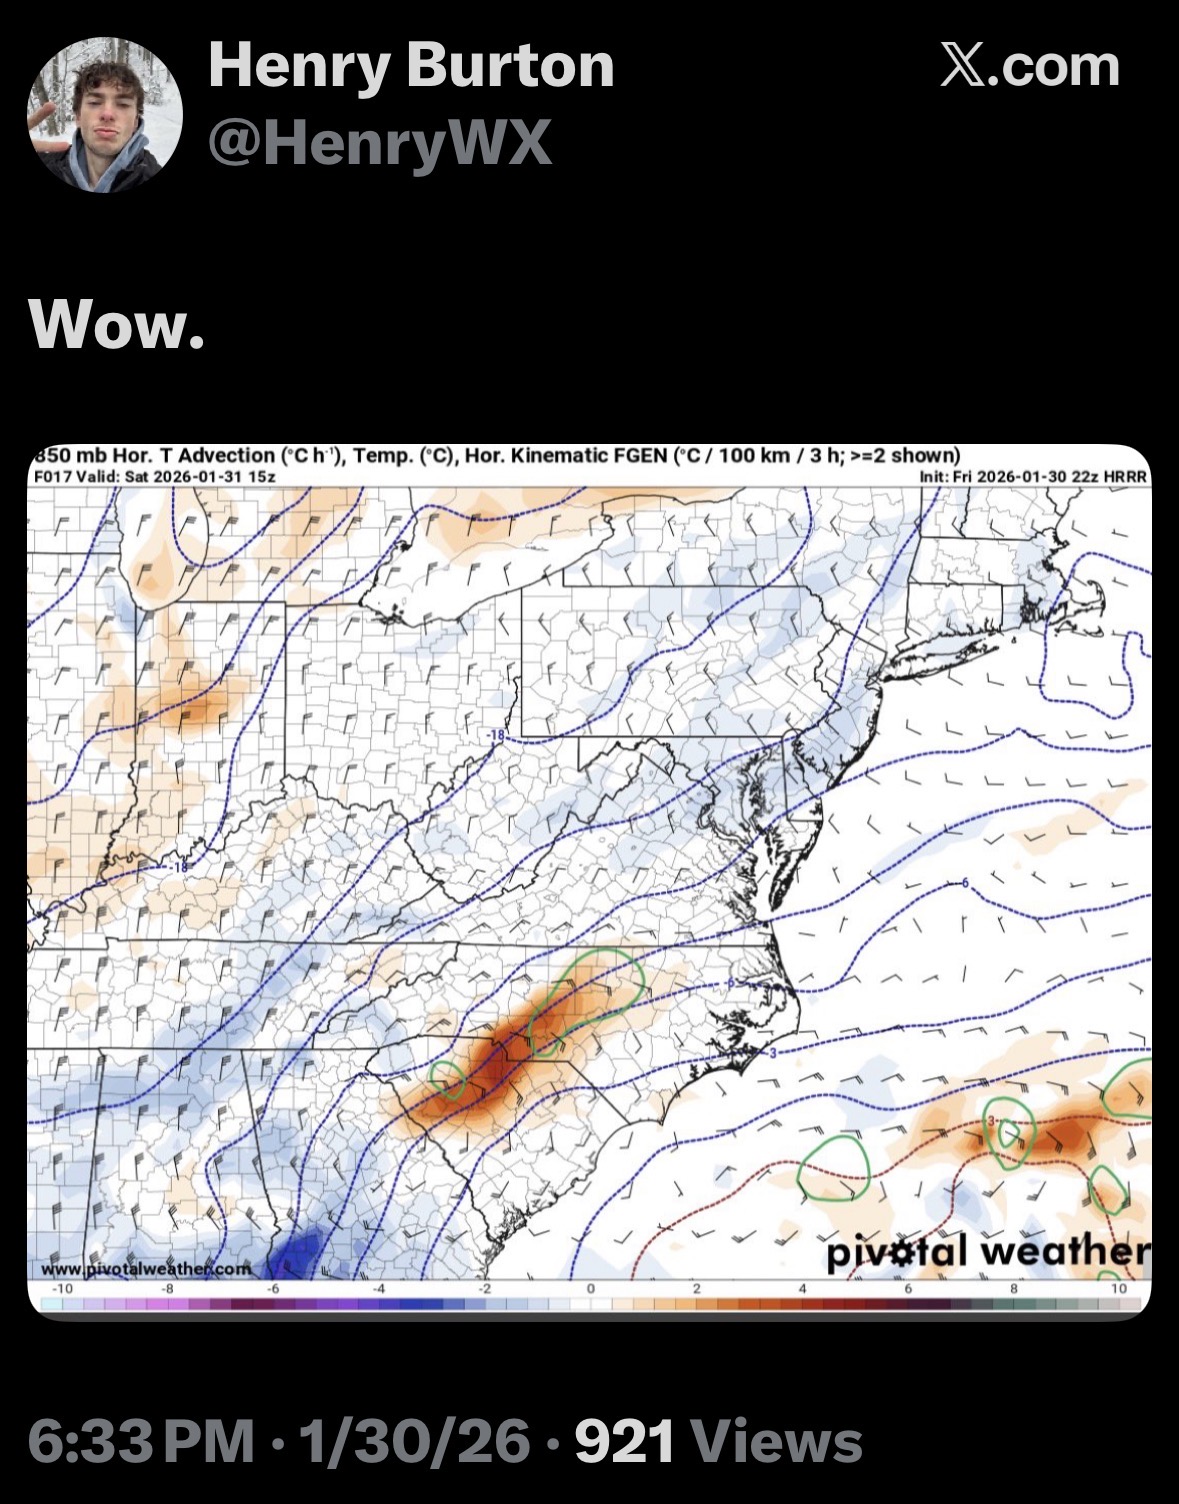
The “I bring the mojo” Jan 30-Feb 1 potential winter storm
Aleksey replied to lilj4425's topic in Southeastern States
It doesn’t show me under your name. I’ll have to update my settings. For some reason it’s not letting me log in, but I can reply and post? I’m not sure. I used to live in Grand Rapids, MI for 5 years prior to coming back home and now I’m back in Winder. Saw the heaviest snow of my entire life up there. We averaged about 75” per winter up there and it became so old so quick. Southern snow is so much more exciting lol but tomorrow’s snow will be like the snow I was used to. Toccoa is sitting very pretty for tomorrow! I think they could see the most along with Athens and Winder in the top 3-5 for totals in the state. . -
For South Florida even modeled snow is crazy.
-

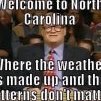
January 30th- Feb 1st ULL and coastal storm obs
Regan replied to JoshM's topic in Southeastern States
Can anyone comment on this?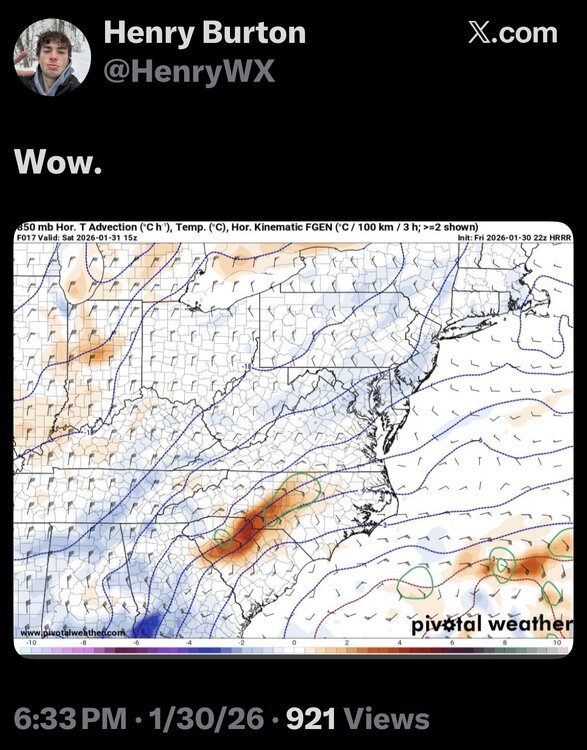
-
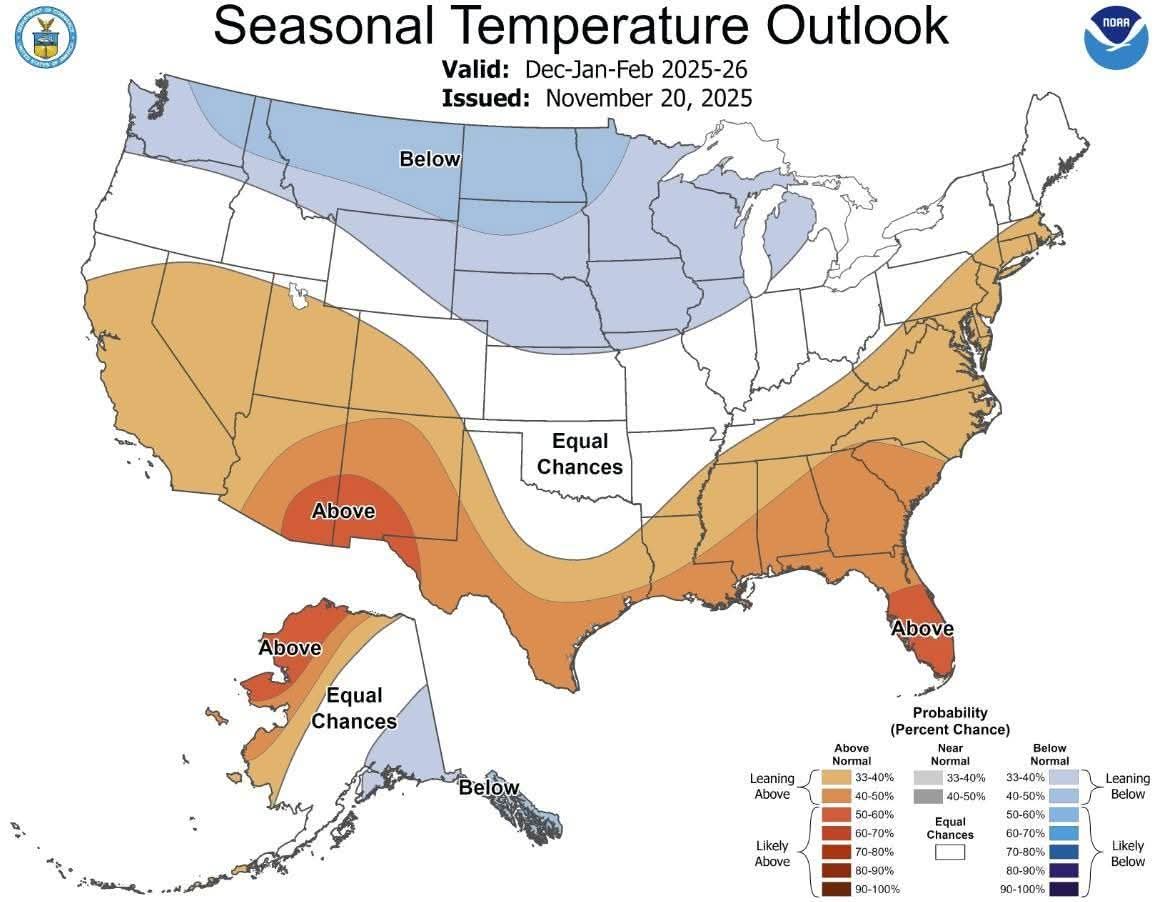
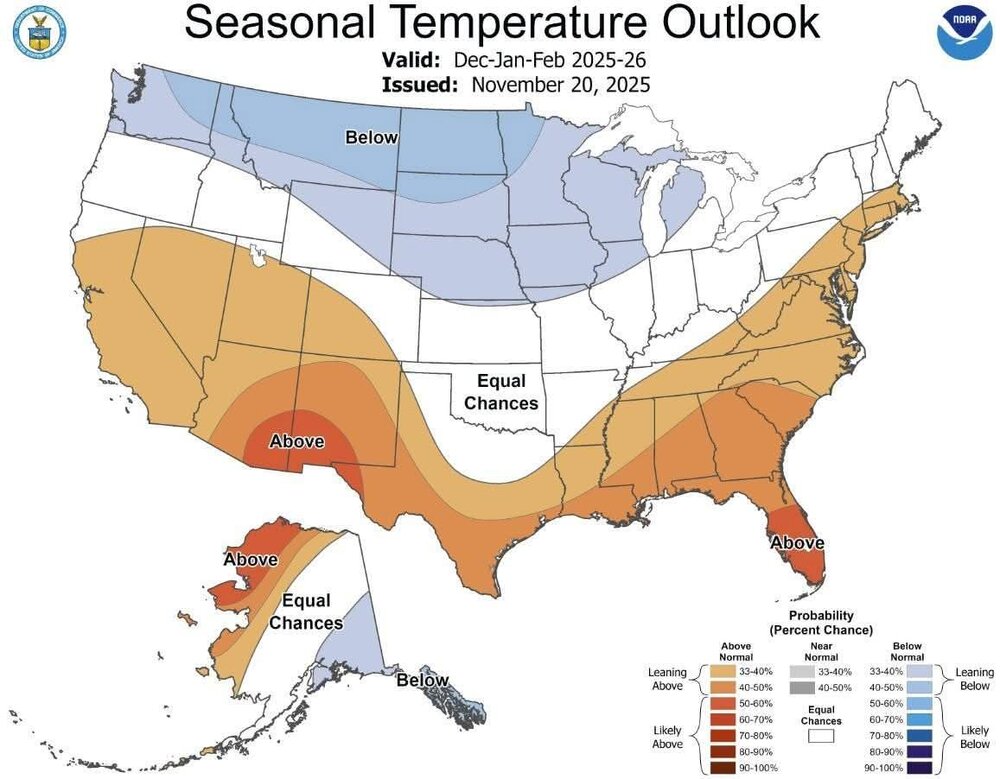
Temp outlook fetish
-
Second year in a row they busted

-
That storm broke my 10 year streak of no snowfalls over 5 inches IMBY. And yes, that’s pure snow, I’m not counting the sleet for that. Got about 7 inches of snow and then 3/4 inches of sleet. So for that, I am thankful! Still having trouble wrapping my mind around the fact that I went 10 years without experiencing a 6+ inch snowfall.
-

February 2026 OBS & Discussion
[email protected] replied to Stormlover74's topic in New York City Metro
2015 like February, incoming? -
Fail

-
This forecast was a bust. They also busted last year.
-

Jan 30th-February 1st 2026 Arctic Blast/ULL Snow OBS Thread.
Tucker1027 replied to John1122's topic in Tennessee Valley
Good vibes only Jeff! . -

2025-2026 Fall/Winter Mountain Thread
franklin NCwx replied to Buckethead's topic in Southeastern States
I have the vodka out! Still waiting on the first flakes! -
Foothills weather folks still think the leeside could get 3 inches they are seeing more dry air and dont trust the models. Not sure what they are "seeing" dont think they do balloon launches.
-

Possible coastal storm centered on Feb 1 2026.
CoastalWx replied to Typhoon Tip's topic in New England
That would piss me off lol -
 Starting to get some good rates now. Solid dusting.
 -

Jan 30th-February 1st 2026 Arctic Blast/ULL Snow OBS Thread.
Reb replied to John1122's topic in Tennessee Valley
Yup reinforcements are coming animated.mov -

Jan 30th-February 1st 2026 Arctic Blast/ULL Snow OBS Thread.
GBOVolz replied to John1122's topic in Tennessee Valley
Hate it we can’t post videos . -
Jan 30th-February 1st 2026 Arctic Blast/ULL Snow OBS Thread.
GBOVolz replied to John1122's topic in Tennessee Valley
. -

January 30th- Feb 1st ULL and coastal storm obs
Grayman replied to JoshM's topic in Southeastern States
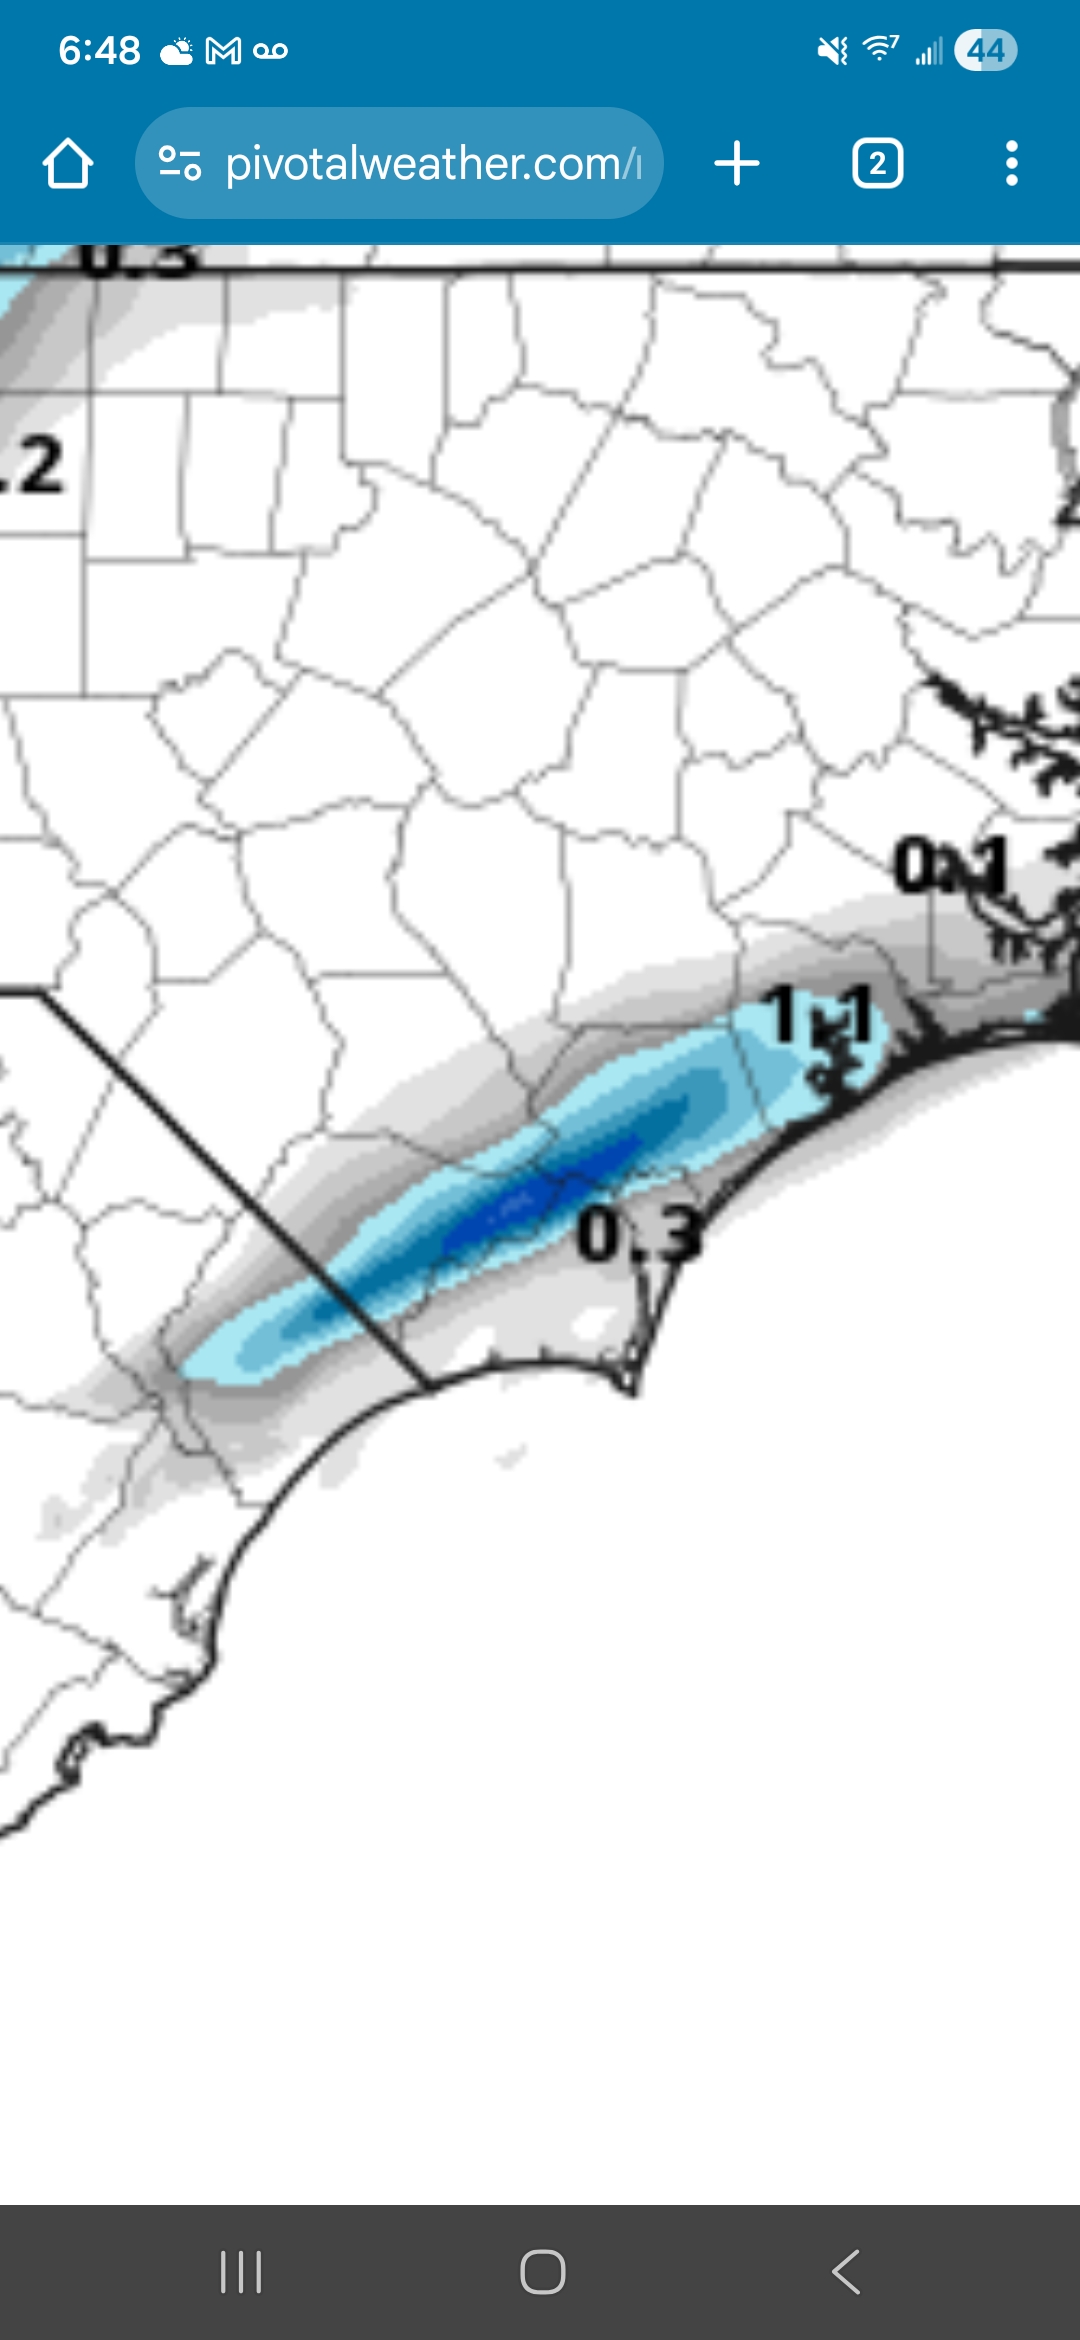
Is anyone surprised by the radar returns that are lightened up south and west of NC? -
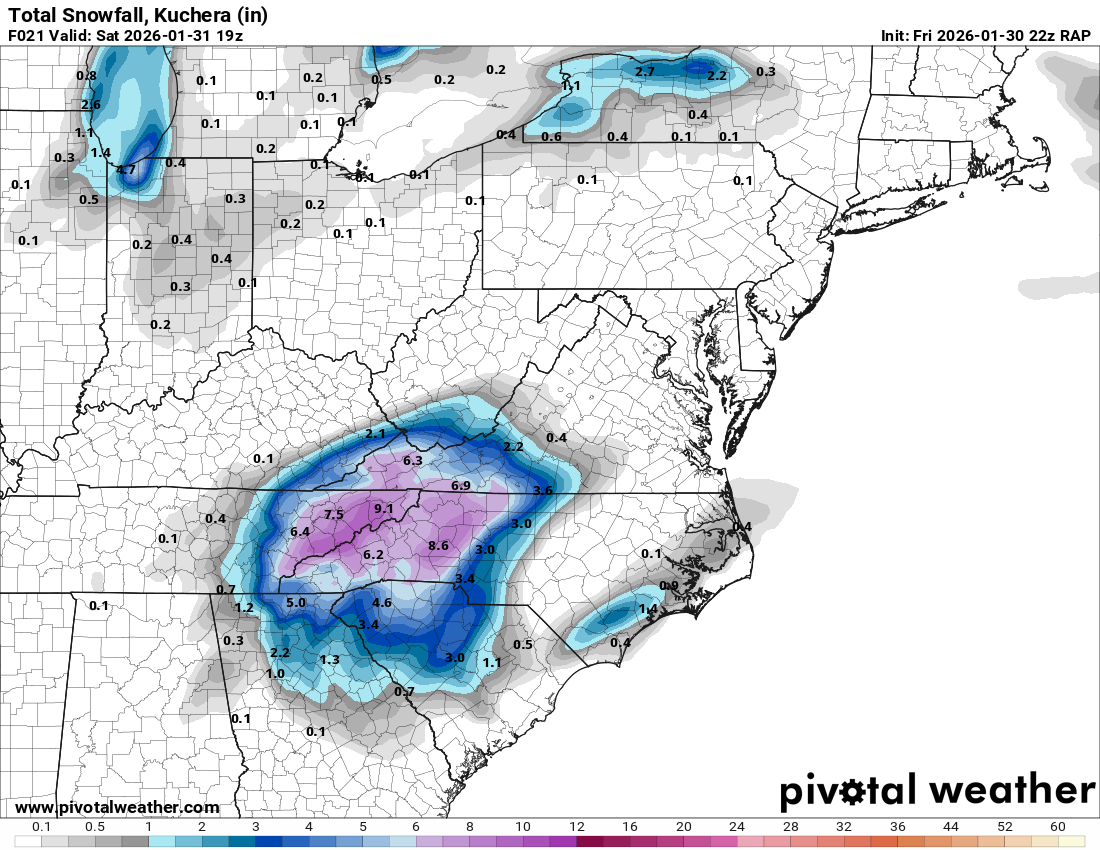
Latest RAP has almost 9" in HKY by 2 p.m!! Still a lot to go after that!! This thing is looking good!

-
Arctic Hounds Unleashed: Long Duration Late January Cold Snap
CoastalWx replied to WxWatcher007's topic in New England
Yore -
They are hyping a microscopic spec of blue on the Nam 3km
-

The “I bring the mojo” Jan 30-Feb 1 potential winter storm
Ravens94 replied to lilj4425's topic in Southeastern States
HRRR has a skinny stong band along the coast tonight near me. We will see if this pans out