All Activity
- Past hour
-
I would caution this does not always work well. June 2, 1990 has a big tor outbreak in the Great Lakes/Midwest/OH Valley w/ IN getting absolutely crushed w/ 37 tor in the state (more than the 1974 Superoutbreak). 66 tor in this event w/ 7 F4s, and forecasts were big for NY/PA and New England for June 3, and a complete bust. https://en.wikipedia.org/wiki/June_1990_Lower_Ohio_Valley_tornado_outbreak
-

2026-2027 Super El Nino
forkyfork replied to Stormchaserchuck1's topic in Weather Forecasting and Discussion
our willpower is working -
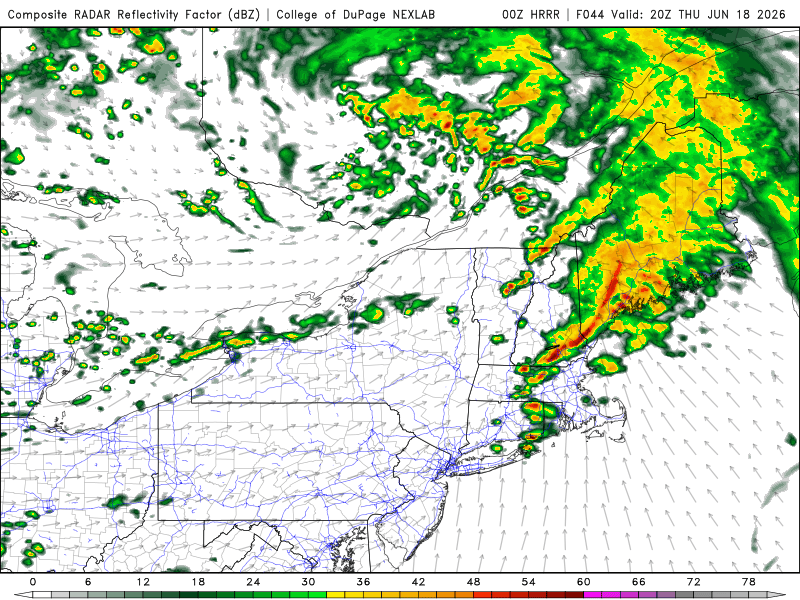
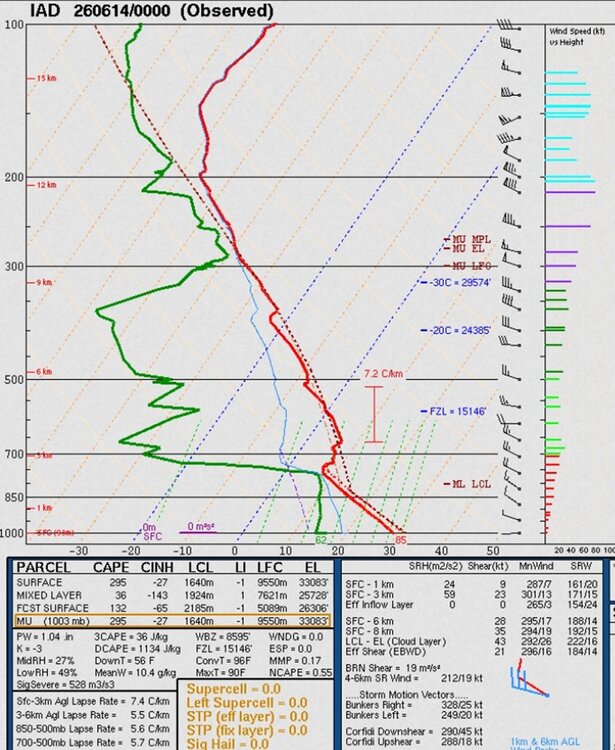
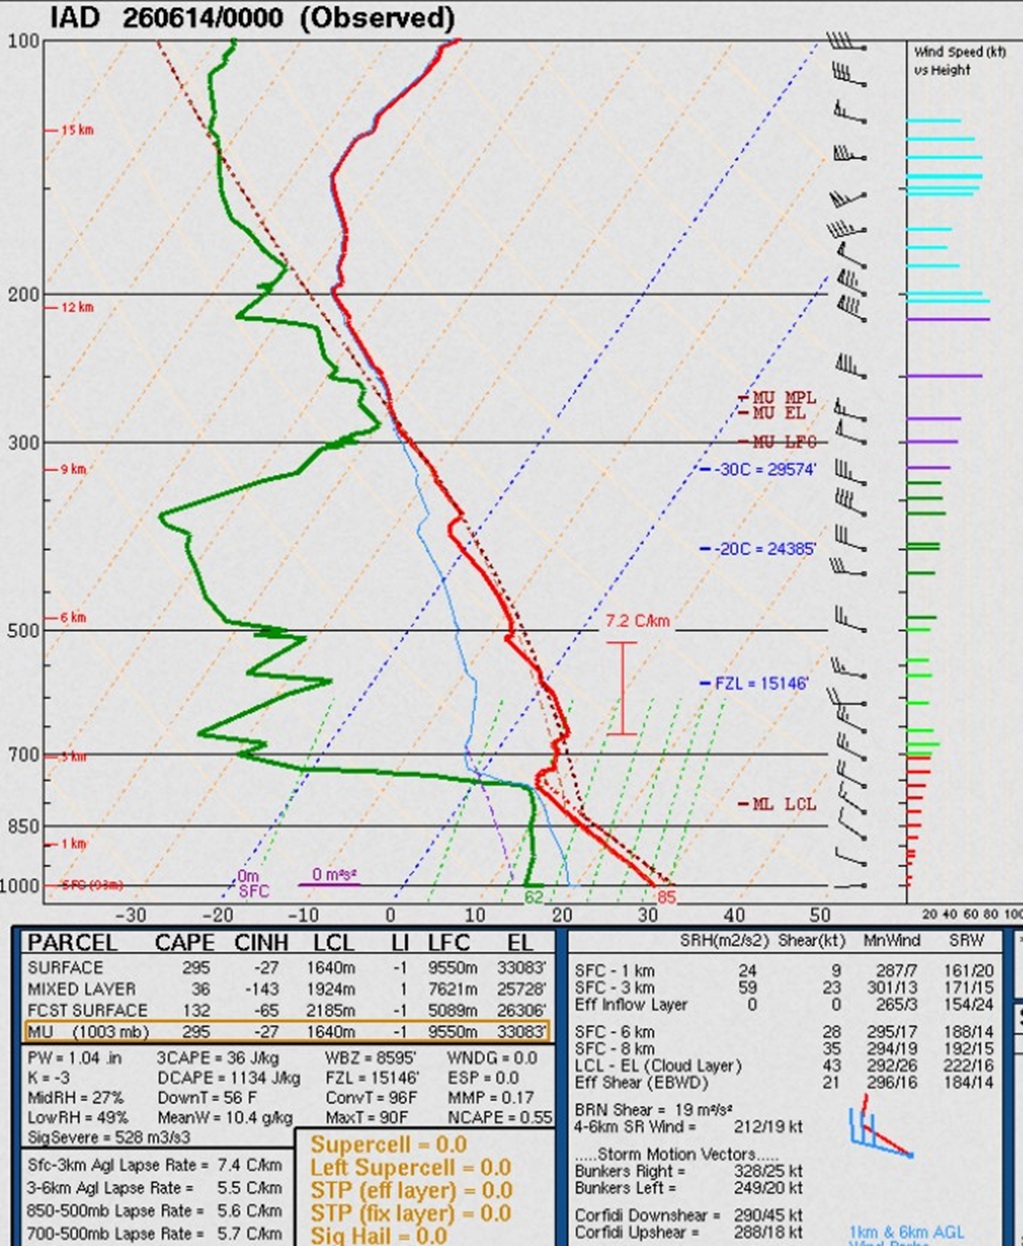
Timing is ideal and HRRR/RRFS show decent cells/lines! CBs in that kind of shear are likely going to do "something." I put it this way, "to have such a deep sfc low move over srn Quebec w/ those kinds of warm sector wind fields in June?, prove it to me something big will not happen!" We do not have set ups like this very often, so the full range of what can happen we really don't know. And this set up odd in itself b/c through the roof shear and low CAPE, but it not during the cool season! One thing about EMLs. 700-500 *only* can be misleading. Take a look at the IAD sounding 00z 6/14 I attached. 700-500 is crappy at 5.7 C/km, but compress that layer just a bit, and the max is 7.2 C/km...EML! I needed to inform CoastalWx about this, and he learned something new today!
-
That would reverse jinx a monster F4 cruising just south of the tower.
-

2026-2027 Super El Nino
Stormchaserchuck1 replied to Stormchaserchuck1's topic in Weather Forecasting and Discussion
^I can never get U of Del Air Temp working on the correlation composite. Is there a secret to it? June will likely be the 5th straight month of -PNA (CPC). I've found that the correlation roll forwards are weak for what happens later in the year, surprisingly. -
That's the issue w/ AI models. They can't handle outlier events or set ups well, so they underdo things. Also, AI overdoing it is possible as you noted above. No a one-side problem I bet (non-linear factors). I keep hearing, "AI will get better." Well, isn't that the case for all types of modelling w/ time? And the notion that AI is improving so fast acting like it will solve all problems? All the AI advancement in the world is meaningless if you don't have many outlier events/analogs for it to pull from! And since outlier events are rare, progress in AI forecasts should be very slow. I would argue physics-based models will advance faster as they improve w/ time and in situ/remote observations get better globally for improved model initialization.
- 767 replies
-
- 1
-

-
- severe
- thunderstorms
- (and 7 more)
-
In any given situation, the worst-case scenario is the least likely to happen in the mean. The notion, "better safe than sorry" is a weasel line to give an excuse to always go w/ the worst-case scenario. Also, "we are saving lives!" Forecasts and awareness has become so good in recent decades, one can't hide behind that as an excuse anymore. Lives are lost now more IMHO b/c people have become numb and apathetic to the relentless hype. They have no idea what to believe, so many just tune it all out. That ends up costing lives when a truly exceptional event (worst-case) occurs, and it's made even worse b/c the exceptional events are greatest risk to lives. I admit though this is an extremely complex social issue, among other things, and no easy way to figure out what works best. One thing i will stand by solid though. "more [warnings/alerts} is not always better!"
-
- Today
-

2026-2027 Super El Nino
raindancewx replied to Stormchaserchuck1's topic in Weather Forecasting and Discussion
For anyone wondering - June is a pretty canonical -PNA pattern so far. Not PDO or ENSO driven. Despite the rumor that +PNA = +ENSO, it's never really been true in the Summer. CPC has the PNA as so weak in the Summer that is just has -- for PNA correlations to ENSO - not 0, not -0.87 or +0.33 actual blanks. https://psl.noaa.gov/data/correlation/table/corr.table_jun.txt -PNA June = Cold NW, Hot SW. Green on the lower map is positive correlation (-PNA = cold, +PNA = warm) while blues are opposite correlation (-PNA = warm, +PNA = cold). You can see the neutral spot over the Southeast shows up as well. -
Snowfall measuring practices were not completely standardized until the mid 1990s, even for long-term climate sites, and NYC is not immune to this issue. I think I have said this before, but generally, snowfall was underestimated prior to the NWS MAR in the 1990s. Some sites would only measure new snow *depth* once the storm was done, and call that the total. Other would melt a column of SOG, and then multiple by 10 for the snow total (blasphemy for the uber weenies!). Of all primary wx measurements we do, snowfall is by far the most inaccurate and variable in our record. Even today, there are fundamental challenges that make it hard at times to get an actual accurate amount.
-
Just call in sick. No one will suspect a thing.
-
North of I-70 usually does well. My area down here gets split a lot. There have been many times I am watching radar and it crosses over 340 splits in my area and then the line reconnects to my East near 270.
-
Sure. But I can still look forward to Fall. Summer sucks if its going to be a veritable desert.
-
That 34" in NJ. That's only, what, 1" from the record for the state set in the Bliz of 96? Blasphemy the 1947 event is called "Boxing Day Blizzard," at least for Scott. All he ever talks about is the 2010 blizzard for Boxing Day! LOL.
-
I don't know whats gonna happen tomorrow but almost everything thats come through behind that quick line of precip around 2pm has been full on hook and ladder. I don't think I've seen so many wall clouds at once. I mean every updraft was spinning out of the gate. I watched 5 wall clouds and one funnel without moving lol. Crazy stuff.
-
Temperatures will again top out in the middle to upper 70s tomorrow. It will then become somewhat warmer to conclude the week. A shower or thundershower is possible on Thursday No heat appears likely through at least June 25th. The ENSO Region 1+2 anomaly was +2.6°C and the Region 3.4 anomaly was +1.3°C for the week centered around June 3. For the past six weeks, the ENSO Region 1+2 anomaly has averaged +1.95°C and the ENSO Region 3.4 anomaly has averaged +0.98°C. The ongoing El Niño will continue to strengthen through the summer. The SOI was -3.30 today. The preliminary Arctic Oscillation (AO) was +0.250 today. Based on sensitivity analysis applied to the latest guidance, there is an implied near 78% probability that New York City will have a warmer than normal June (1991-2020 normal). June will likely finish with a mean temperature near 74.1 (2.1° above normal). Supplemental Information: The projected mean would be 2.7° above the 1981-2010 normal monthly value.
-
in this case, not any specifics, but I’m better than 50/50 that cool ‘potential’ before the end of June, we are in back below normal, is subjected to being modified ….how much so remains to be seen… And that bigger heat’s likely returned by July 1 … which means it could even be earlier
-

Junorch obs and discussion 2026
Damage In Tolland replied to Damage In Tolland's topic in New England
ACATT -
I saw a truck with "f* summer" decal -snowmobile and skidoo on opposing side...surely someone who posts here
-
And you're confident at 360 hours?
- Yesterday
-
Lol well, I’m not in any kind of troll fight between you two I’m just trying to clarify what I’ve already said many times too, about those probability charts, but everybody keeps posting them like it’s a colder than normal outlook. He may not have intended that just makin sure .
-
Could have only said the bolded
-
2026-2027 Super El Nino
LakePaste25 replied to Stormchaserchuck1's topic in Weather Forecasting and Discussion
More like I want the W pac warm pool to completely shift east so we can have better synoptic snow the following winters. A mid +2c super nino that probably ends up with a warm winter anyway won’t do the job. Might as well go for the full historic, make this the sacrificial lamb and see if we can get good patterns the years after -
Junorch obs and discussion 2026
Damage In Tolland replied to Damage In Tolland's topic in New England
The cool charts have been wrong all spring/ summer. Right now Junorch is top 3 warmest in his area of Boston . He was posting blue BN maps everyday lol -
You sound far too certain of that for 222 hours out Also keep in mind those are probability charts are not actually cooler than normal in the scaler sense It’s telling you, there’s a low chance for cooler than normal and it doesn’t say how much cooler is normal either


.thumb.gif.f92b16c631a1d15d405ed77b33f0710d.gif)

