All Activity
- Past hour
-

Spooky Season (October Disco Thread)
weatherwiz replied to Prismshine Productions's topic in New England
Tropical isn't really a high knowledgeable area of mine, but I thought coming into the season it wasn't going to be a hyperactive season just going off the basics. I think sometimes with this advance in technology and models there is too much infatuation with models and their outputs. Reading the seasonal outlooks from NOAA/Colorado, they always mention how simulations are ran hundreds or thousands of times...sometimes you just have to use the basics and knowledge. -
Clarksville and Layhill, both shallow sites, reached 36. Only briefly though.
-

-
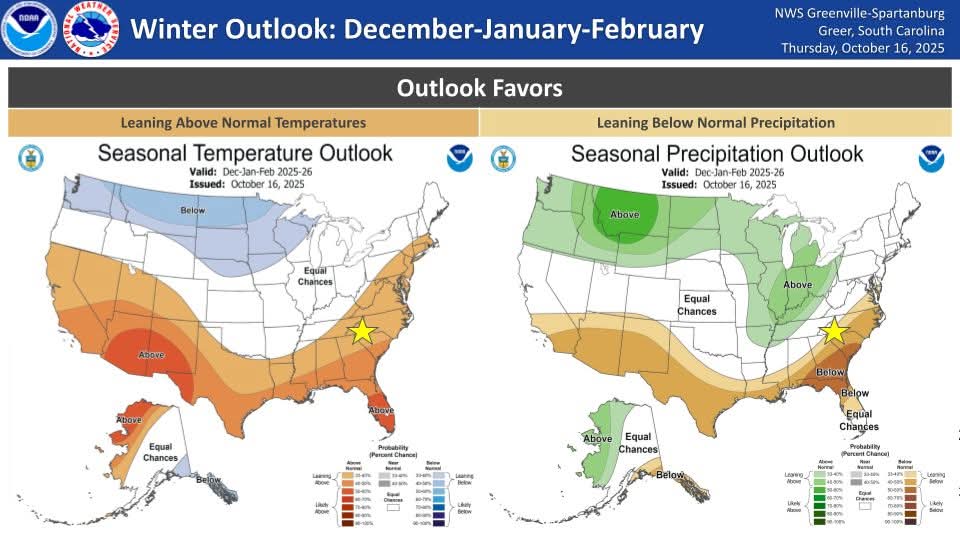
NOAA has spoken
-

Central PA Fall Discussions and Obs
canderson replied to ChescoWx's topic in Upstate New York/Pennsylvania
What’s wrong with you -
This is one heck of a front, dynamics look great, just need moisture.
-

Occasional Thoughts on Climate Change
Typhoon Tip replied to donsutherland1's topic in Climate Change
https://phys.org/news/2025-10-climate-uk-2c.html -
Wow! You think someone would tell me if these things are happening but I find out from here. Thanks for forwarding on!
-
Pretty sure the record is closer to mattingly or jordan….
-

Spooky Season (October Disco Thread)
dendrite replied to Prismshine Productions's topic in New England
Well it was precipitating. The airport ASOS had a brief period of reported snow between the rain obs. The temp was around 37-38 at the time. My skepticism was whether or not it was actually snow of if was just cold rain and the instrumentation was reporting snow in error. Sometimes they do that with marginal temps and light precip. Vis only got down to 8-9 miles too. -

Spooky Season (October Disco Thread)
kdxken replied to Prismshine Productions's topic in New England
Seven! -
SPC is monitoring Day 4-8 Convective Outlook NWS Storm Prediction Center Norman OK 0347 AM CDT Thu Oct 16 2025 Valid 191200Z - 241200Z ...DISCUSSION... ...Sunday/Day 4 and Monday/Day 5... A large-scale mid-level trough and an associated cold front are forecast to move through the Ohio and Tennessee Valleys on Sunday. Thunderstorms will likely be ongoing across the central Gulf Coast states and Tennessee Valley at the start of the period. This convection should have a negative impact on instability across the much of the moist sector during the day. In areas that are not impacted, weak instability is forecast to develop ahead of the front from Georgia and the Carolinas into the central Appalachians. The instability combined with strong large-scale ascent and moderate to strong deep-layer shear will likely result in a severe threat. A potential for wind damage and a few tornadoes will be possible. At this time, uncertainty is substantial as to exactly where the greatest severe potential will occur. As new runs come in, an upgrade to Slight may be needed. A mid-level low is forecast to move across the Northeast on Monday, as the associated trough moves into the western Atlantic. Thunderstorms with an isolated severe threat will be possible in parts of southern New England during the late morning and early afternoon before the front moves offshore.
-
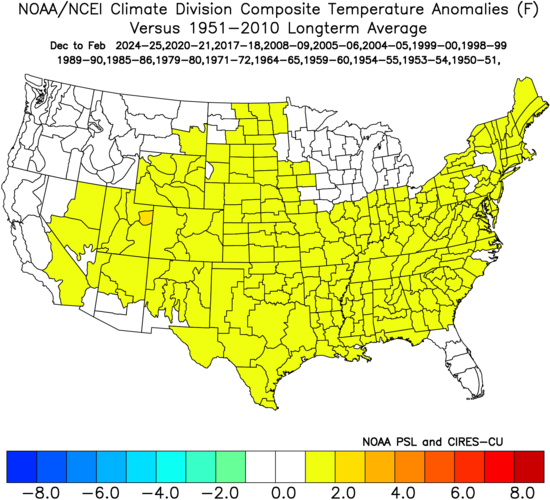
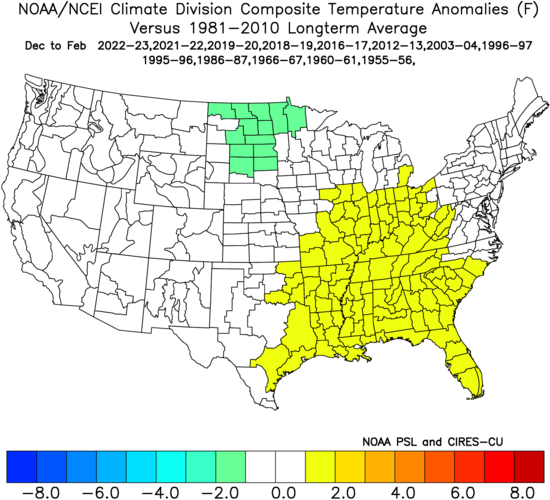
As I showed yesterday, seasons with no H hits on the Conus have shown no notable signal one way or the other for the subsequent winter temperatures. What about the other extreme, winters after seasons with 3+ Conus H hits since 1950? 17 winters: 2024-5, 2020-1, 2017-8, 2008-9, 2005-6, 2004-5, 1999-00, 1998-9, 1989-90, 1985-6, 1979-80, 1971-2, 1964-5, 1959-60, 1954-5, 1953-4, and 1950-1. Here’s their average using climo of 1951-2010: slightly mild but that’s likely a little too warm considering that 3 are post-2010 What about winters after seasons right at the 2 Conus H hit average since 1950? 13 winters: 2022-3, 2021-2, 2019-20, 2018-9, 2016-7, 2012-3, 2003-4, 1996-7, 1995-6, 1986-7, 1966-7, 1960-1, and 1955-6. Here’s their average using climo of 1981-2010: mainly slightly warm to near normal but I’d rather call it near normal overall considering that 1981-2010 climo is slightly too cool being that 6 of the 13 are post-2010 and only 3 are pre-1981 —————— Also, maps for winters following the 29 seasons with exactly one Conus H hit came out right at normal everywhere. ———————— So, to summarize the maps for winters following Conus H seasons with 3+, 2, 1, and 0, the differences are pretty small. Thus there’s little signal one way or the other for winter temperatures based on the # of US conus H hits of the prior season.
-

Spooky Season (October Disco Thread)
CoastalWx replied to Prismshine Productions's topic in New England
And sort of the opposite to a little dry air entrainment in a hurricane, one moist or liquid ppffffffffftttttttttttt can throw off the whole thing. -

Spooky Season (October Disco Thread)
tamarack replied to Prismshine Productions's topic in New England
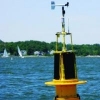
There are echoes overhead there, and it's at 47.3° lat. and 985' asl. Their average date for first flakes is probably about now. (Unfortunately, the airport apparently doesn't report snow.) -
I can't reveal too much, as the final decisions lie with the national author. But from the state climate office side, we suggested mostly status quo (no change) this week, aside from removing some lingering D0 in eastern Ocean (warranted with the heavy rain from the nor'eater). They also eased up a bit in Bergen and eastern Passaic, which is fine too given the 1.50"-2.00" rainfall there, as we were on the fence about recommending improvement there or waiting. As for the areas of degradation in the western parts of the state, it's really just slight expansions of existing D0 (in Burlington) and D2 (in the far northwest), which we didn't explicitly suggest, but have no problem with given the continued dry conditions and relatively low totals from the weekend storm. Very minor changes overall. If you haven't yet, I'd recommend checking out the comparison slider, as it nicely shows the specific category changes from last week to this week. You can zoom into NJ: https://droughtmonitor.unl.edu/Maps/ComparisonSlider.aspx
-
2025 Lawns & Gardens Thread. Making Lawns Great Again
tamarack replied to Damage In Tolland's topic in New England
Our 20-foot-tall sapling is mostly changed. The 90-foot by 24" specimen is just beginning to turn. -
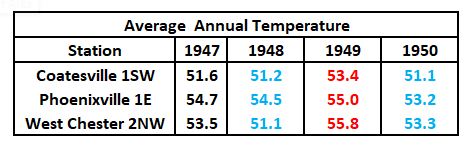
@chubbs Actually Charlie there is total agreement across the 3 stations for those 1948-1949 station moves. Like you said this is easy with the actual data to see the real impact of any station moves. Unlike what you said above we did not see cooling after the station move! The first full year (1949) after the Coatesville move away from what you think was a UHI location - actually saw Coatesville warm by 2.2 degrees and not cool when moving away from the "heat island". As you can see below red is warmer changes and blue is cooler changes in annual temperatures. Perfect agreement as all stations warmed in 1949 following the Coatesville station move and cooled in a similar rate in 1950.
-
Schumacher actually has much of the area in 15% for Sunday. https://schumacher.atmos.colostate.edu/hilla/csu_mlp/csu_severe.php?date=20251016&version=2021&day=4&product=severe_ml_day4_gefso&day_str=1020&init=00
- 1,355 replies
-
- 1
-

-
- severe
- thunderstorms
- (and 2 more)
-
Overcast this morning with mid level stratus. Looking forward for some rain today. Been a lean month so far.
-
I've got my eyes on Dec & Feb for potentially being on the colder side.
- Today
-

Central PA Fall Discussions and Obs
WmsptWx replied to ChescoWx's topic in Upstate New York/Pennsylvania
Highs next week in the low to mid 50s. I am not ready for sweatpants and hoodie season. -
Literally
-

Texas 2025 Discussion/Observations
aggiegeog replied to Stx_Thunder's topic in Central/Western States
I expect near normal winter temps interspersed with significant Arctic blasts. Overall dry but with wet spells when the PNA trends more neutral. Hopefully we can get a couple -EPO/=PNA pairings through the winter. -

Spooky Season (October Disco Thread)
WxWatcher007 replied to Prismshine Productions's topic in New England
At the end of the day I think my peak season forecast will be ok, but some underperformances really hurt me near the end. That’s how it goes. It’s still disappointing. Was surprised there was no major threat. If not for Humberto, Imelda would’ve been a hit in the Carolinas. Yes, SSTs and OHC are only part of the equation.


(002).thumb.png.6e3d9d46bca5fe41aab7a74871dd8af8.png)


