All Activity
- Past hour
-

2025-2026 ENSO
Stormchaserchuck1 replied to 40/70 Benchmark's topic in Weather Forecasting and Discussion
I wonder if the Stratosphere warming forecast is going to stay so strong going into the last week of November, with models tonight taking away the -NAO in the long range. Here's the 1989/2005-analog pattern with weak-negative ENSO and strong -QBO. This is for Nov 28, based on tonights 0z GEFS -
Good news and bad news The bad news is, models took away the prolonged/sustained west-based -NAO that it had been showing, the last few runs. The good news is, around the turn of the month they are developing a strong -WPO pattern with +PNA underneath of it -- a Pacific based cold pattern that should put much of the CONUS below average to start off December 0z GEFS mean hr384
- Today
-
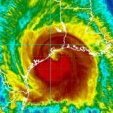
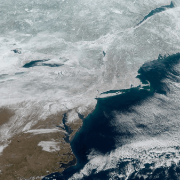
Modeling is now indicating 5 inches of liquid over the Sierra with the incoming system but there is going to be a ton of warm air as well, most of this is going to be heavy wind whipped rain, except at elevations above 9,200 feet. The highest peaks well above 9,200 feet are expected to eke out a foot of slushy wet slimy potato type snow paste ugh. We may well be facing a Sunday River, Maine ski resort type of scenario here, with so much rain that entire ski runs get carved out several feet deep in the rocky soil from so damn much rain. The weather system is expected to slow down greatly enabling warm air to persist longer causing heavy rains to last longer piling up rain tallies. Immense amounts of the rain waters will rush down into the valleys causing freezing cold flooding issues for travelers and residents alike. EDIT 10.32pm PST, which is 12.32am here in TX, I have noted some very wet flurry activity at Mammoth even at 39 degrees. They can do that at those elevations, but that warm air is gonna work in. https://www.mammothmountain.com/on-the-mountain/mammoth-webcam/main-lodge
-
Didn’t BWI hit 17 for a high 3 consecutive days?
-

Add your Snowfall predictions 25/26 winter
Snowcrazed71 replied to Ginx snewx's topic in New England
Ambitious. Lol -

E PA/NJ/DE Autumn 2025 Obs/Discussion
LVblizzard replied to PhiEaglesfan712's topic in Philadelphia Region
Saw a bit of a glow on the horizon through the camera lens earlier. That’s about it for tonight. From what I’m seeing tonight is underperforming compared to last night at lower latitudes. Plus I’m now shrouded in clouds here so no hope of seeing anything else. -
The following winters to the years mentioned above. Jan 1962, roller coaster of roller coasters. There was a nearly 80 degree spread in temps that month. A -10 low and a 68 degree high late in the month. The cold and moisture met well. There was a 4 inch snow event on New Years, a 14 inch snow event on the 8th, 9th and 10th that led to single digit highs and the -10 degree temp. After the 68 degree high, it snowed 2 inches on Jan 28th. With the extremes, the month was about -2 overall. Winter took a hiatus in February, a few cold days and a few days of snow showers but nothing major. There was a 4.5 inch snow event on March 5th/6th and a 6 inch event on March 9th. (Back when March was always good for 4-8 inches of snow it seemed like) Jan 1968 was -3 overall. Coldest low was 0 on back to back days, 8th and 9th. It snowed 3 inches on the 9th, changed to rain and freezing rain the next day. It then snowed 2 to 3 inches a day for 3 days in a row. Finally warmed into the 60s a week later, then by the 24th rain changed to snow and 4 inches fell. February 1968 was an ice box but fairly dry. Snow fell on 10 days but the biggest was 2 inches until leap day, when 5 inches fell on the 29th. February finished -11. March was around -2 and a 2.5 inch ran to snow happened on March 23rd. 1969/70 I already talked about January, December 1969 was cold early, a little bit of snow on 6 different days between 12-12 and 12-23, then a big daddy hit Christmas day and the 26th, 10 inches total. Knox had around 8-9 inches that Christmas too and I believe is their biggest Christmas snow ever. February of 1970 was just as harsh as January. It was true wall to wall winter. It snowed 4 inches on February 3rd and was -9 on February 4th, and -7 on the 5th. It snowed 1/2 inch on Feb 6th, then 3 inches on Feb 9th. After that, February had a few more cold days, and some warm ones but no snow events. It finished around -4 for the month. March stayed around -2 but 1.5 inches of snow on the 16th was it for the month as far as accumulating snow. It also snowed a dusting on April 4th and 15th that year.
-
Looking at all those years week by week every year was about 4 weeks on average when the full effects of the SSW were felt. Its a good bet the affects of this SSW will be late DEC at the earliest & into JAN.
-
Worth it though

-
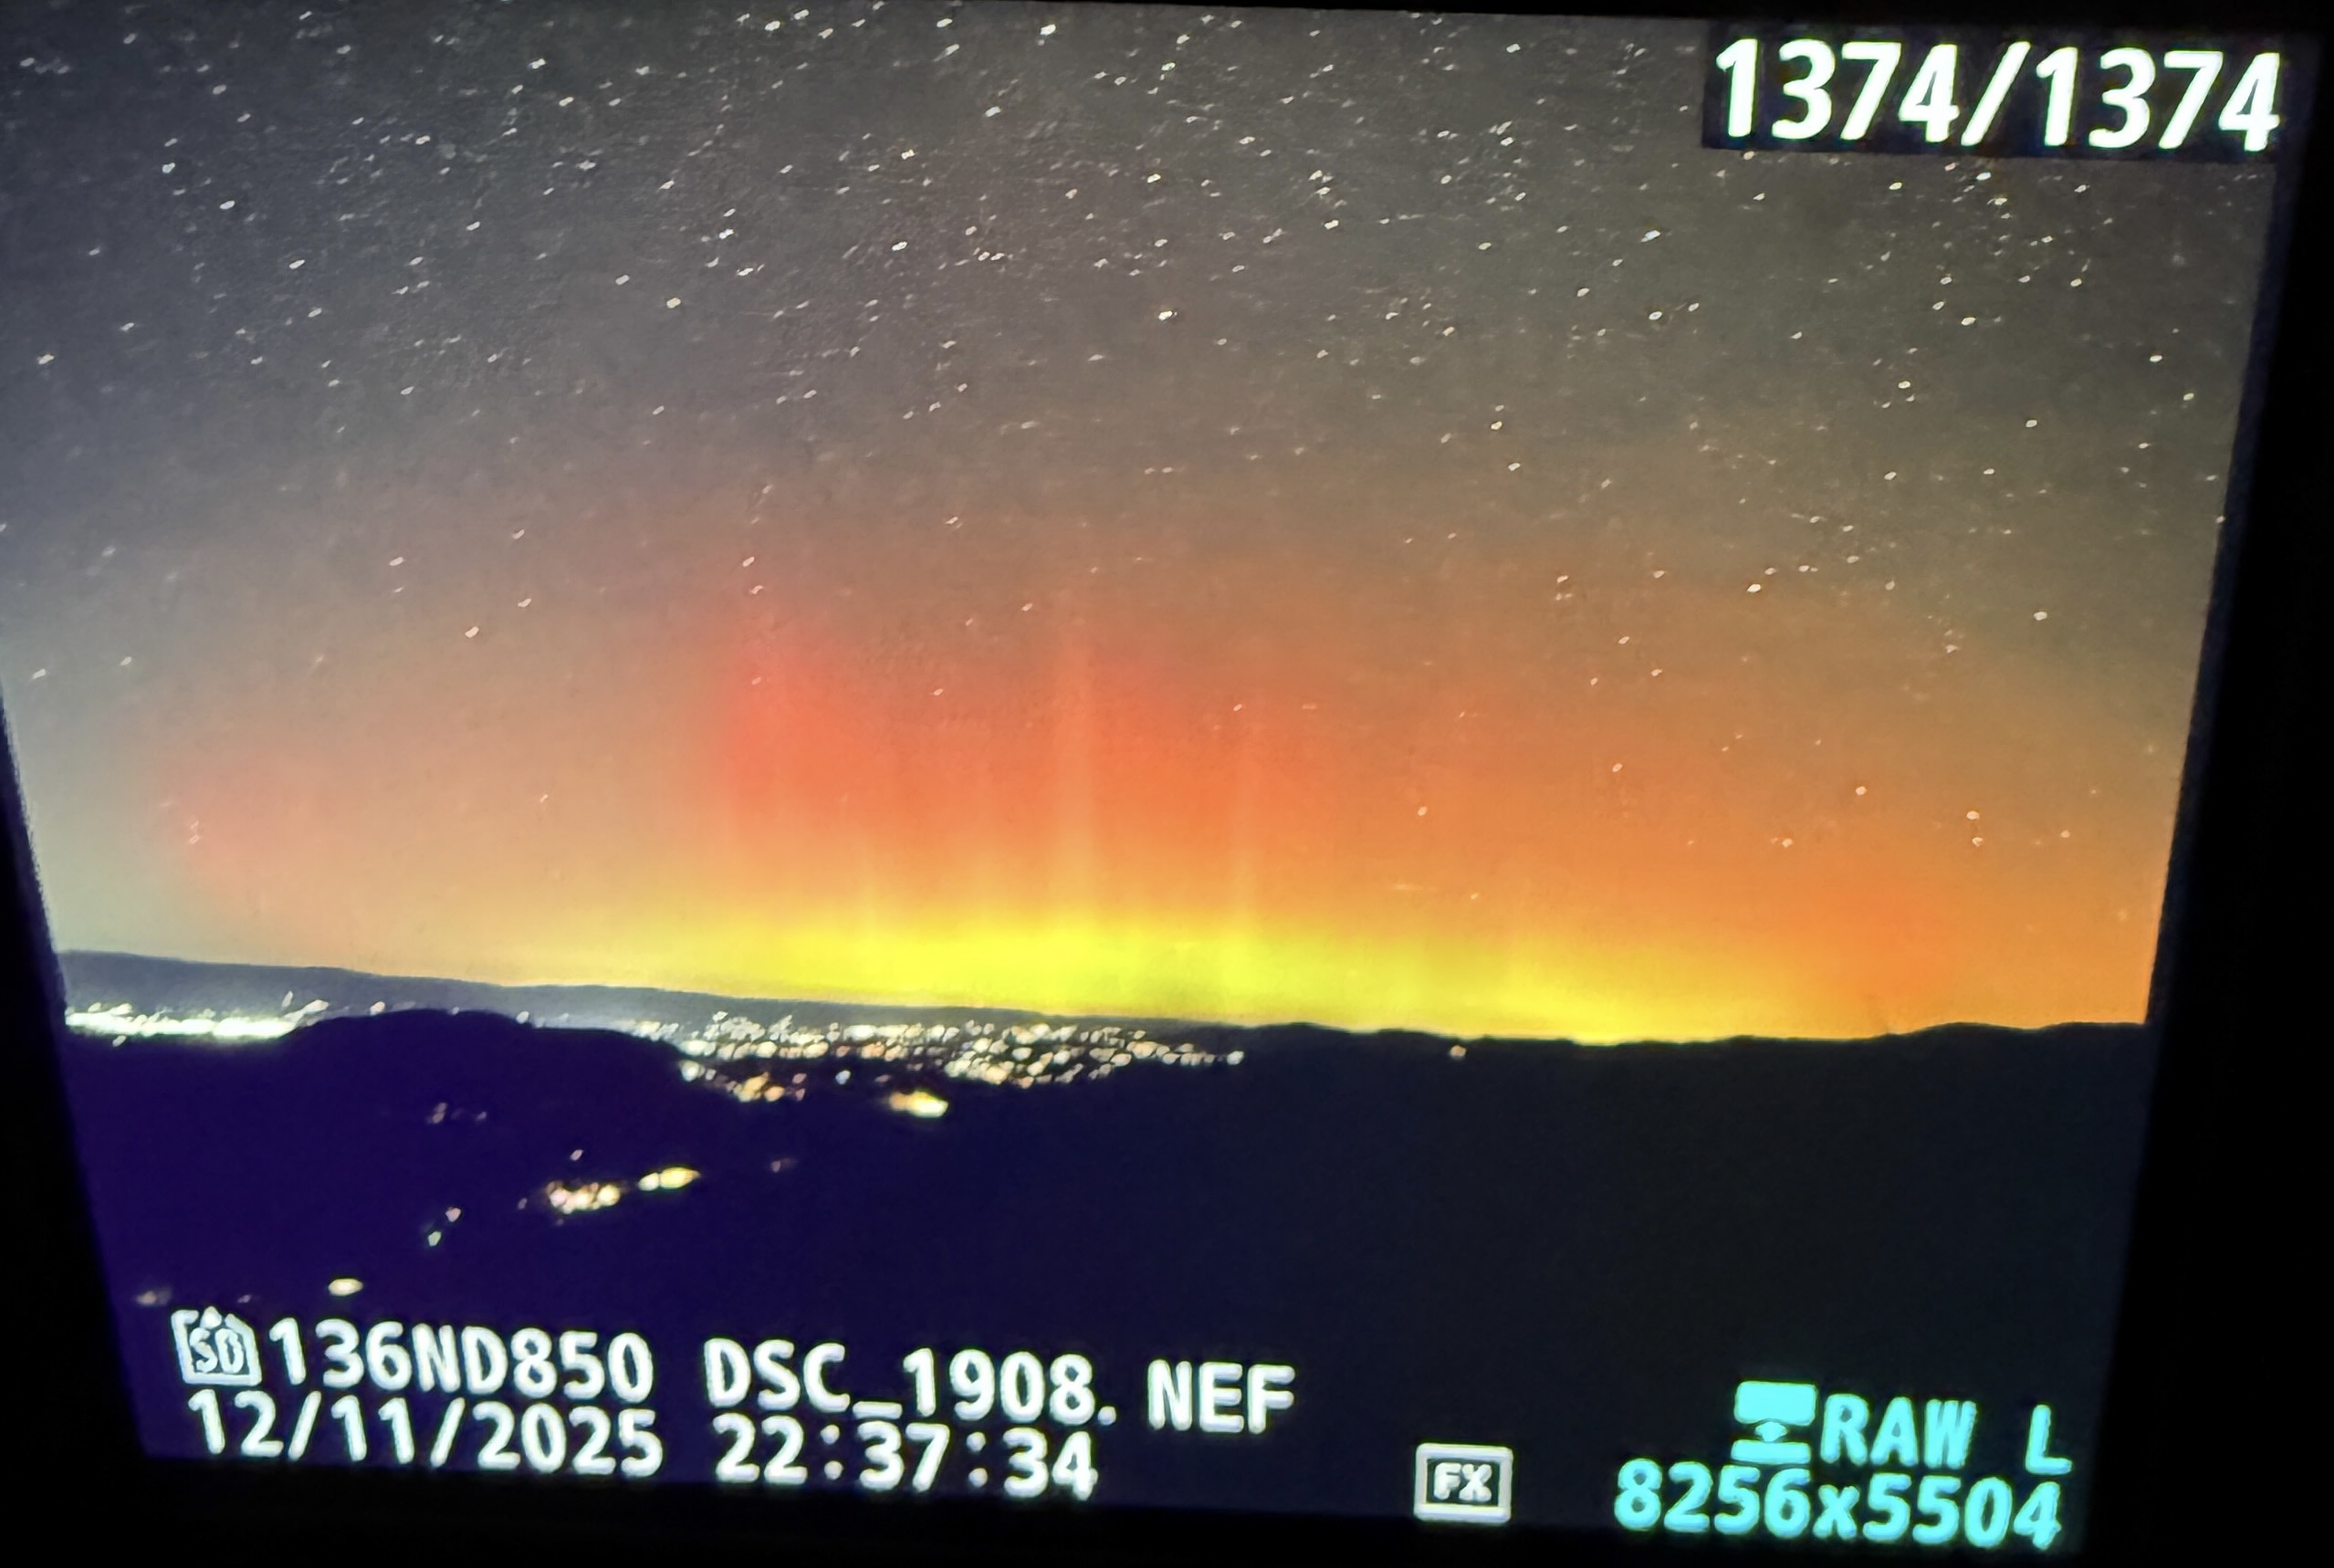
Got the 1st substorm on camera then my tripod falling and breaking my lens combined with an 8am class made me retreat before round two.
-

MO/KS/AR/OK 2025-2026 Winter Discussion
stormdragonwx replied to stormdragonwx's topic in Central/Western States
And now we got potential record highs coming this weekend! lol -
 Happy birthday! Hope all is well with you and your family.
 -

November 2025 general discussions and probable topic derailings ...
WinterWolf replied to Typhoon Tip's topic in New England
Happy birthday bro. Hope you had a great day. -
 Was hoping to see snow on my birthday. Sadly only virga this morning on radar.
 -

2025-2026 ENSO
so_whats_happening replied to 40/70 Benchmark's topic in Weather Forecasting and Discussion
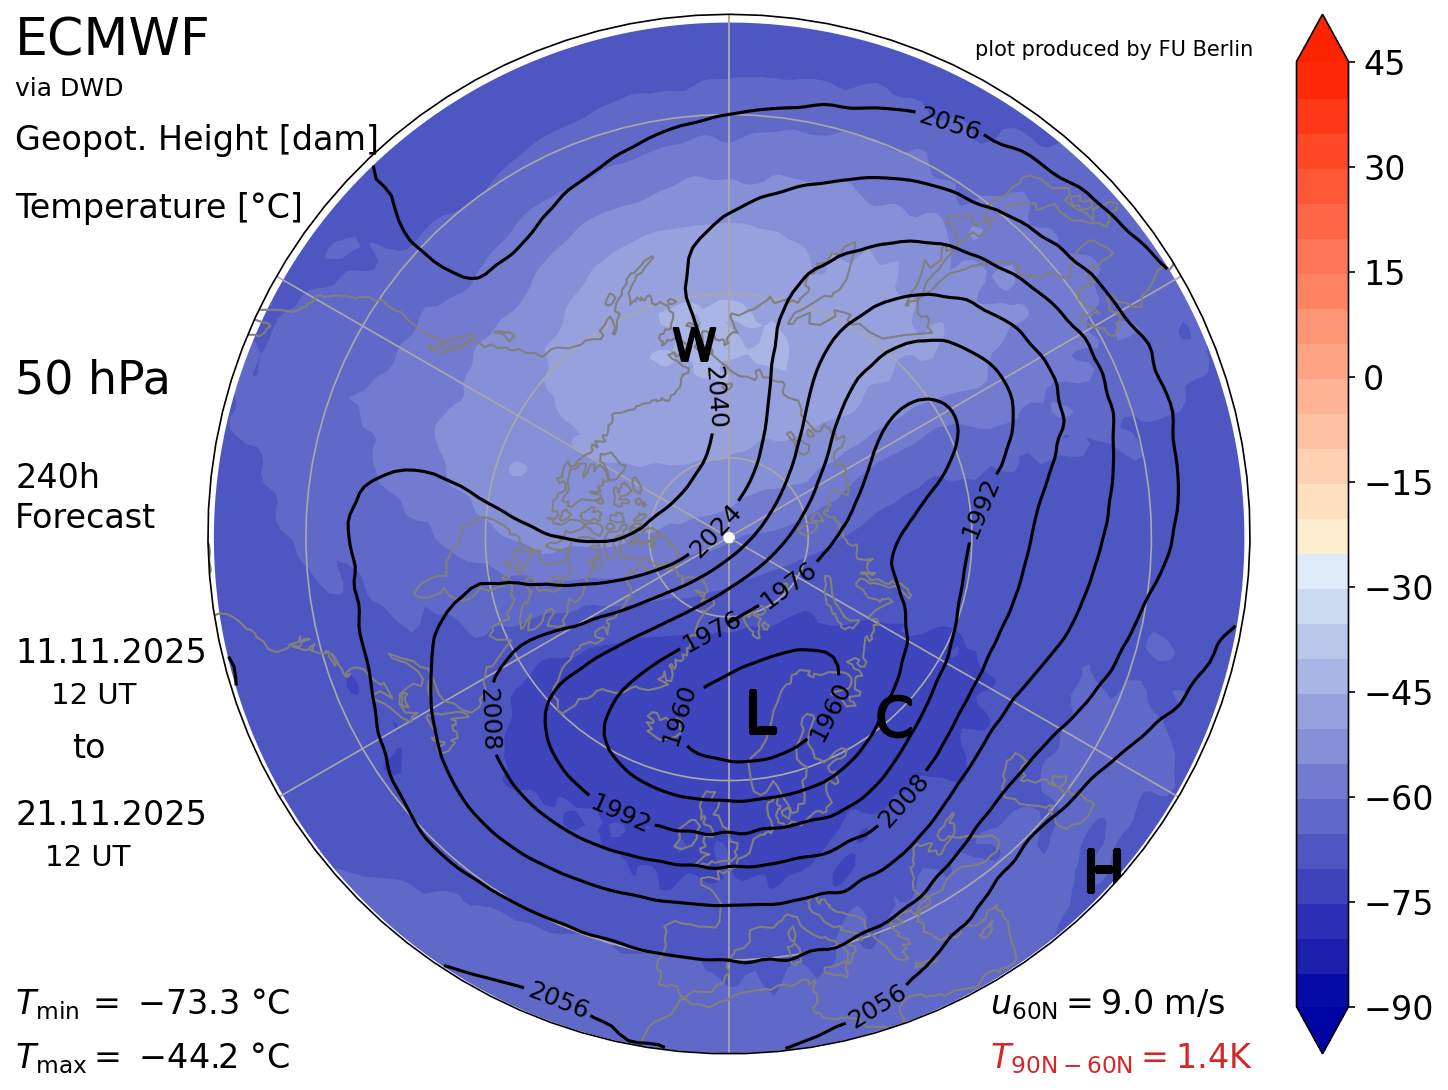
This is turning into a nice wave 1 displacement event as we go into the end of the month. Shame we lose the -NAO signal and it is not allowed to grow with depth. Here is the 50mb Euro 240hr forecast for the SPV we did not have the classic approach of a Scandinavian high retrograding into the NAO domain we typically see that helps enhance a wave 2 response so the -NAO is rather shallow in the atmosphere. Now the question becomes then after this relaxation period in the troposphere do we see a re-emergence of the -NAO as aloft ridging(through the strat) gets pushed over into the NAO domain and we somehow get a connection through the layers? This has been a theme of these events (this one still looks rather mild) over the last 5 or so years. This is not looking like a significant warming event as of now. It is pretty rare to see something major this early I would look closer to the new year and there after for potential if we can maintain a weakened SPV. Sorry they loaded as 2 pdfs versus visuals. Heat flux.pdf Zonal wind.pdf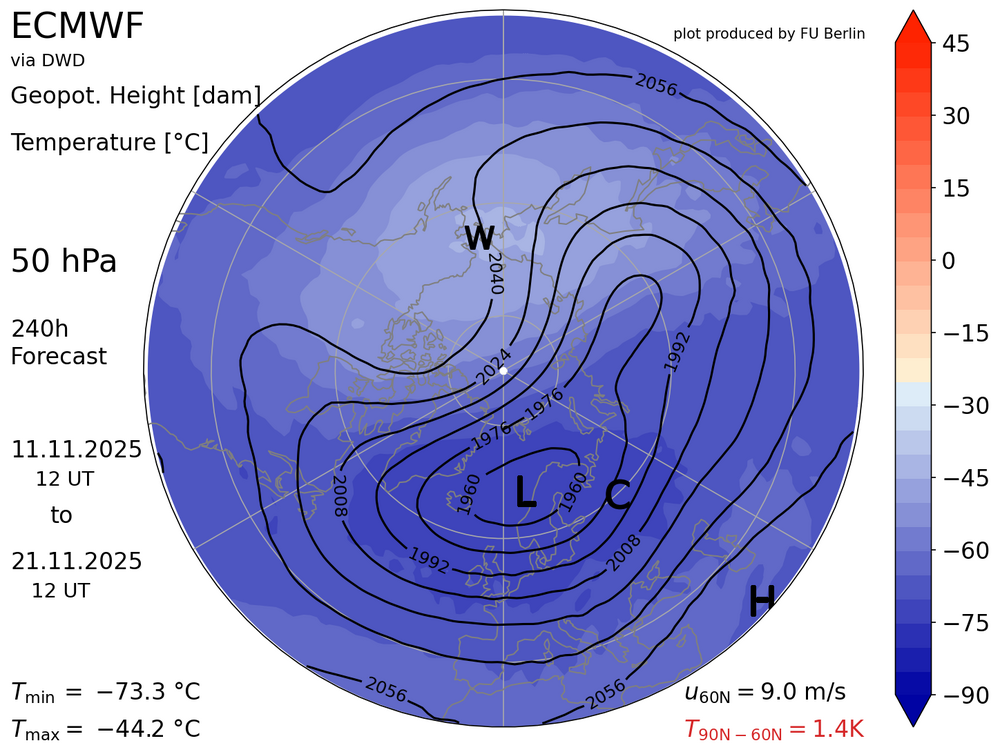
-
Night 2 of the aurora although much fainter:
-
BWI: 20 DCA: 15 IAD: 20 RIC: 10 SBY: 25
-
thank you!
-
Airport? Lol
-
Still pretty cool! Nice shot
-
I did as well but at home I got this lousy drone shot with city light pollution in Raleigh and faint reds:
-
2025-2026 ENSO
Stormchaserchuck1 replied to 40/70 Benchmark's topic in Weather Forecasting and Discussion
Nice post Larry.. Jan Natural Gas is the highest priced contact of the Winter season, implying this is the most -NAO month, but I think the weak-negative ENSO/-QBO might turn us warmer after December, maybe more Pacific-driven warmth. I do see -AO tendency in January this year. Also, Nov 24 - Dec 7 typical lag to -NAO is +35 days, so that is most correlated to -NAO Dec 29 - Jan 12 -
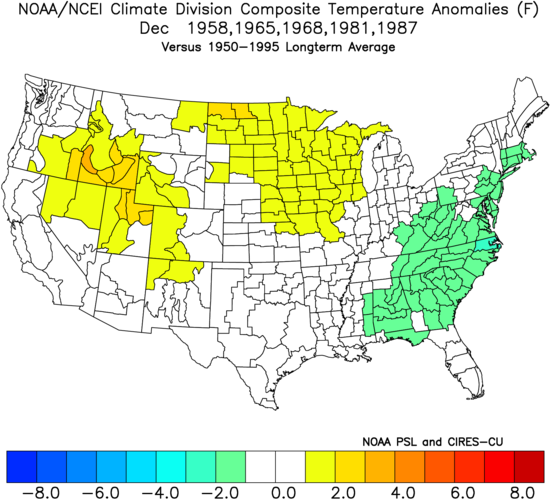
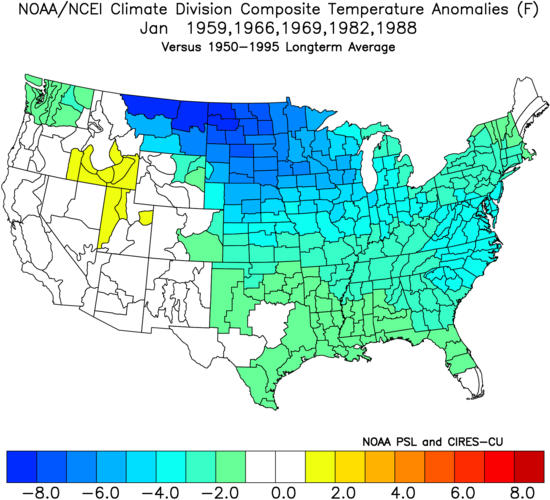
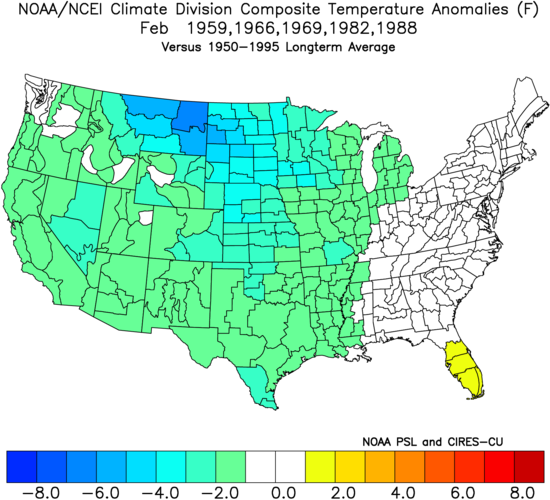
There are 5 major SSW events on record between Nov 24th and Dec 7th:-1958-1965-1968-1981-1987Here’s the Dec temp. anomaly map: E US mainly 1-2 F BN Here’s the Jan temp. anomaly map: E US mainly 2-4 BN, which incorporates extreme cold in places during 1966 (late), 1982 (mid) and 1988 (early): Here’s the Feb temp. anomaly map: E US NN: So, the coldest month regarding E US anomalies was Jan and the warmest was Feb. Feb. might have been even warmer (warmer than normal) had 4 of these 5 winters not been during El Niño, which tends to favor cold in the 2nd half of winter vs La Nina’s colder 1st half. All of this is telling me that should the late Nov major SSW actually occur, the coldest month could easily be Jan rather than Dec, which makes sense considering an assumed several week lag. But, of course, that would remain to be seen especially considering La Niña often favoring Dec as the coldest anomalywise. https://www.researchgate.net/figure/The-SSW-and-SFW-event-onset-date-year-and-type-identified-in-the-NCEP-NCAR-dataset-The_tbl1_267063738
-
2019 following the weak nino
-
I gave up and left before the aurora showed up. Least I got it yesterday lol