All Activity
- Past hour
-
Looking like Sunday and Monday a lot if us will be in the 80s. Unless.....the expected happens and the "increased chance of showers and thunderstorms" disappears again. A least a small reprieve.
-
I've not noticed that around here but maybe I'm just not paying close enough attention. I know many supermarkets put them in around here. The food loss during Sandy was extreme. I remember seeing food being loaded into dumpsters in the supermarket parking lots. We were out for 7-10 days around here. While a Sandy like track into the Jersey coast has a very high return period it would not take much more than a Cat 1 or a low Cat 2 on a track up along or just off the coast to cause similar or worse power outages over a large area.
-

Central PA Summer 2026 Discussion/Obs Thread
Storm Clouds replied to Voyager's topic in Upstate New York/Pennsylvania
Yes, I love it! Great viewpoint of lightning from any storms that go to the south of me! -
Yup, I remember that. I was super lucky that somehow my street only lost power for 14 hours. My mother, on the other side of town, was out for nearly 2 weeks. I know many can't go the natural gas route, but if you can, like you said, that is the way to go.
-
 Cloudy, crappy day. Probably won’t get any rain out of it either
 -
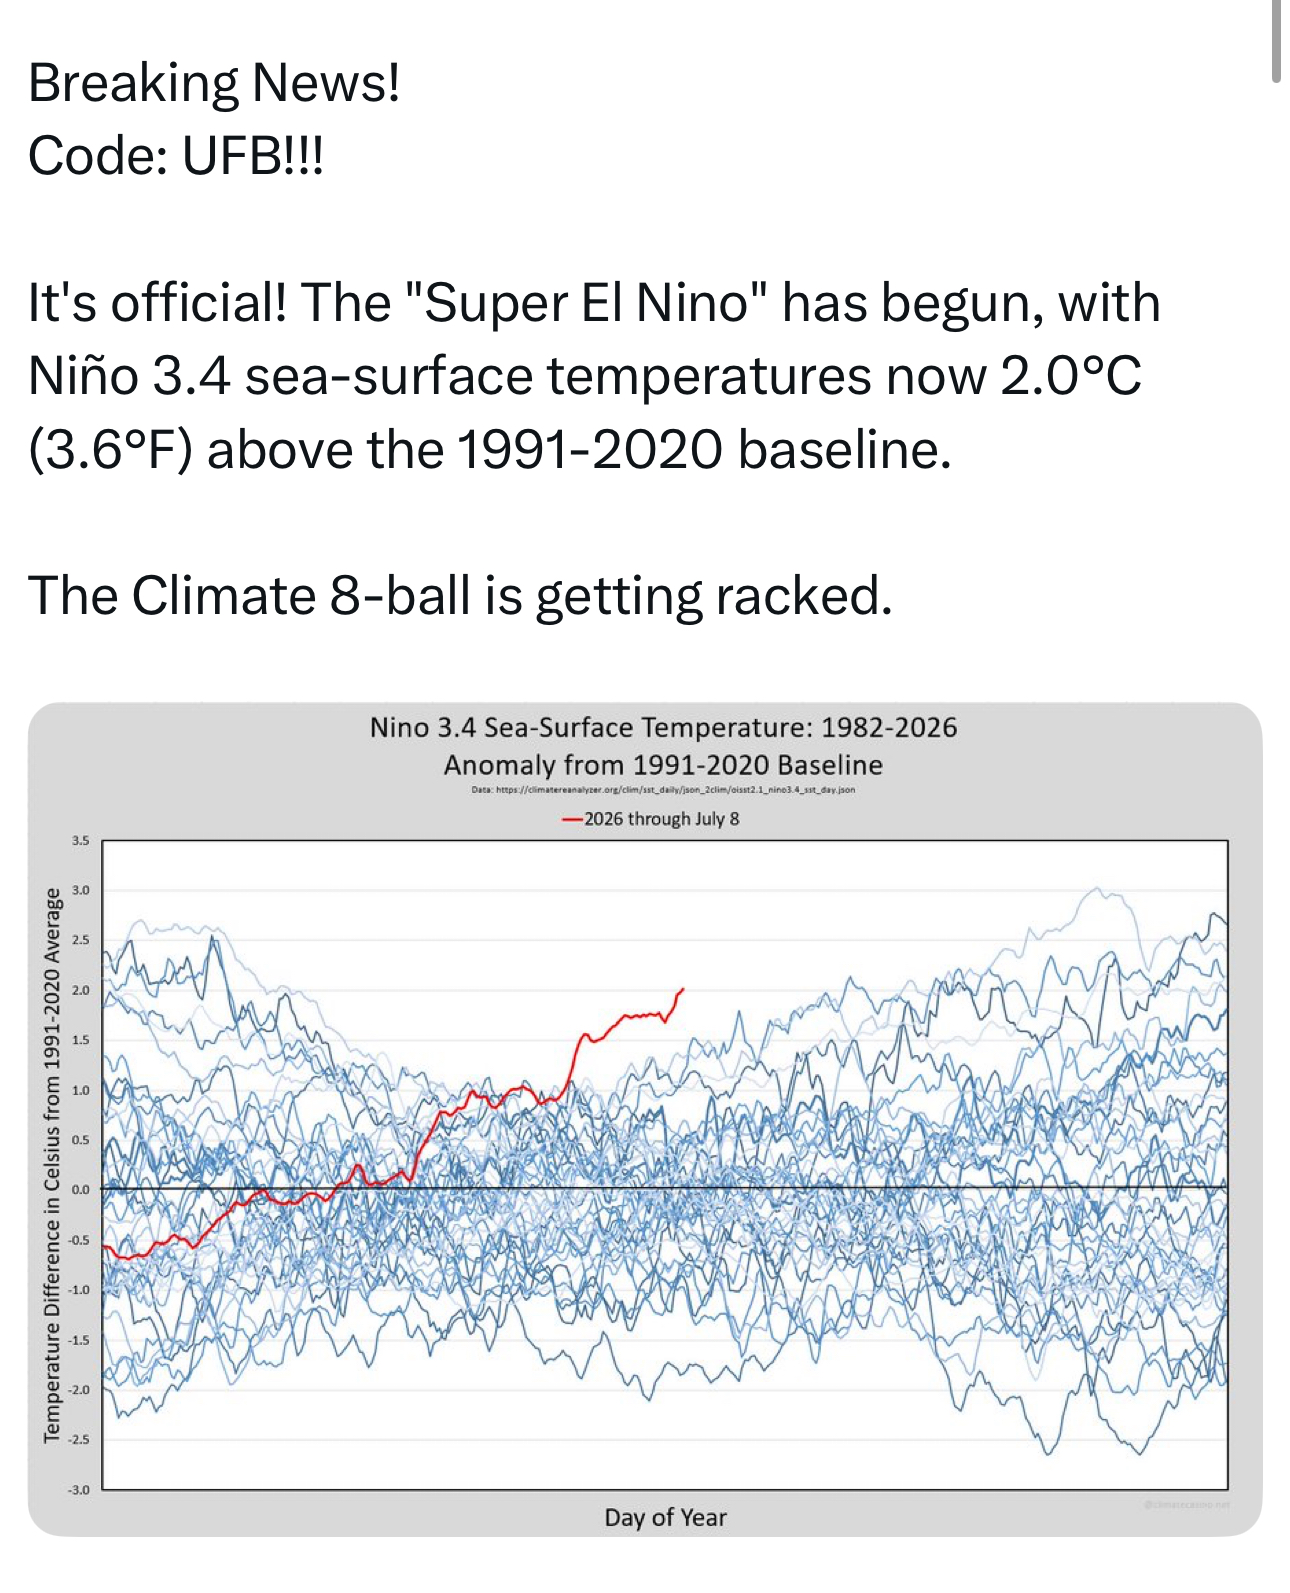
Just ran the top analogs through GPT for listing comparions with / based off this updated info Table 1 — Current ENSO Snapshot Metric Latest Reading Period Signal ENSO Status El Niño Advisory July 2026 El Niño underway and strengthening Niño 3.4 Weekly +2.0°C Latest weekly update Strong El Niño territory Niño 3.4 Monthly +1.44°C June 2026 Strong monthly warm anomaly Niño 3 Monthly +1.71°C June 2026 Strong eastern-central Pacific warming Niño 1+2 Monthly +2.82°C June 2026 Very strong far-eastern Pacific warming Niño 4 Monthly +1.22°C June 2026 Basinwide support MEI.v2 +1.52 May-June 2026 Strong coupled El Niño signal SOI -2.40 June 2026 Strong atmospheric El Niño response Table 2 — Closest SOI Analogs Rank Year June SOI May-June SOI Avg Match Level Why It Supports the Ranking 1 1997 -2.30 -2.25 Very High Very close to 2026’s June SOI of -2.40 and strong negative atmospheric coupling 2 1972 -0.90 -1.75 High Strong May-June negative SOI, similar developing El Niño atmosphere 3 1982 -1.70 -1.15 High Strong June negative SOI during major El Niño onset 4 2015 -0.90 -1.05 High Clearly negative SOI with strong coupled El Niño development 5 1991 -0.20 -0.95 Moderate Negative May-June atmospheric signal, but weaker than 2026 6 1994 -0.70 -0.90 Moderate Negative SOI, but structure less similar 7 2002 -0.40 -0.90 Moderate Developing El Niño with weaker SOI support 8 2023 +0.40 -0.65 Moderate May was strongly negative, but June rebounded positive 9 1957 +0.30 -0.40 Lower-Moderate Some early negative signal, but June not close 10 1965 -0.90 -0.30 Lower-Moderate June negative, but May-June average weaker 11 2009 +0.20 0.00 Lower Not strongly coupled by June 12 1986 +1.60 +0.60 Lower Ocean warming developed later; SOI was not yet similar Table 3 — Closest MEI Analogs Rank Year Apr-May MEI May-June MEI June-July MEI Match Level Notes 1 1997 +0.71 +2.34 +2.27 Closest Explosive transition into strongly coupled El Niño 2 2015 +0.95 +1.90 +1.79 Very Close Strong early-summer coupled signal 3 1982 -0.11 +0.63 +1.65 Close Major El Niño onset; coupling surged after June 4 2023 -0.06 +0.43 +0.51 Moderate-Close Similar cool-to-warm transition, but weaker than 2026 5 2002 -0.14 +0.34 +0.43 Moderate Developing El Niño, weaker coupling 6 1991 +0.36 +0.97 +0.91 Moderate Solid coupling, but different SST structure 7 1994 -0.02 +0.26 +0.96 Lower-Moderate Coupled later, more central-Pacific leaning 8 1986 -0.26 +0.02 +0.41 Lower-Moderate Slower-developing event 9 2009 -0.72 -0.05 +0.56 Lower Not strongly coupled by May-June 10 1972 N/A N/A N/A N/A Pre-1979 MEI.v2 direct data unavailable 11 1957 N/A N/A N/A N/A Pre-1979 MEI.v2 direct data unavailable 12 1965 N/A N/A N/A N/A Pre-1979 MEI.v2 direct data unavailable Current 2026 +0.27 +1.52 N/A Baseline Strong May-June coupled El Niño signal Table 4 — SST Region Analog Ranking Rank Year Apr Niño 3.4 May Niño 3.4 June Niño 3.4 Latest Niño 3.4 Overall SST Match 1 1997 +0.16 +0.64 +1.09 Strongly rising Best full-pattern match; rapid warming like 2026 2 2015 +0.70 +0.92 +1.18 Strongly rising Strong basinwide El Niño match 3 1982 +0.21 +0.45 +0.53 Strongly rising later Major analog, but June Niño 3.4 was weaker than 2026 4 2023 +0.14 +0.46 +0.84 Rising Good transition analog, but less coupled than 2026 5 1972 +0.07 +0.38 +0.45 Rising Classic east-Pacific developing El Niño 6 1957 +0.41 +0.62 +0.63 Rising Developing El Niño, but weaker June warming 7 2002 +0.02 +0.31 +0.72 Rising Good warming trend, weaker than 2026 8 1965 -0.44 +0.06 +0.36 Rising later Early-stage warming, weaker overall 9 1991 +0.19 +0.26 +0.52 Rising Moderate warm development 10 1994 +0.26 +0.31 +0.32 Modest warming Warm but weaker and less similar 11 2009 -0.35 +0.06 +0.31 Rising later Weaker early-summer event 12 1986 -0.33 -0.53 -0.31 Rising later Later-developing event; not close by June Current 2026 +0.29 +0.90 +1.44 +2.0 Baseline; rapid strengthening into strong El Niño territory Optional Add-On — Current 3 SST Areas Key to El Niño Region Latest / Recent Value Why It Matters Niño 3.4 +2.0°C latest weekly / +1.44°C June monthly Main ENSO-monitoring region; now in strong El Niño territory on the latest weekly reading Niño 3 +1.71°C June monthly Shows strong eastern-central Pacific warming Niño 1+2 +2.82°C June monthly Very strong far-eastern Pacific warming; supports east-weighted structure Niño 4 +1.22°C June monthly Shows the warmth is not only coastal/eastern, but also basinwide
-
alot of the gas stations here put in generators after Sandy-that was crazy to have no access to gasoline for days and days
-
I had friends in Sandy with portable generators. Problem was they could not get gas. Driving around looking for it. Many gas stations had no power to pump. In addition is was 2-3 days before you could get out of your local area since so many trees were blocking roads. Natural gas only way to go if you can. I know some can't.
-

Central PA Summer 2026 Discussion/Obs Thread
Itstrainingtime replied to Voyager's topic in Upstate New York/Pennsylvania
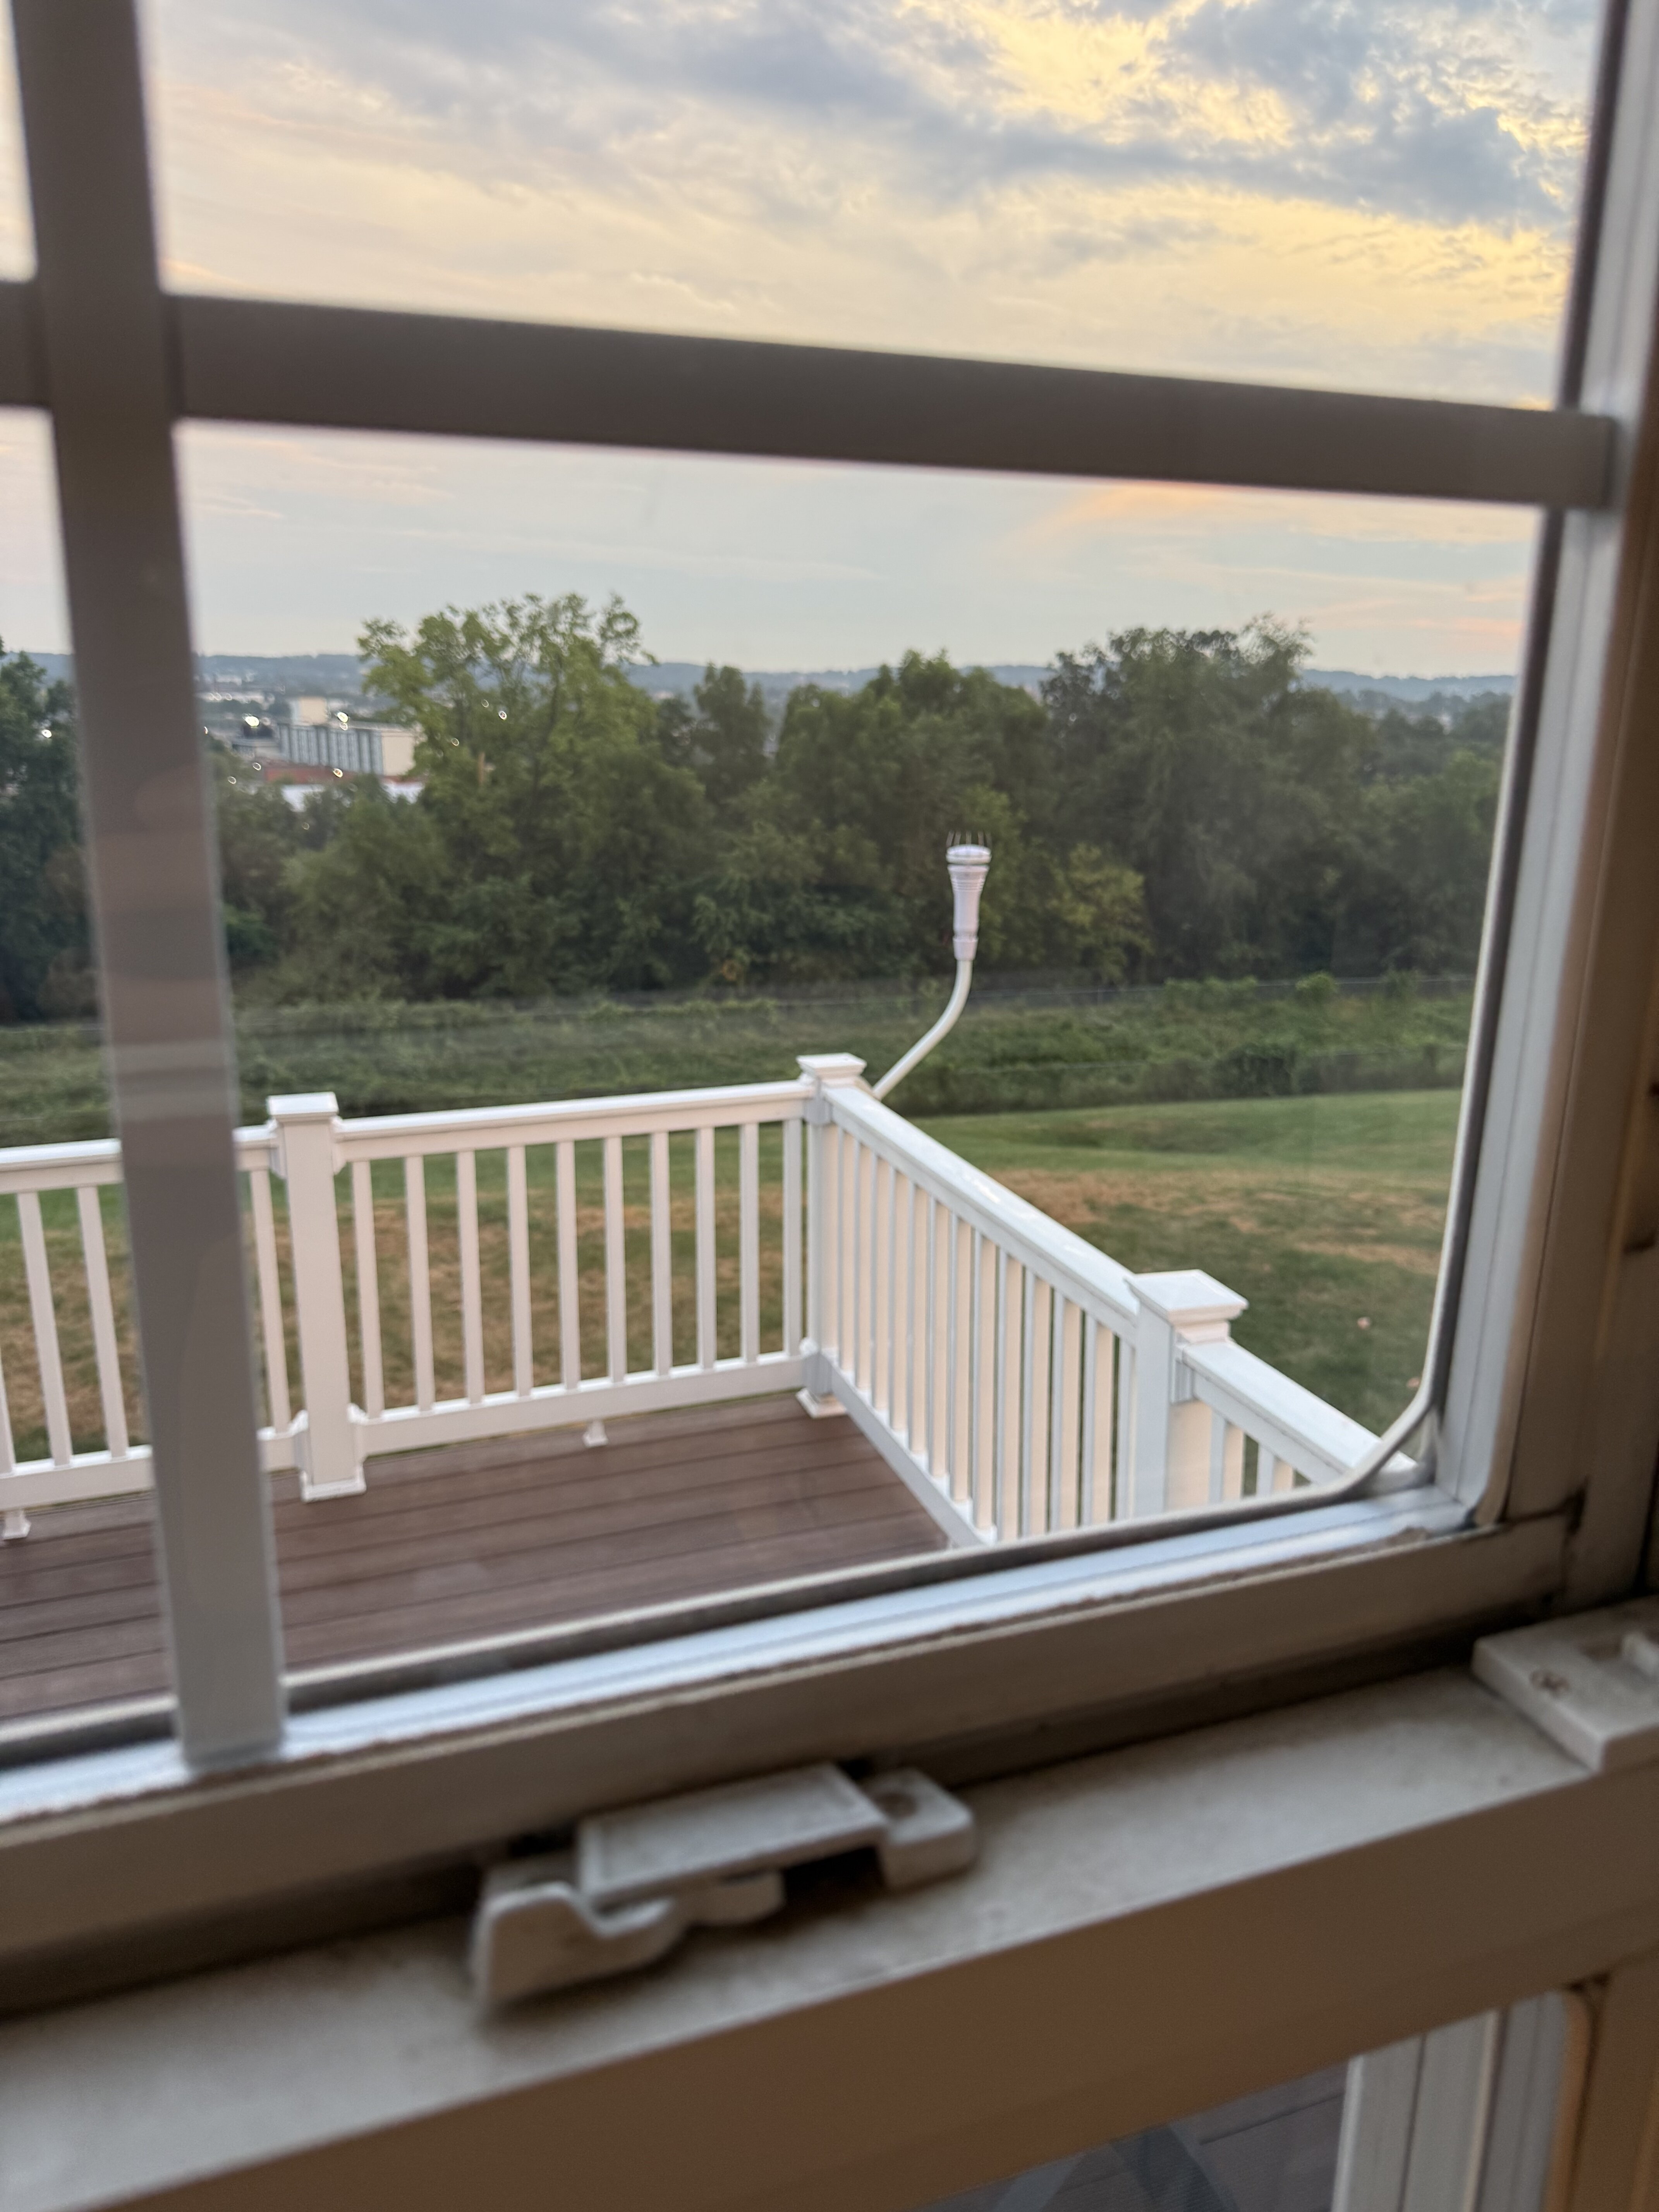
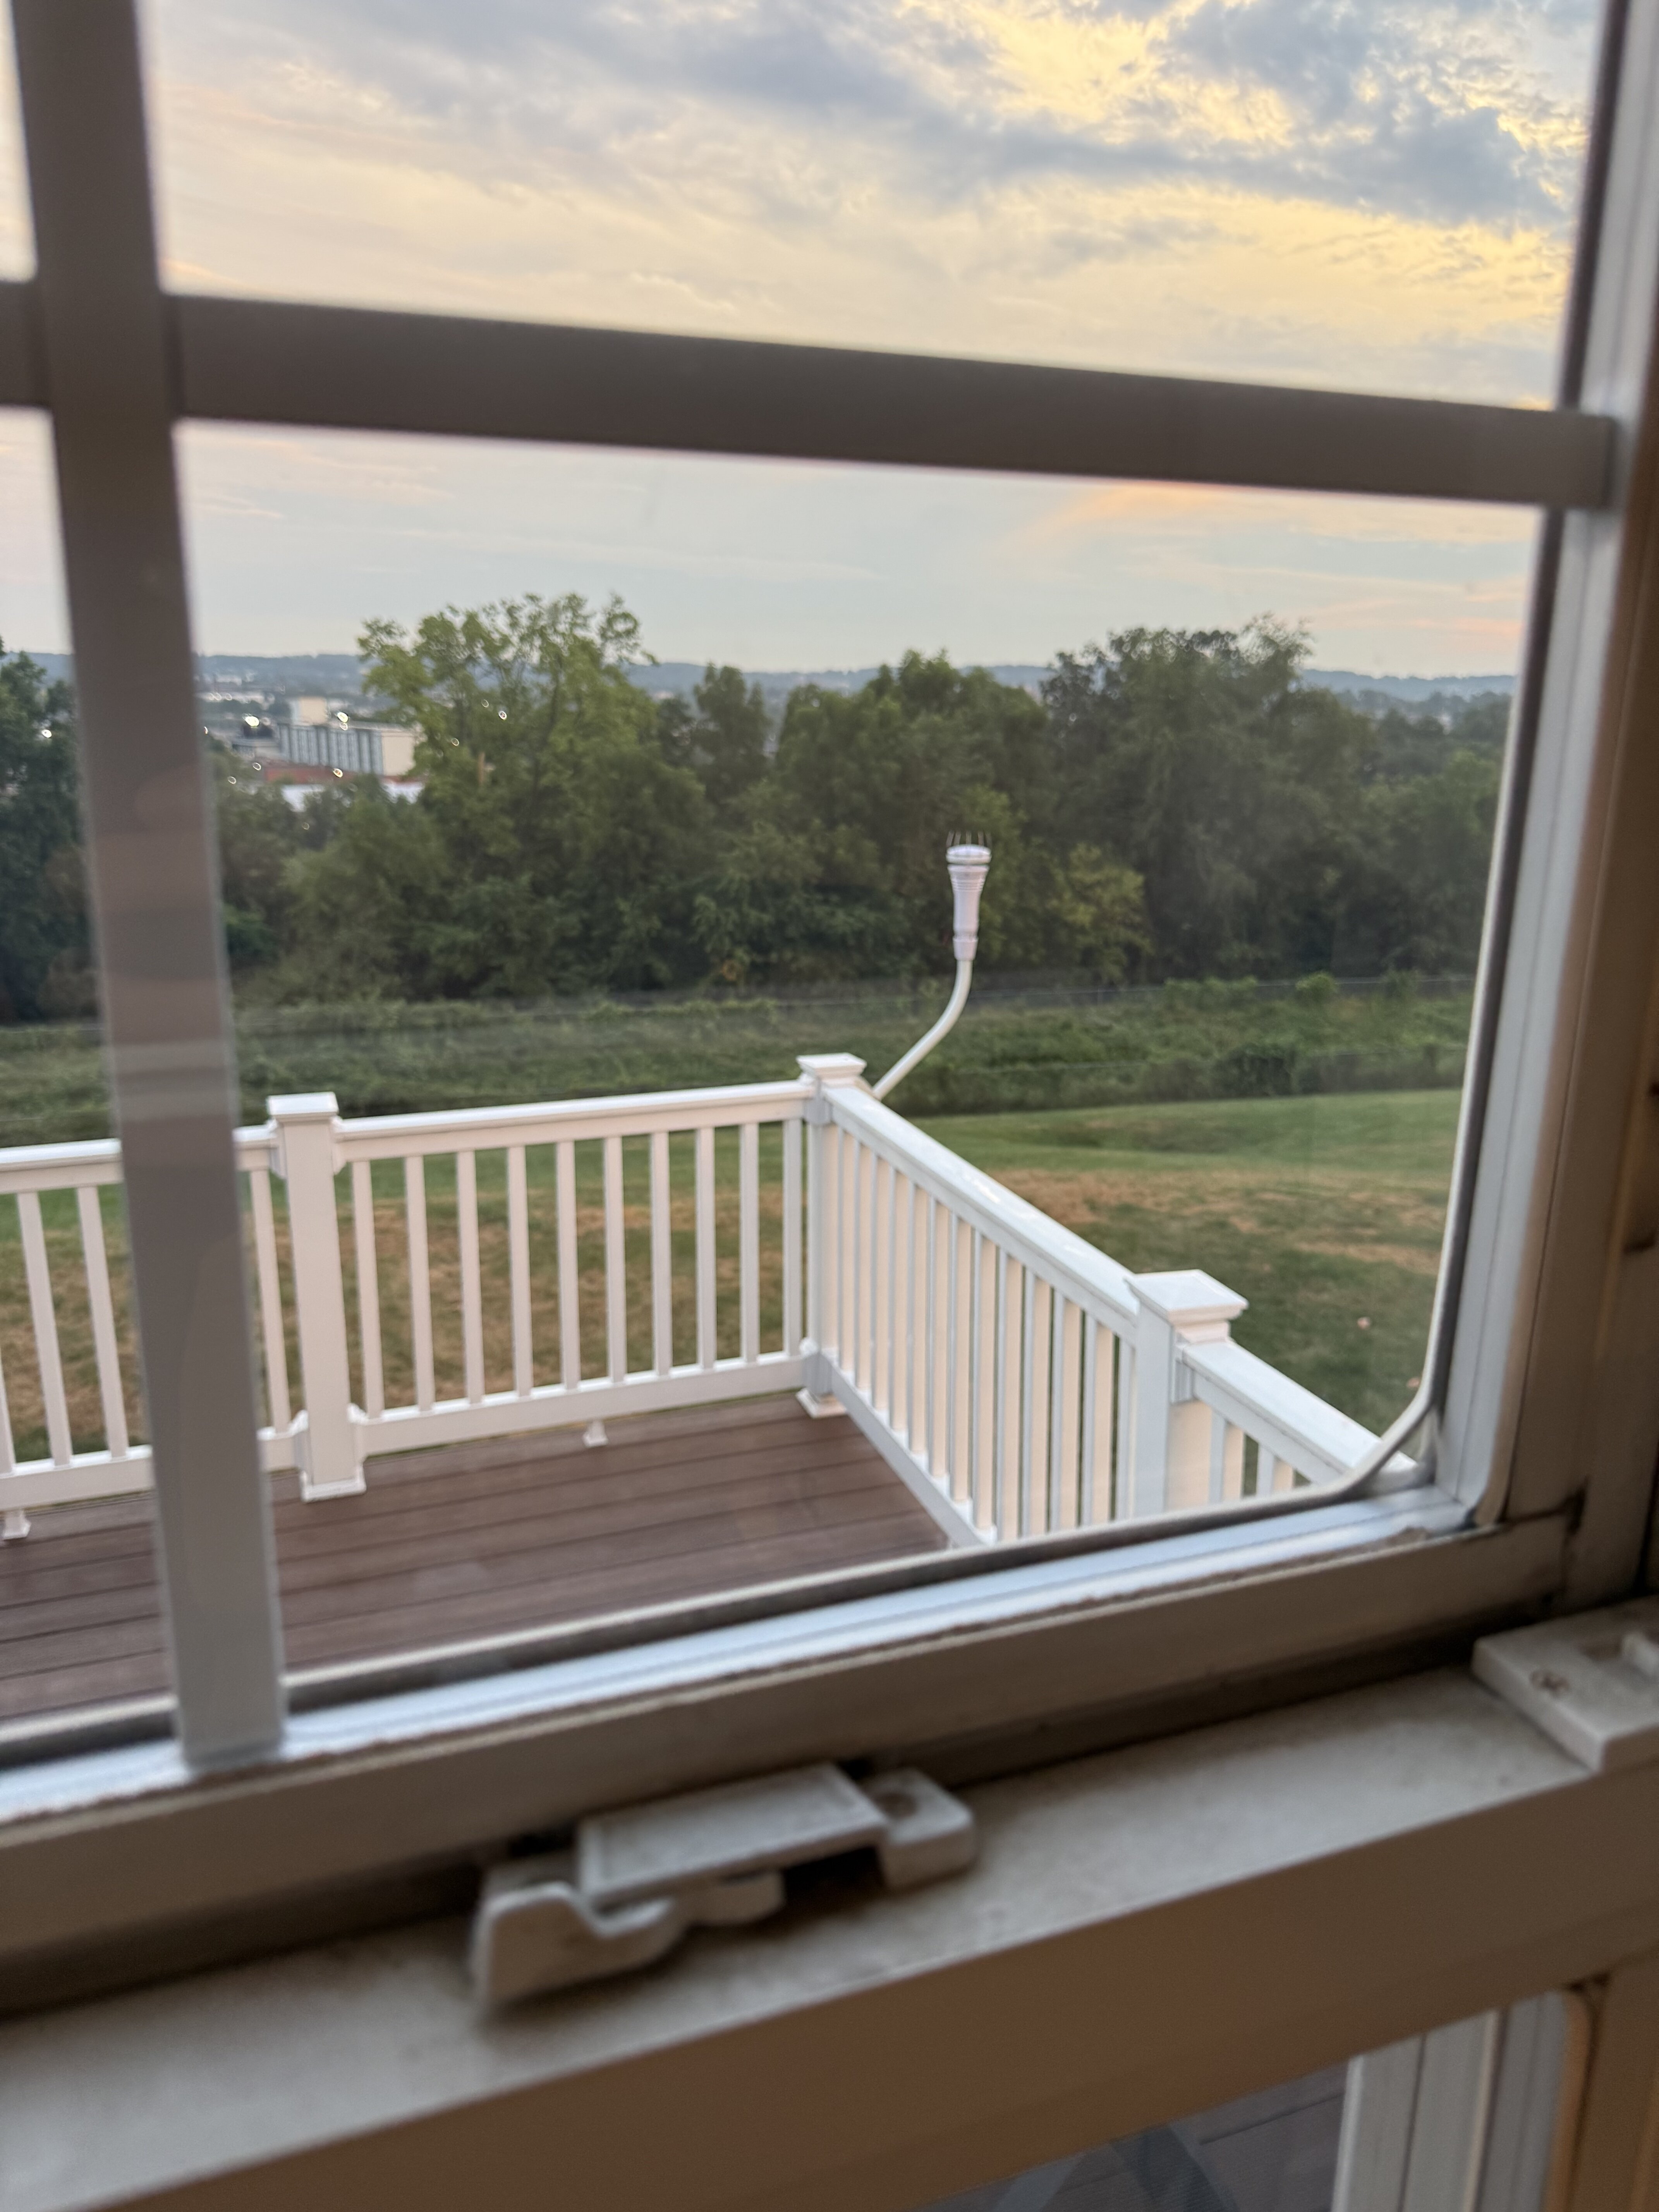
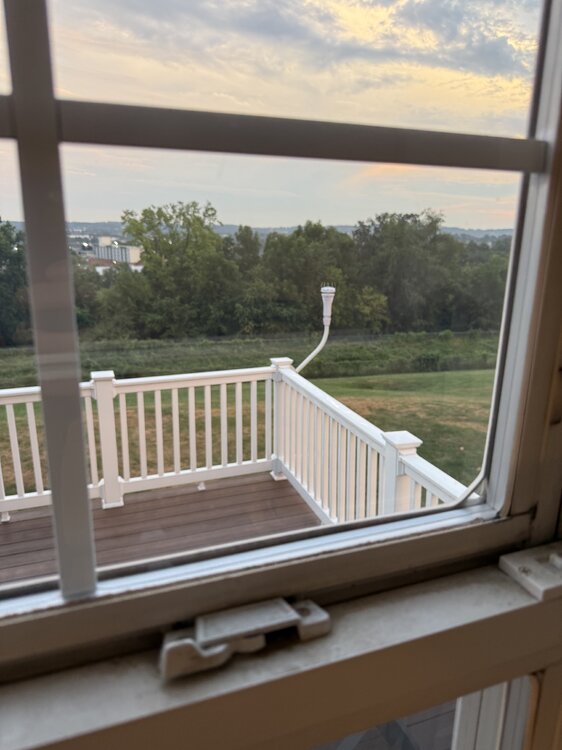
You have a really nice view from your house. -
Up to 86 and about another 30 - 90 mins before more clouds and isolated showers come advancing east
-
-
3k NAM has a neat cyclonic feature near Kentucky that lasts all Sunday.
-
Always depends on size of propane tank. I have a natural gas line for my WHG (20kw), but my parent’s house has a buried 500 gallon tank for their WHG (50kw), as I recall. It was getting low a week after Sandy.
-
Coastal Wilds has Kangaroo Yoga. Might be a fun thing for you and your family to do while there. :-) https://www.coastalwilds.org/
- Today
-
My Tempest Weather Station is up and running! So far, so good! Now it’s time to head to Hilton Head SC for vacation haha. Got it mounted and set up right before I left to have data to track when I’m gone!
-
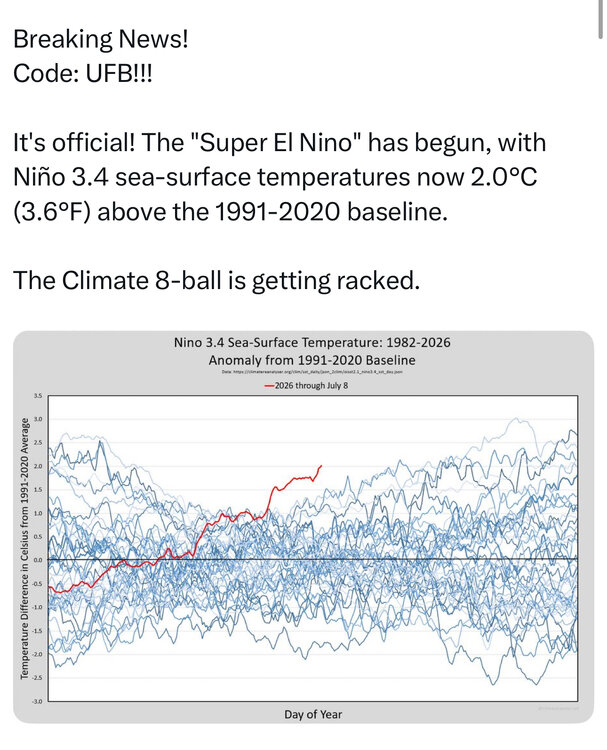
I’d love for this to be true. However, unfortunately: The administration has a new climate change office. It’s headed by a climate critic. The office that produces the National Climate Assessment has been reconstituted, after the administration gutted it last year. https://www.politico.com/news/2026/07/09/the-administration-has-a-new-climate-change-office-its-headed-by-a-climate-critic-00990916 ————————— Spreading climate misinformation is fast becoming a shortcut to popularity across right-wing media. This man’s rise proves it. Matthew Wielicki makes baseless claims about climate change and is now a budding star in the climate denial community https://www.mediamatters.org/climate-deniers/spreading-climate-misinformation-fast-becoming-shortcut-popularity-across-right
-
82/83 was east based or leaning per SSTA (some sites have maps that illistrate it better, but I don'thave any off hand), so no need to give up yet. https://www.cpc.ncep.noaa.gov/data/indices/wksst9120.for
-
Central PA Summer 2026 Discussion/Obs Thread
Storm Clouds replied to Voyager's topic in Upstate New York/Pennsylvania
My Tempest Weather Station is up and running! So far, so good! Now it’s time to head to Hilton Head SC for vacation haha. Got it mounted and set up right before I left to have data to track when I’m gone!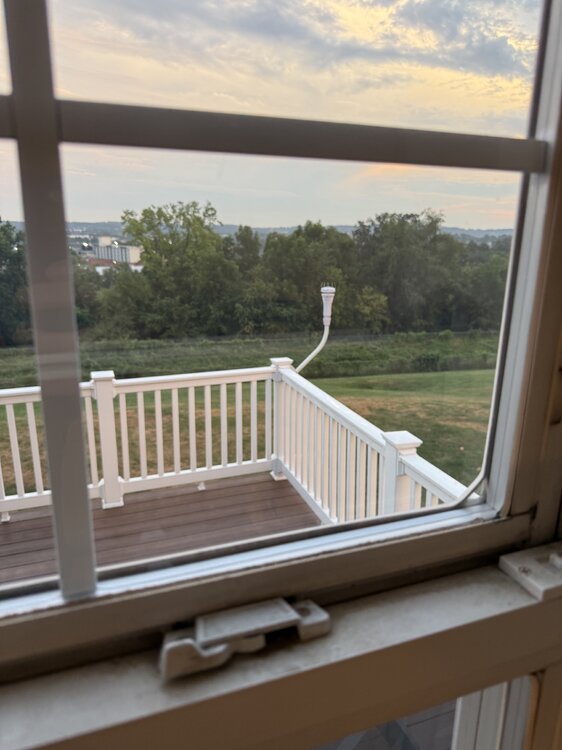
-
 You called it two days ago so kudos for that edit: we got a day 5 mention for thunder at least.
 -

2026-2027 Super El Nino
snowman19 replied to Stormchaserchuck1's topic in Weather Forecasting and Discussion
-
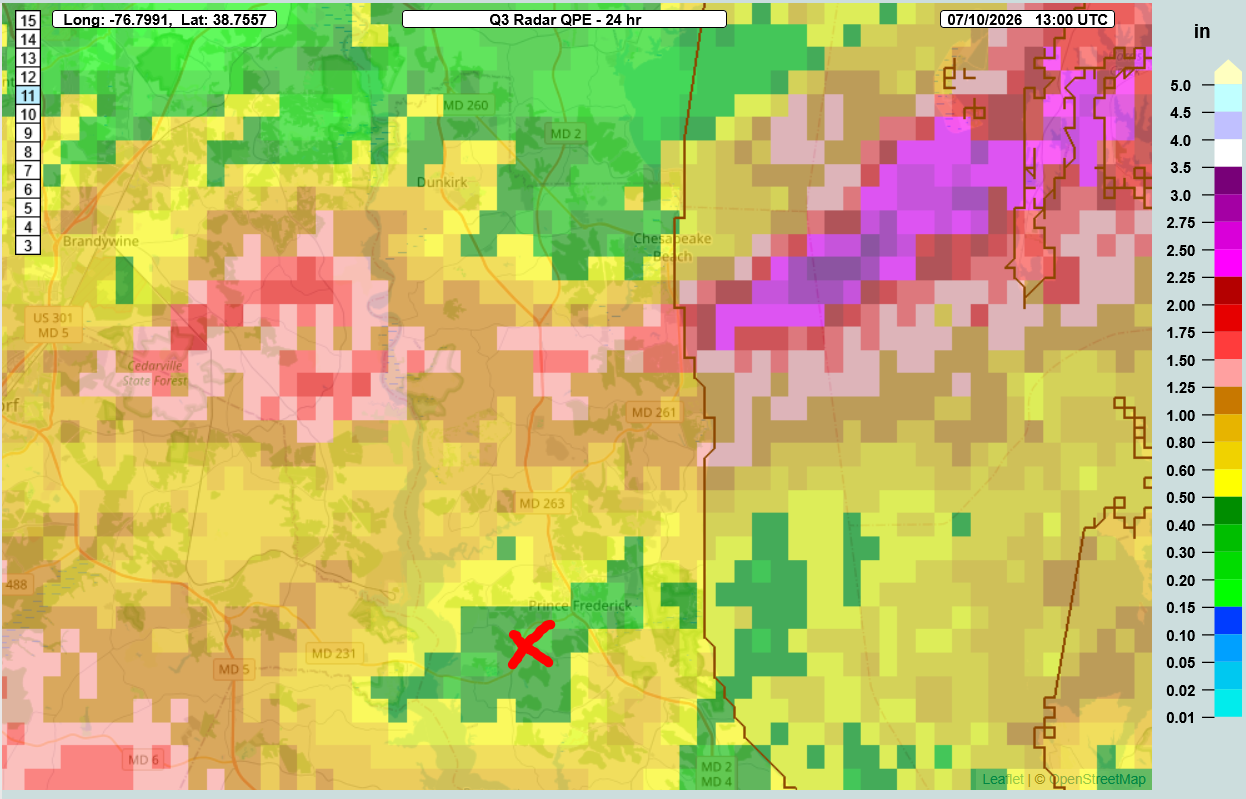
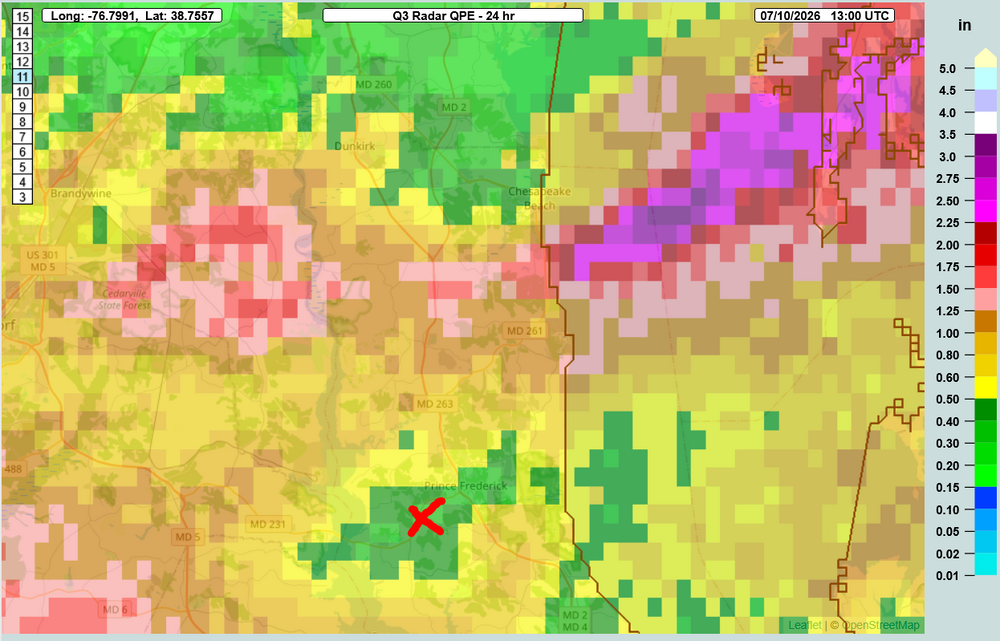
There was a sharp cut-off there. The Red X is where the Prince Frederick mesonet site is. It got the short end of the stick.
-
I initially thought the 12z hrrr liked Baltimore this evening, but then I looked at the rainfall distribution.
-

2026-2027 Super El Nino
GaWx replied to Stormchaserchuck1's topic in Weather Forecasting and Discussion
Thanks, Chris. Wow! 1. Am I correct in assuming this 0Z Euro map referring to record high H5 for 6Z of 7/14/26 centered on the N Plains is for ALL dates rather than just for July 14th? 2. Do you have a link to a source for record highest and lowest H5 for all dates for any location? -
I'm hoping to luck out next Saturday for Freedom Fest in the park.
-
(002).thumb.png.6e3d9d46bca5fe41aab7a74871dd8af8.png)
Central PA Summer 2026 Discussion/Obs Thread
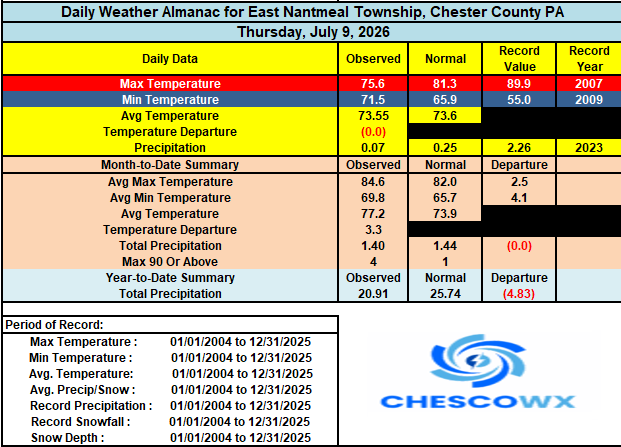
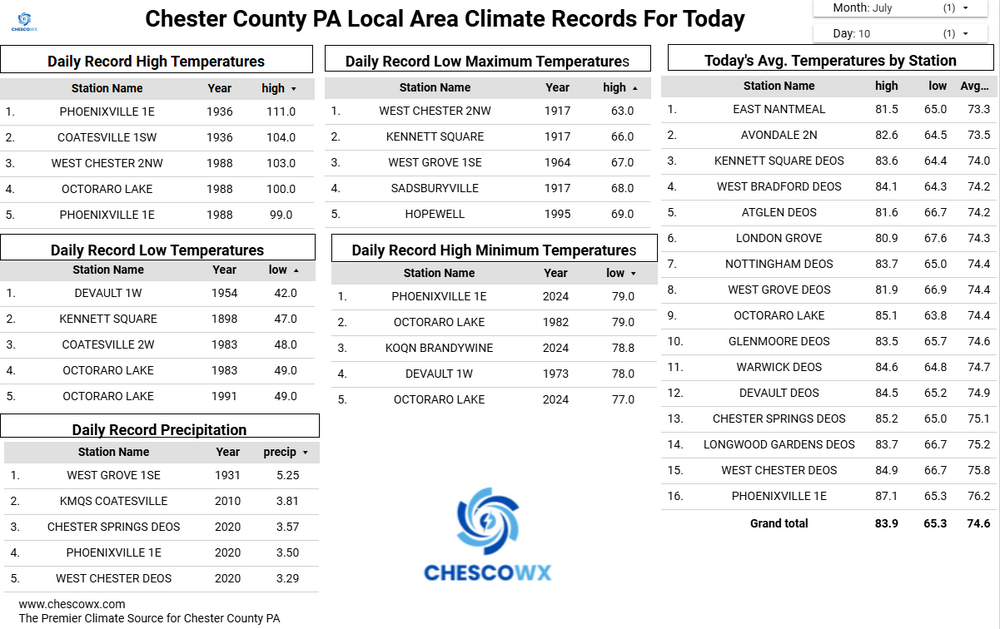
ChescoWx replied to Voyager's topic in Upstate New York/Pennsylvania
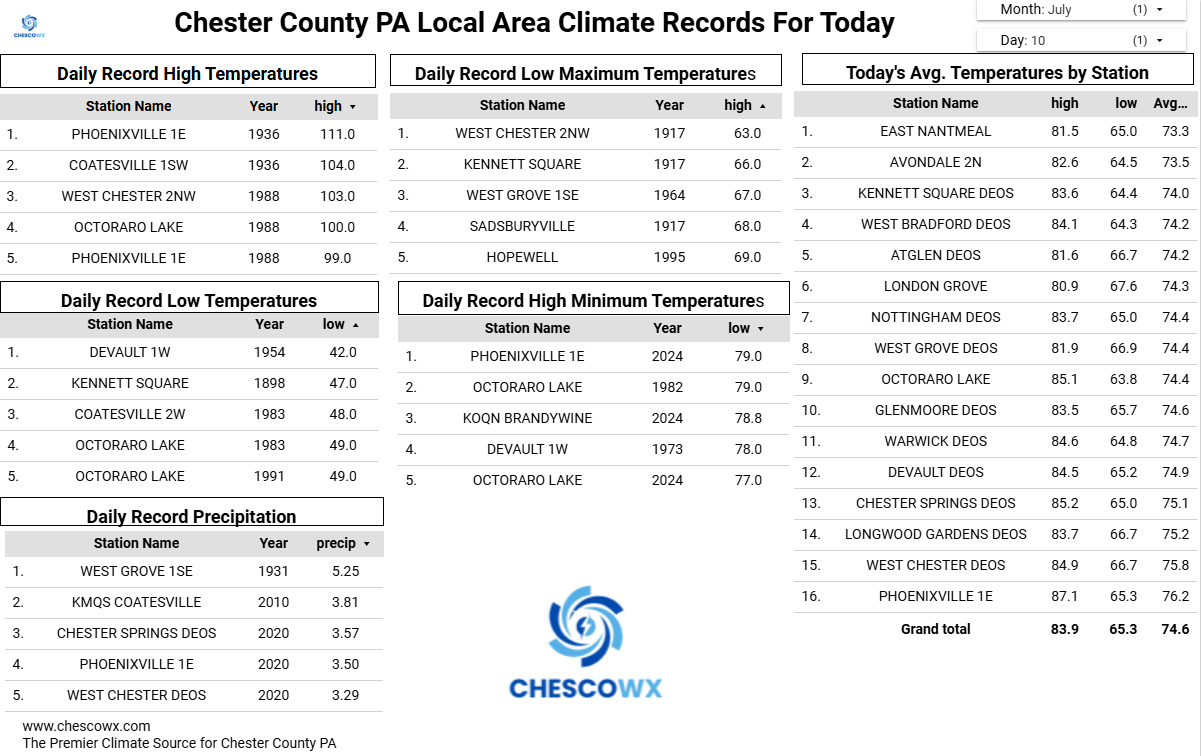
After our heavy rain across much of Southern Chester County yesterday today will feature some additional shower chances both today and tomorrow with a slow-moving cold front. High temperatures today will be near normal in the low to mid 80's. A bit below normal over the weekend before we warm to the upper 80's on Tuesday and near 90 degrees both Wednesday and Thursday.