All Activity
- Past hour
-
Ended up with about a third of an inch. Any rain is good rain right now
-
E PA/NJ/DE Autumn 2025 Obs/Discussion
Kevin Reilly replied to PhiEaglesfan712's topic in Philadelphia Region
Picked up 0.50 storm total peak wind gusts around 40 mph a few weak trees came down here and there. Keep an eye out for one last gasp of the tropics months end. -
Looks like 0.76" for the event. Went from 90 and sun in CA a week ago to low 50s and sheet rain. Nice to have the pattern change.
-
2025 Atlantic Hurricane Season
Kevin Reilly replied to BarryStantonGBP's topic in Tropical Headquarters
All jokes aside that would be an absolute disaster!!! -
Tony Pann posted something… interesting “No Hurricanes have made landfall in the US so far this season. And only one Tropical Storm (Chantal). Over the last 20 years, there have been 5 years with no Hurricanes making landfall: 2006, 2009, 2010, 2013, 2015. The average winter snowfall for Baltimore in the following winter: 35" Obviously this could be correlation and not causation but it’s an interesting factoid.
- Today
-

Spooky Season (October Disco Thread)
WxWatcher007 replied to Prismshine Productions's topic in New England
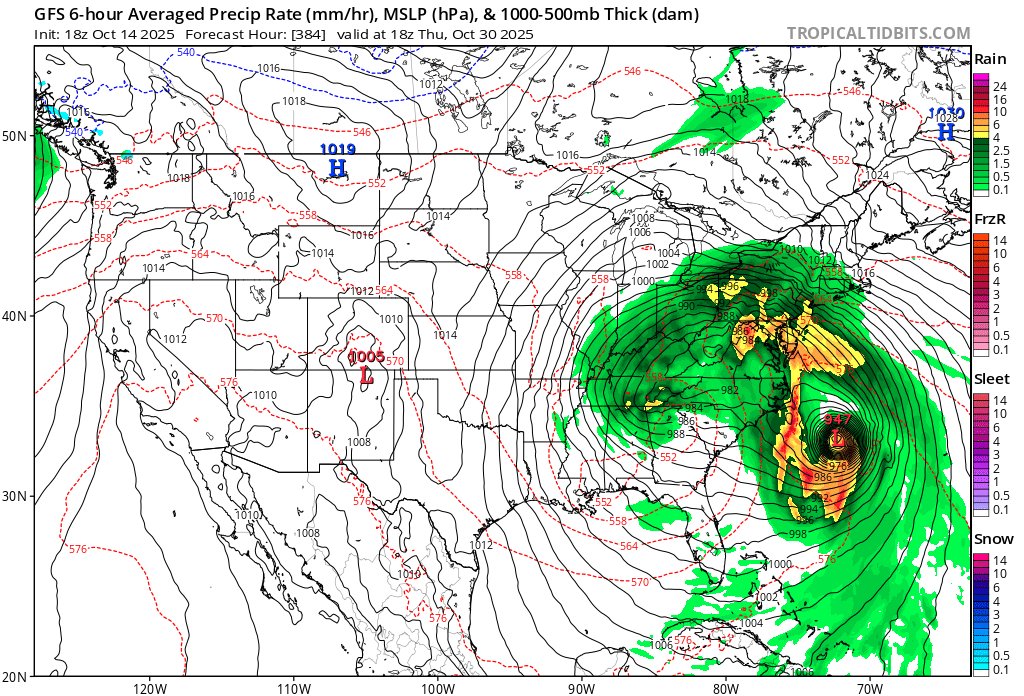
What an insane storm. -
Spooky Season (October Disco Thread)
WxWatcher007 replied to Prismshine Productions's topic in New England
Y'all the GFS does this every year. If a wave can make it to the Caribbean then we can talk. Despite incredibly favorable conditions for much of the season, the Caribbean has been devoid of meaningful activity. -
From the ENSO thread
-
Palisades Tahoe is currently experiencing heavy snow and blowing snow https://www.palisadestahoe.com/mountain-information/webcams Mammoth was very heavy but is lighter, looks to be about 7-12 on the ground at Main Lodge and Woolly Cam. McCoy Station earlier in the daytime, they really got slammed HARD, they are at 10000 feet and may have well over a foot of snow and still snowing hard up there! Nice early season snow! This is early for them, we are talking at least a foot of fresh snow on the slopes. Should be a good base to blow more artificial snow on top of and get them open really early! Mammoth just invested in better snowmaking equipment! More snow coming in a few more days! Woolly Cam https://www.mammothmountain.com/on-the-mountain/mammoth-webcam/woolly-cam You can see ripples on the snow caused by strong winds blowing it all over! We're getting this started REALLY EARLY!!!!
-
Was that a normal part of previous -PDO cycles we've had?
-

2025 Atlantic Hurricane Season
Silver Meteor replied to BarryStantonGBP's topic in Tropical Headquarters
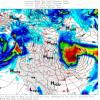
It's amazing what one sometimes sees at the long range. For example this huge extra-tropical swallowing a major hurricane on the East Coast. You go GFS!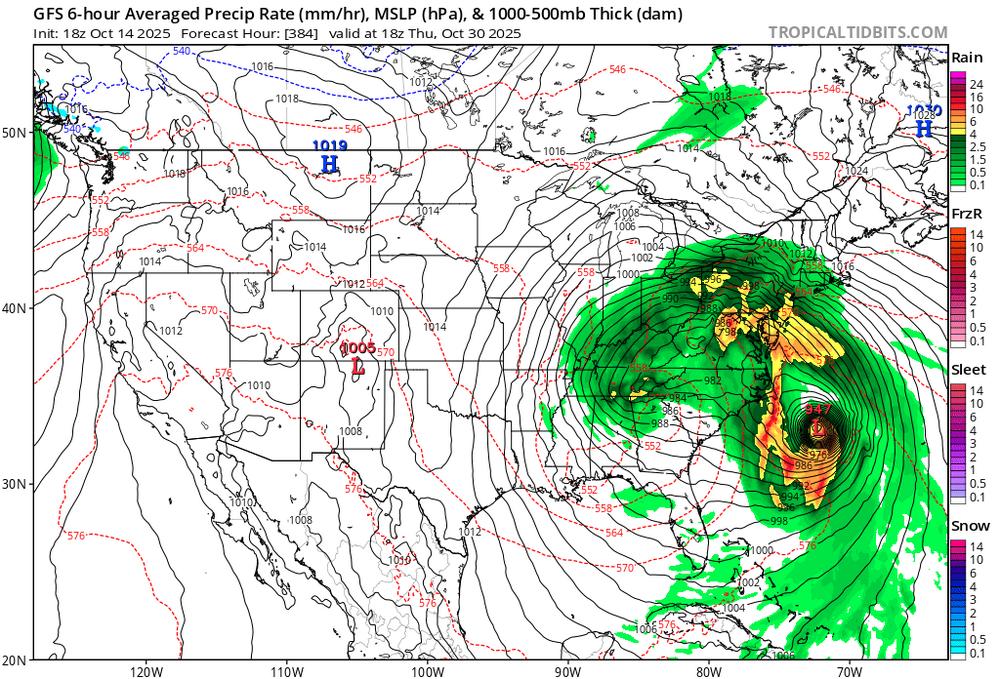
-
You mean trade? These pests come over on ships from overseas. Ships have been engaged in trade for 1000 years. Ships brought over a lot of what we may think of as native. It’s how it always has been and always will be
-
Globalism and all its wonderful side effects. I lost a 60 year old Ash tree to the Emerald Ash Borer. It was a gorgeous tree with a beautiful canopy that provided tons of shade and a beautiful fall foliage.
-
That has not been my experience- we’ve lost almost all our ash in the last 10 years and now beech leaf disease is killing all the beech!
-

Occasional Thoughts on Climate Change
donsutherland1 replied to donsutherland1's topic in Climate Change
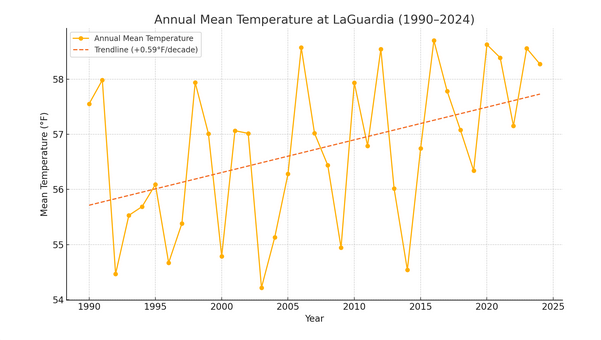
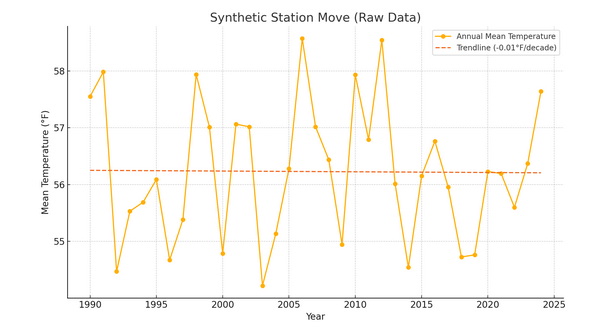
If one is looking for a reliable climate record, adjustments are necessary whenever a station moves. Here's an illustration. Envision a case where one is measuring the temperature in Queens, NY. Assume that the climate record starts in 1990 for purposes of illustration. Temperatures are taken at LaGuardia Airport through 2014. After that, the Queens station moves to JFK Airport. Temperatures are then recorded at JFK Airport through 2024 for purposes of this illustration. If one relied only on raw, unadjusted data, here's what the Queens climate record would look like: There would essentially be no trend in temperatures. Those arguing for the use of unadjusted data would argue that warming is an artifact of statistical adjustments. But here's what things would actually look like: JFK: LaGuardia: The graphs reveal a clear discontinuity in the temperature record when switching from LaGuardia Airport (1990–2014) to JFK Airport (2015–2024), even though they are only 10.9 miles apart. The resulting trend is artificially altered by the change in station location, not by climate. In fact, both stations were warming at similar rates. This simple illustration demonstrates that without adjusting for such moves, the integrity of the climate record ceases to exist. The synthetic station trend is lower than either station individually. In other words, threading the raw data to maintain a continuous climate record creates a badly biased outcome. In sum, station moves introduce biases. To maintain an accurate climate record, data must be homogenized. The data must be corrected for site changes, if one wants an accurate climate signal.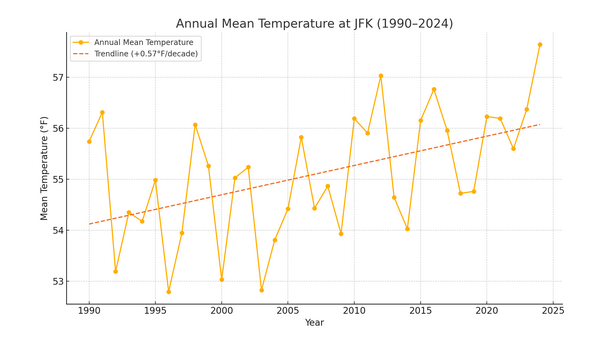
-
Friday morning looks chilly for most of us. Even low 40's down my way.
-
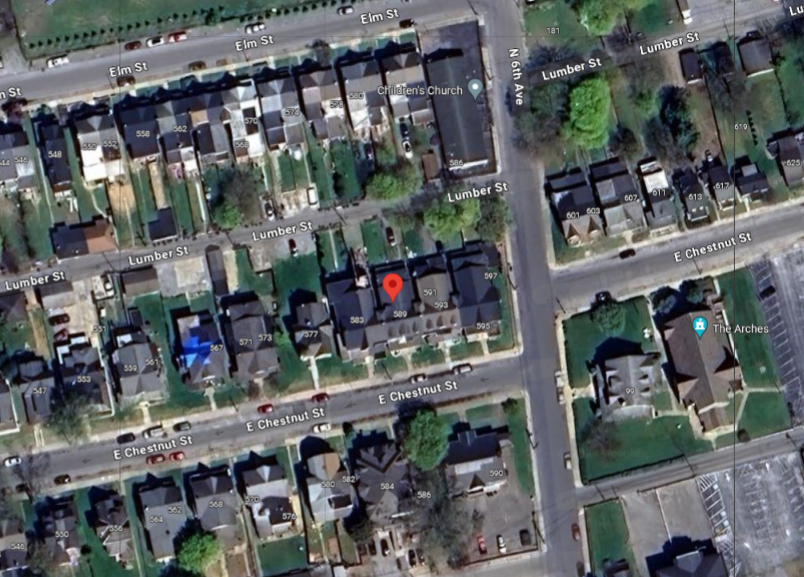
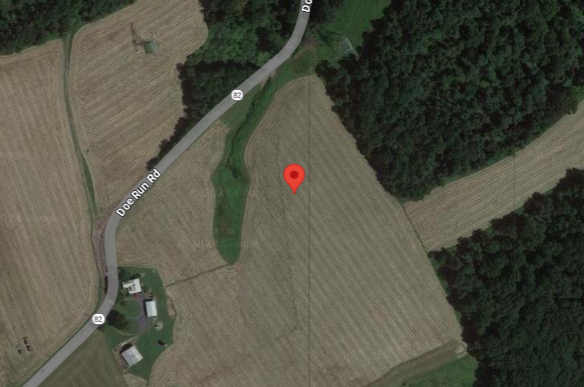
All I know is that you are good at ignoring data that doesn't agree with your worldview. The station move data is unambiguous. Coatesville in 1945 and 1948. Surprised a heat island expert like yourself can't see the difference in these two sites, built up town vs very rural. I certainly wouldn't expect them to have the same temperature. The raw data from surrounding stations allows the effect of the Coatesville move to be determined accurately. This isn't a small change; easy to see the overall effect by comparing the relative position of Coatesville before and after the moves. Before the move, Coatesville was warmer than West Chester and almost as warm as Philadelphia. After the move Coatesville was as cool as Allentown. Roughly 2F cooling overall. Furthermore there many stations other than these 3 that confirm the magnitude of the Coatesville move. It's an open and shut case. We know the when and where of the Coatesville move and we know how Coatesville changed relative to other stations in the region. The evidence for the West Chester move in 1970 is just as strong. Very easy to separate weather from station moves when you know how to do it.

-

Spooky Season (October Disco Thread)
Torch Tiger replied to Prismshine Productions's topic in New England
https://en.wikipedia.org/wiki/1804_New_England_hurricane wish we could gin up a cat 4-5 ish and roll the dice. -

2025-2026 ENSO
so_whats_happening replied to 40/70 Benchmark's topic in Weather Forecasting and Discussion
There is a fairly large system being modeled going into this weekend right over the warm pool region. I think there is forecasted 60-80knot winds already starting to show up across the area. Should definitely help continue carving out the cooler waters and moving that warm pool. As for the Atlantic there is still a decent NW Atlantic warm tongue around Nova Scotia so we should continue to see ridging potential in the region and add the risk of things at times connecting with the SE ridge. Im still rather hopeful that average snowfall can be achieved this year across many areas. RMM plots never fully grasp the intensity of such waves but regardless it should be pretty intense wave to start things off for fall. We are a little off where we were last year at this time for MJO but it looks to follow a similar path and intensity as we did through October last year. Here are the SST anomalies last year as we ended summer and went into fall. The PDO last year had a double dip take place and October values, at the time, were some of the lowest on record.
-
Spooky Season (October Disco Thread)
Torch Tiger replied to Prismshine Productions's topic in New England
Wanna sub for $5.95/mo? -
I do think the pattern coming up will favor slowly moving that warm pool in the central Pacific a bit further east with continued cooling influences east of Japan and along the west coast, at least for the next 2 weeks anyway.
-

E PA/NJ/DE Autumn 2025 Obs/Discussion
Hurricane Agnes replied to PhiEaglesfan712's topic in Philadelphia Region
Well I nickel and dimed my way to 0.38" yesterday with a 2nd round that took me to 0.32" from 0.30", and then another round to 0.38" for the day. This morning I had a surprising 0.08", giving me a grand total of almost 3/4" over 4 days (0.74") and 0.92" for the month so far. It bottomed out at 52 just after 6:30 this morning and hit 67 just before 3 pm for a high, after the skies cleared and the sun came out. Currently cloudy and 60 with dp 55. -
Blizzarcane!
-
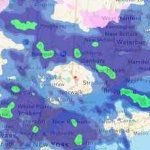
That was a very localized heavy snow event. The ol' upper level low surprise. That map there is closer to reality than the one I ridiculed in the previous post. LOL 6-10"? NO. Was maybe an inch or 2 here. It simply didn't do anything for most of the event and by the time it shifted over this way it rapidly weakened.
-

Spooky Season (October Disco Thread)
Go Kart Mozart replied to Prismshine Productions's topic in New England
I agree, not snow, but the end of the world as we know it....