All Activity
- Past hour
-
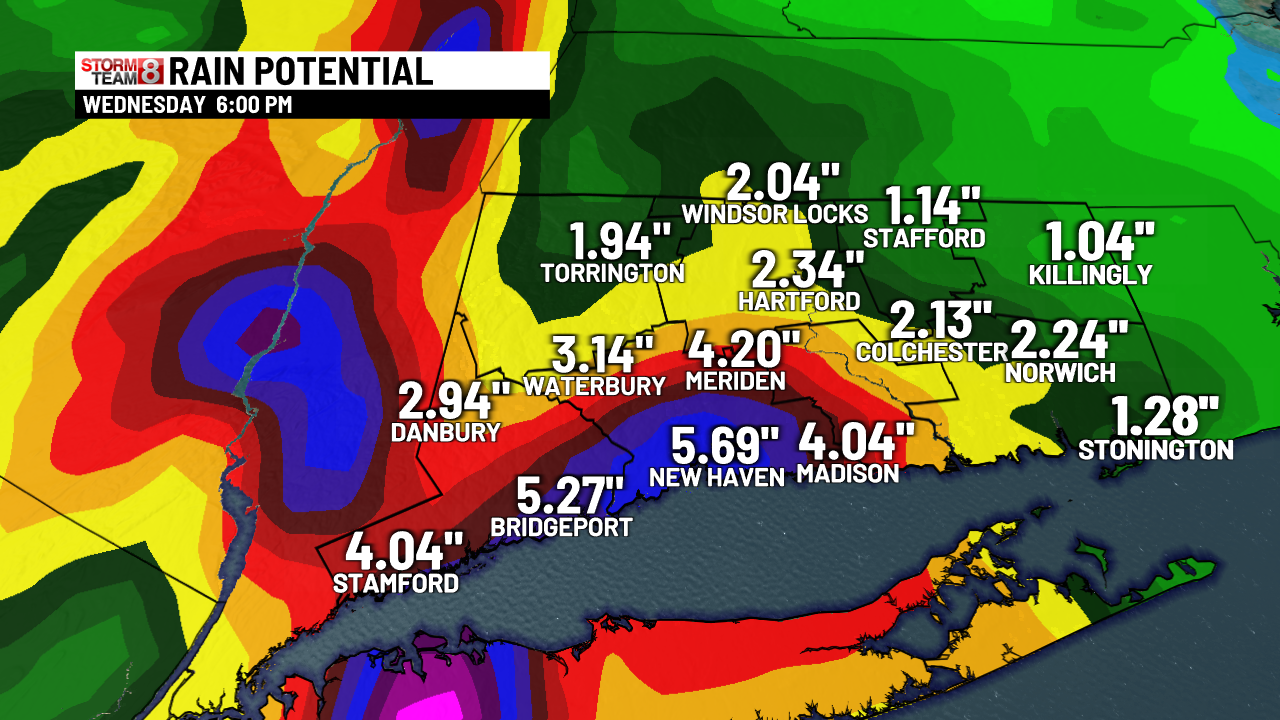
 Let's take one model and run w/ that. To show point totals when there is a lot a model disagreement as to how much and where is foolish. One should be drawing their own map manually and show something like 1-3" general and highlight heavier areas possible and say up to 5-6". That is most reasonable at this time. Like they learned nothing from the last event?
 -
Who gets the liter that he had in his mouth?
-
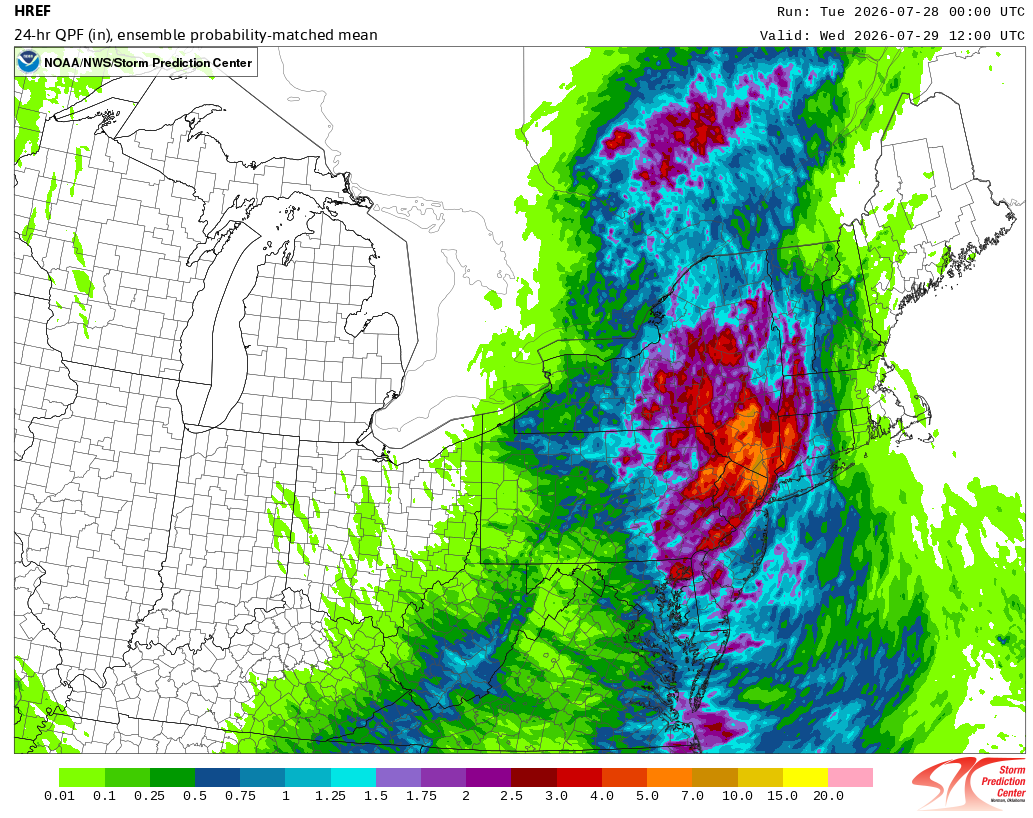
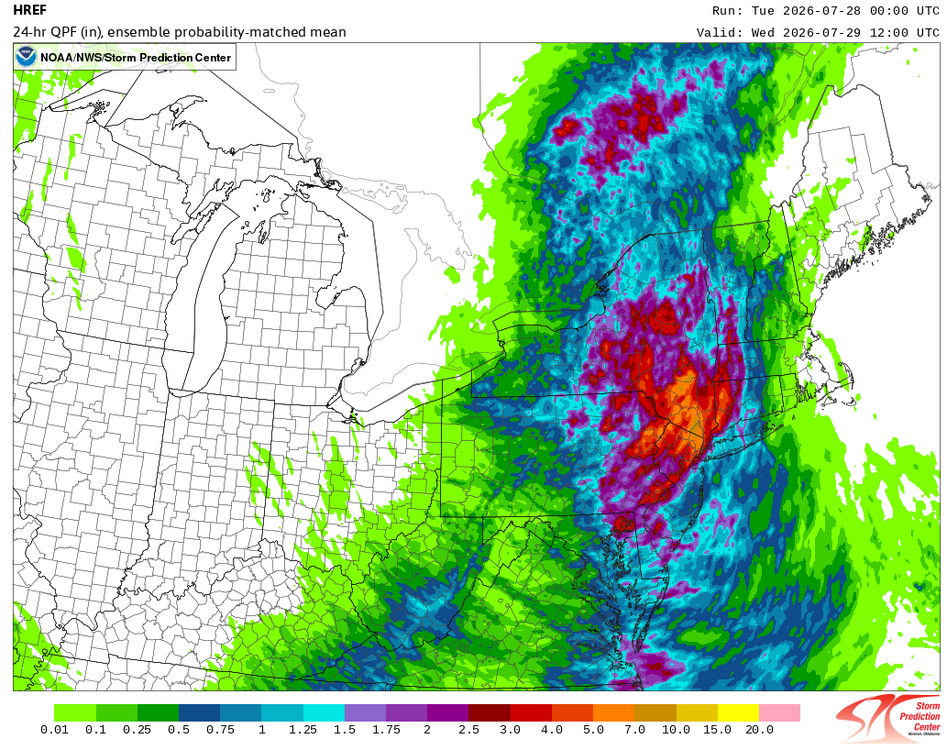
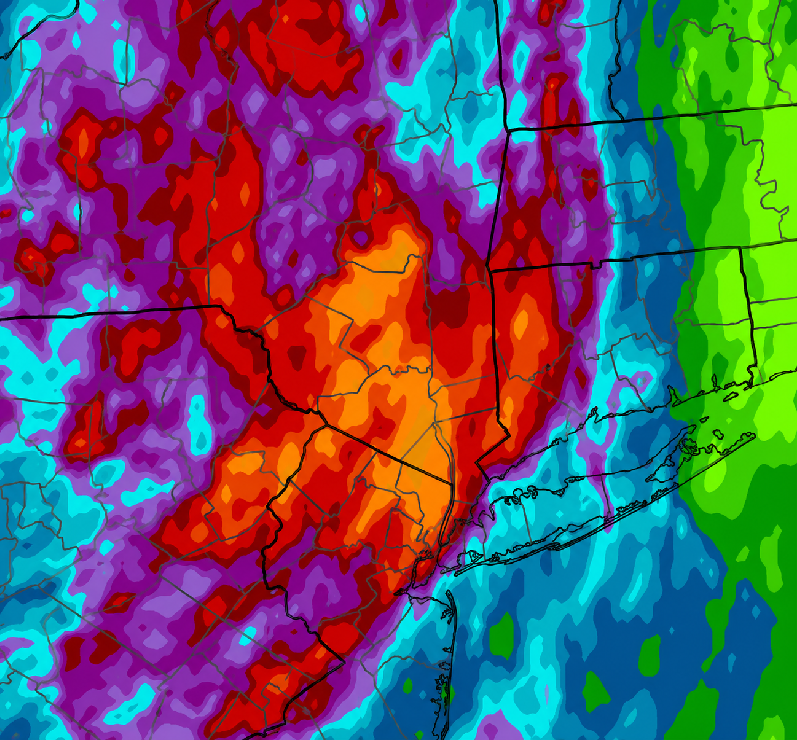
The 7/28 0z HREF:
-
Meteotsunami or seiche. Speed of storms is often key, but local bay/inlets can have odd things happen even w/o fast moving storms.
-
I see sun and some blue sky leaving work
-
HP intense tornado in the morning.
-
34 F for a low at Barre Falls MA 7/1/1988. Same time MWN had 4" of snow for it most snow so late.
-
 Dewy this AM. 68F currently. A full 16F higher than 24hr ago.
 -
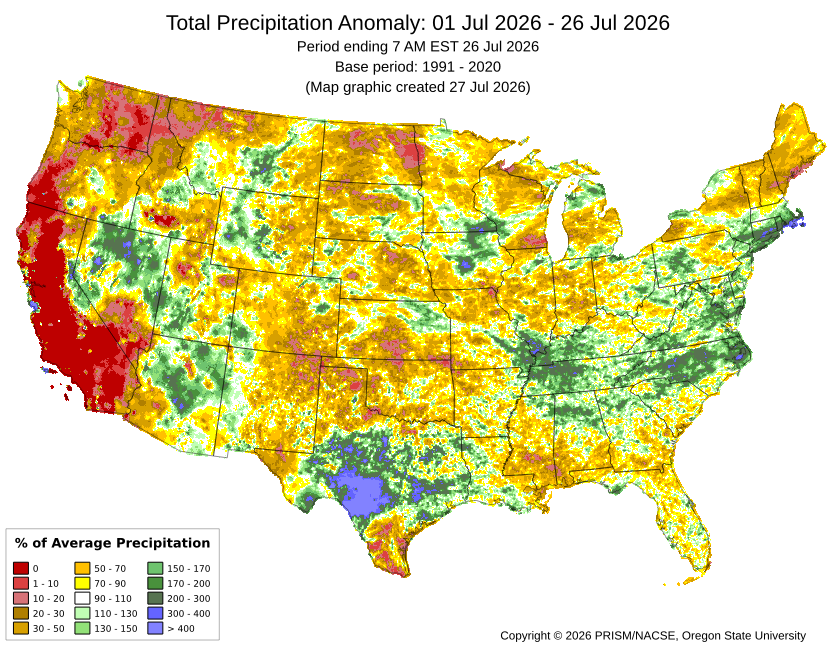
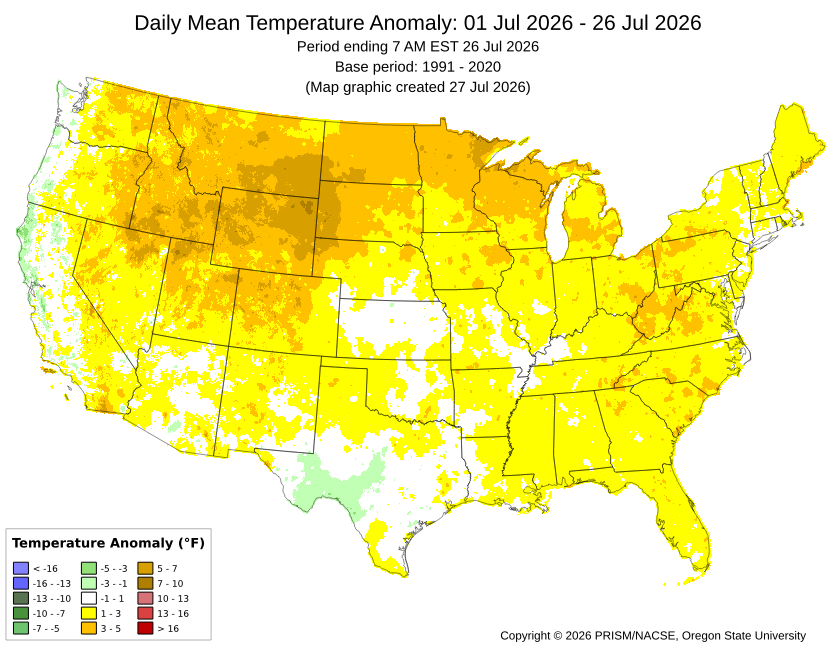
Our area will finish July much wetter than much of the CONUS which has been experiencing record heat and drought.
-
"Ever - in our life" Whose life? That is highly variable dependent on the person! Meaningless w/ context or standardization. Slicing and dicing down stats per day for any location you can find that has a record is bottomless pit. Always tons of stats like this, and when you consider how many wx parameters we have records for, and all the locations? Most of it is minutia or meaningless as to sensible wx impact, and yet the "race to the bottom" for content has resulted in this drivel.
-
 Somebody's all-in..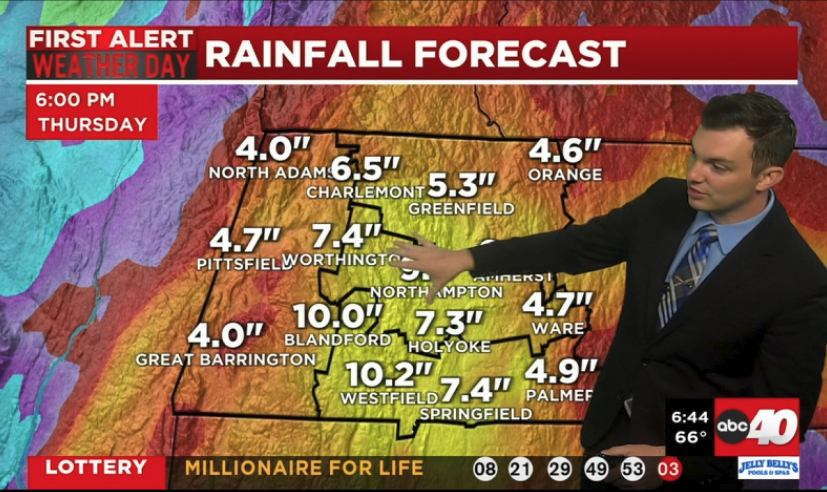
-
What about the 6.5" for Weymouth the HRRR has? Is that a garbage model as well?
-
Yes once again, duration. 6" in 48 hr is *not* the same as 6" in 6 hr! And w/ areas still w/ deficits, it mitigates things. Wrn and srn CT do has more of flood risk this time tho.
-
 Atmosphere certainly feels loaded.
 -
Similar totals and placement as the early July Rainer?
-

2026-2027 Super El Nino
bluewave replied to Stormchaserchuck1's topic in Weather Forecasting and Discussion
Just saying it’s going to be positive isn’t much of a stretch. But my examples of 2015-2016 and 2023-2024 both featured positive +PNA patterns. The magnitude and character of the positive is the question here which is a function of where the main Nino ridge and Aleutian trough complex becomes established. Plus we have the difference between the CPC PNA and the 500 mb PNA at times. Sometimes we get bootleg +PNA patterns like in January 2023 with a deep trough underneath the Canadian ridge out West which many consider a -PNA. We may have to be patient before getting something more closely resembling an El Niño pattern across the mid-latitudes of the Northern Hemisphere. - Today
-

Central PA Summer 2026 Discussion/Obs Thread
mahantango#1 replied to Voyager's topic in Upstate New York/Pennsylvania
.22 rain from a thunderstorm at around after 3am -
 Frcst less than 1". Shocking Sent from my SM-S921U using Tapatalk
 -
Hopefully we see some big storms today. After today we have several days of beautiful weather for August with highs in the 70s and lows in the 50s.
-
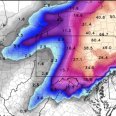
Central PA Summer 2026 Discussion/Obs Thread
pawatch replied to Voyager's topic in Upstate New York/Pennsylvania
Picked up over an 1” of rain this morning and still light rain. Also looks like we will have more rain later on today. Much Needed! -
Central PA Summer 2026 Discussion/Obs Thread
mahantango#1 replied to Voyager's topic in Upstate New York/Pennsylvania
Hazardous Weather Outlook National Weather Service State College PA 358 AM EDT Tue Jul 28 2026 PAZ004>006-010>012-017>019-024>028-033>037-041-042-045-046-049>053- 056-290800- Warren-McKean-Potter-Elk-Cameron-Northern Clinton-Clearfield- Northern Centre-Southern Centre-Cambria-Blair-Huntingdon-Mifflin- Juniata-Somerset-Bedford-Fulton-Franklin-Tioga-Northern Lycoming- Sullivan-Southern Clinton-Southern Lycoming-Union-Snyder-Montour- Northumberland-Columbia-Perry- 358 AM EDT Tue Jul 28 2026 This Hazardous Weather Outlook is for central Pennsylvania. .DAY ONE...Today and tonight. Scattered strong to severe thunderstorms, capable of damaging wind gusts and localized heavy rainfall of 1 to 2 inches per hour are possible today. -
Central PA Summer 2026 Discussion/Obs Thread
mahantango#1 replied to Voyager's topic in Upstate New York/Pennsylvania
Flood Watch National Weather Service State College PA 234 AM EDT Tue Jul 28 2026 PAZ057>059-063>066-290600- /O.NEW.KCTP.FA.A.0009.260728T0634Z-260729T0600Z/ /00000.0.ER.000000T0000Z.000000T0000Z.000000T0000Z.OO/ Dauphin-Schuylkill-Lebanon-Cumberland-Adams-York-Lancaster- Including the cities of Lancaster, Pottsville, Hershey, Gettysburg, Carlisle, York, Harrisburg, and Lebanon 234 AM EDT Tue Jul 28 2026 ...FLOOD WATCH IN EFFECT THROUGH LATE TONIGHT... * WHAT...Flash flooding caused by excessive rainfall is possible. * WHERE...A portion of central Pennsylvania, including the following counties, Adams, Cumberland, Dauphin, Lancaster, Lebanon, Schuylkill and York. * WHEN...Through late tonight. * IMPACTS...Excessive runoff may result in flooding of rivers, creeks, streams, and other low-lying and flood-prone locations. * ADDITIONAL DETAILS... - Multiple rounds of slow-moving and occasionally training heavy showers and thunderstorms will produce rainfall rates of up to 2 inches per hour leading to rapid runoff into low lying areas and small streams and creeks. - http://www.weather.gov/safety/flood PRECAUTIONARY/PREPAREDNESS ACTIONS... You should monitor later forecasts and be prepared to take action should Flash Flood Warnings be issued. -
 Garbage model. Although I still like SW CT Jack and a secondary one out east. Models did seem to back off a bit in wrn CT but it could easily come back so no need to knee jerk.
 -