All Activity
- Past hour
-

Augdewst 2026: Summer's Last Stand
weatherwiz replied to Prismshine Productions's topic in New England
Some knew -

Augdewst 2026: Summer's Last Stand
ineedsnow replied to Prismshine Productions's topic in New England
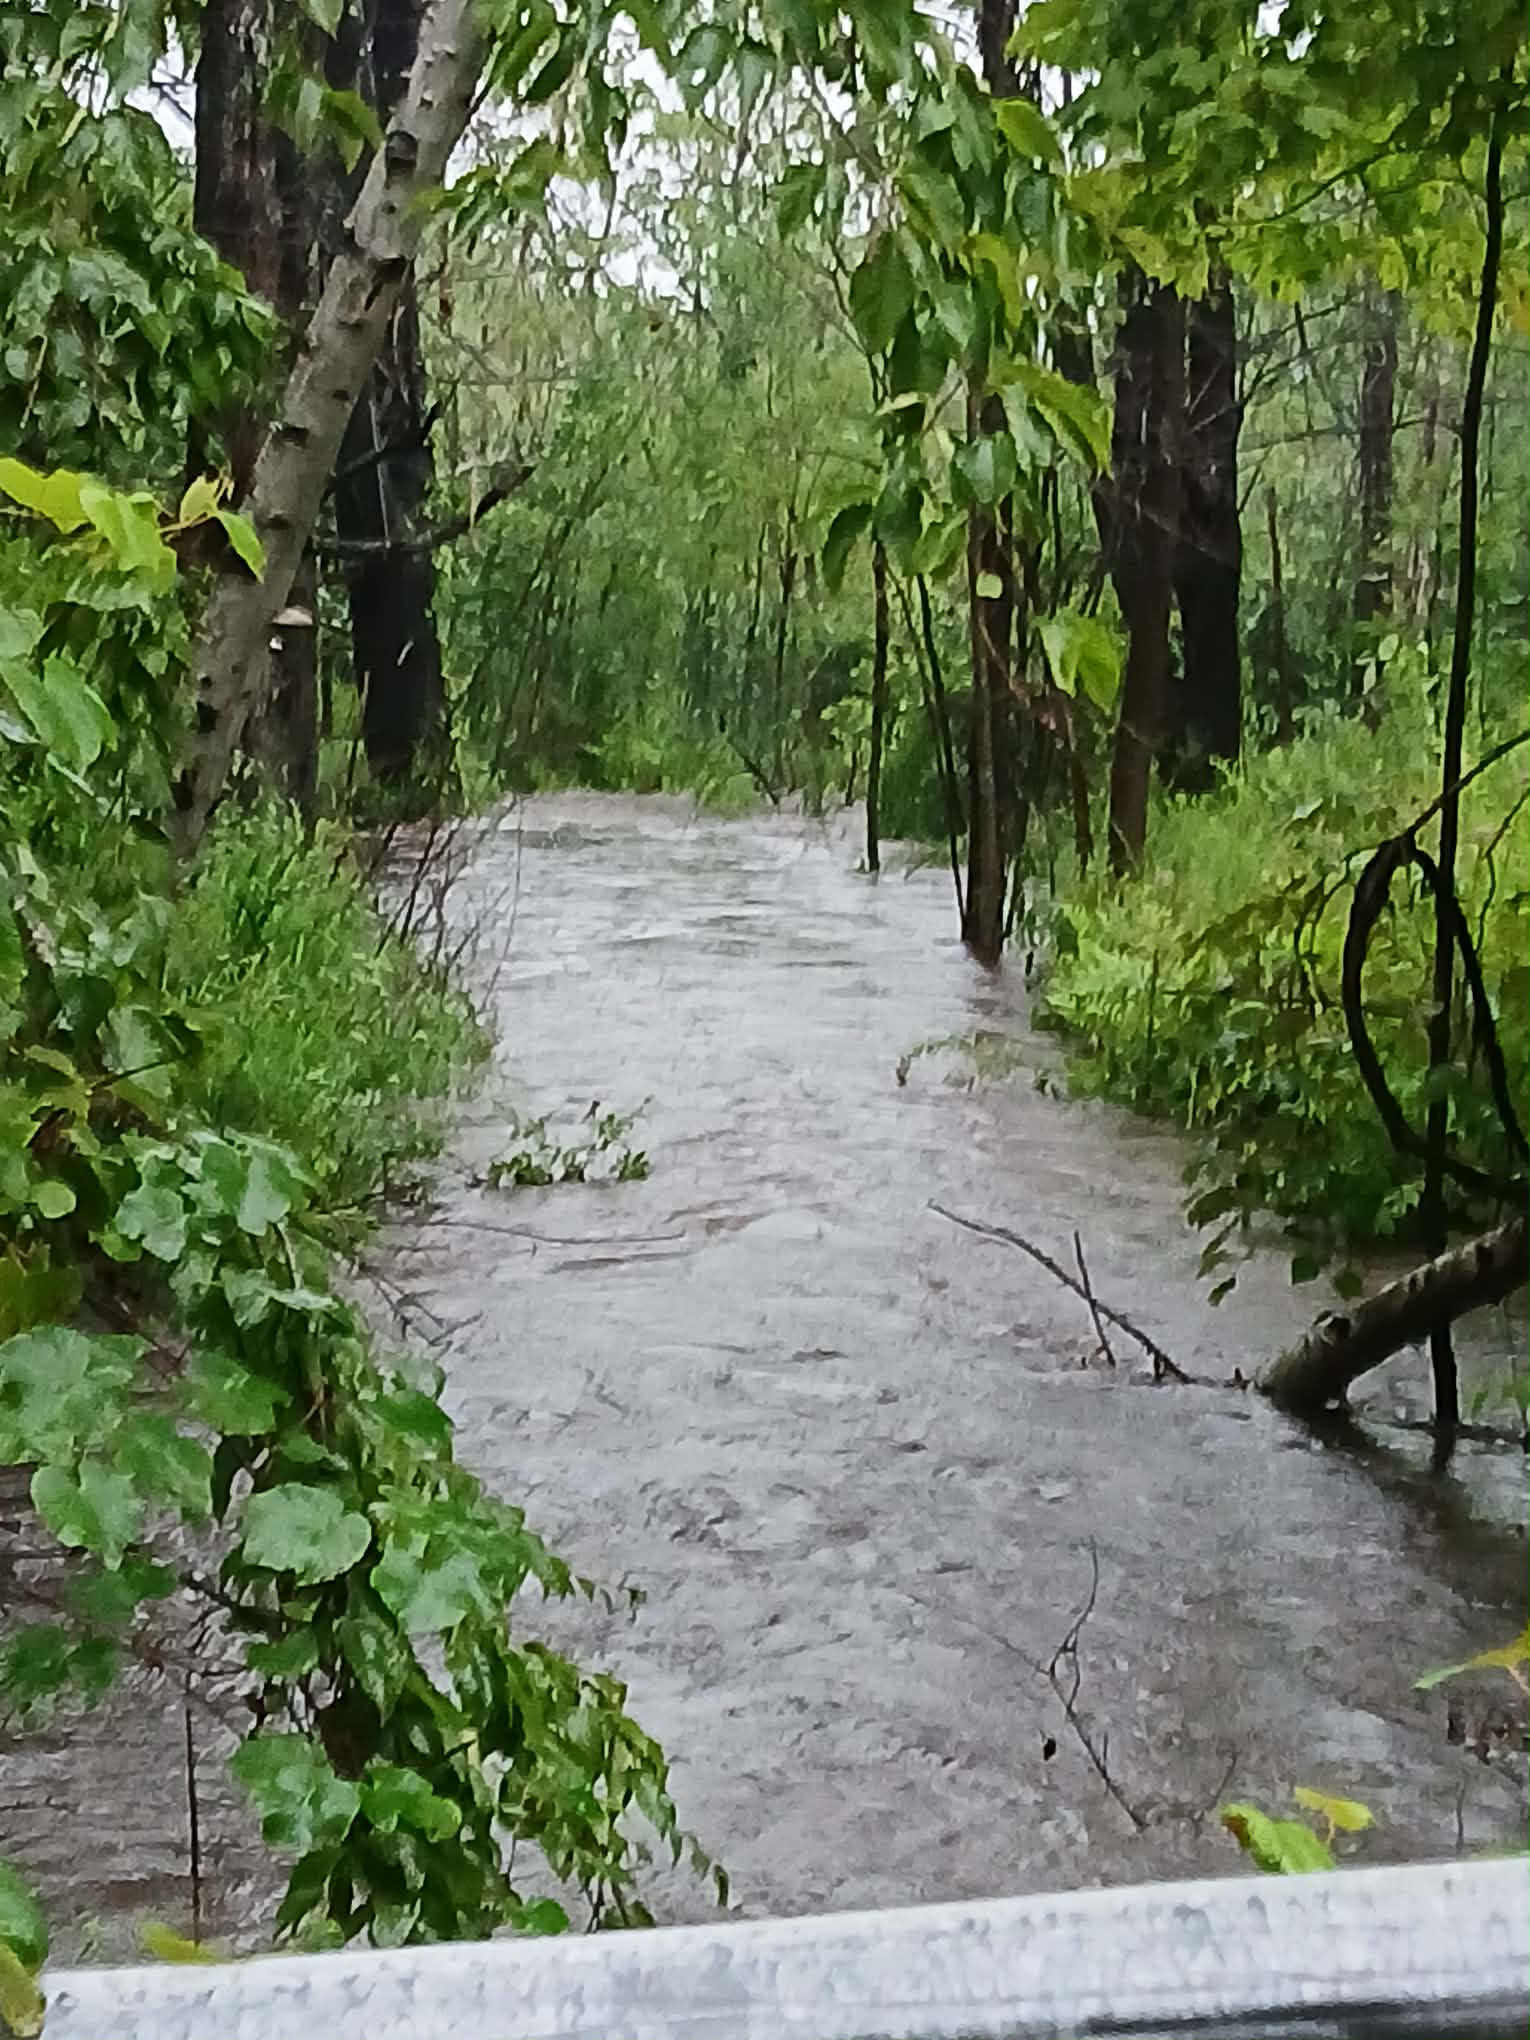
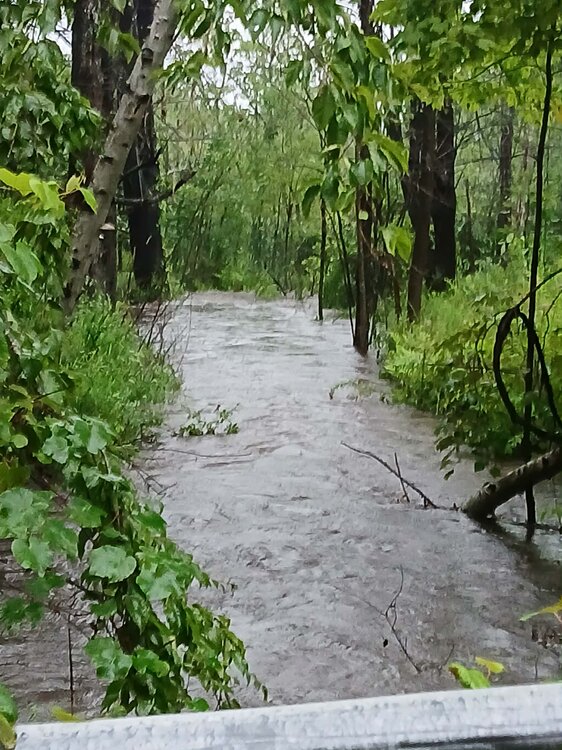
I was hoping for a quick spin up but nothing but torrential rain.and some wind.. started driving back and stopped at wachusett.. stream by the entrance is overflowing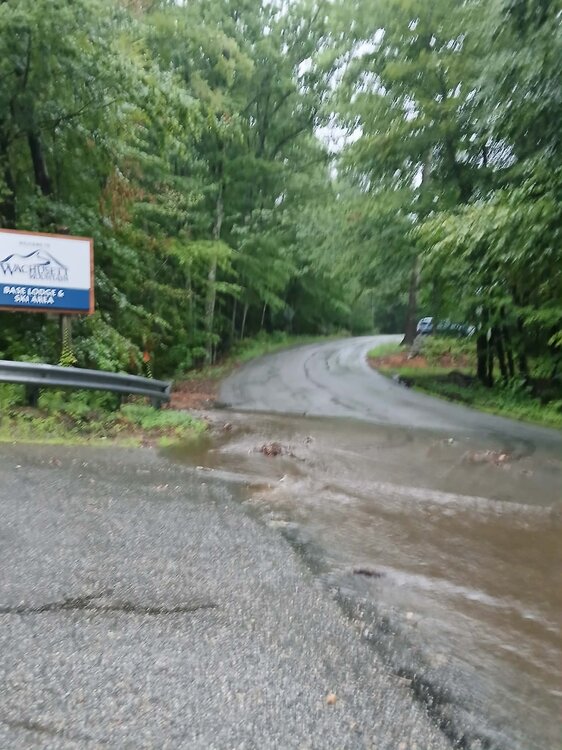
-

Augdewst 2026: Summer's Last Stand
Ginx snewx replied to Prismshine Productions's topic in New England
Dumping -

Augdewst 2026: Summer's Last Stand
CoastalWx replied to Prismshine Productions's topic in New England
Congrats oh yee of 3 wives on FFW next town over. -

Augdewst 2026: Summer's Last Stand
Chrisrotary12 replied to Prismshine Productions's topic in New England
Can’t wait for @512high next report. -
Newark has now received 1.67" of rain today. That breaks the August 3 daily record of 1.60" from 1885. As was the case with the most recent large rain event, the White Plains precipitation gauge is down. Although the data shows 0.04" on July 29 and 0.02" on July 30, those figures understate the actual figures, as the gauge was down for large stretches of rain.
-

Augdewst 2026: Summer's Last Stand
dendrite replied to Prismshine Productions's topic in New England
Raining again here. I’m satiated. Let’s keep the rest for CT so they can become a rainforest by March. -

Augdewst 2026: Summer's Last Stand
butterfish55 replied to Prismshine Productions's topic in New England
Working in Hyannis today. Lots of sun and blue skies approaching the bridges. Very breezy, feels like florida. -
Augdewst 2026: Summer's Last Stand
Chrisrotary12 replied to Prismshine Productions's topic in New England
Flash flooding warning alert made the whole family jump. -

E PA/NJ/DE Summer 2026 Obs/Discussion
Hurricane Agnes replied to PhiEaglesfan712's topic in Philadelphia Region
Round2 has intensified and has me up to over 1"/hr along with a thunderstorm. Have 1.33" in the bucket .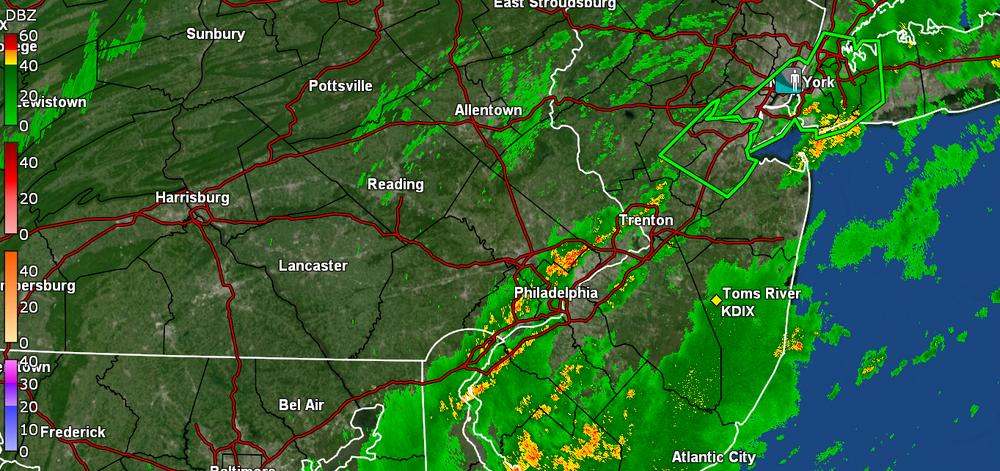
-
Augdewst 2026: Summer's Last Stand
CoastalWx replied to Prismshine Productions's topic in New England
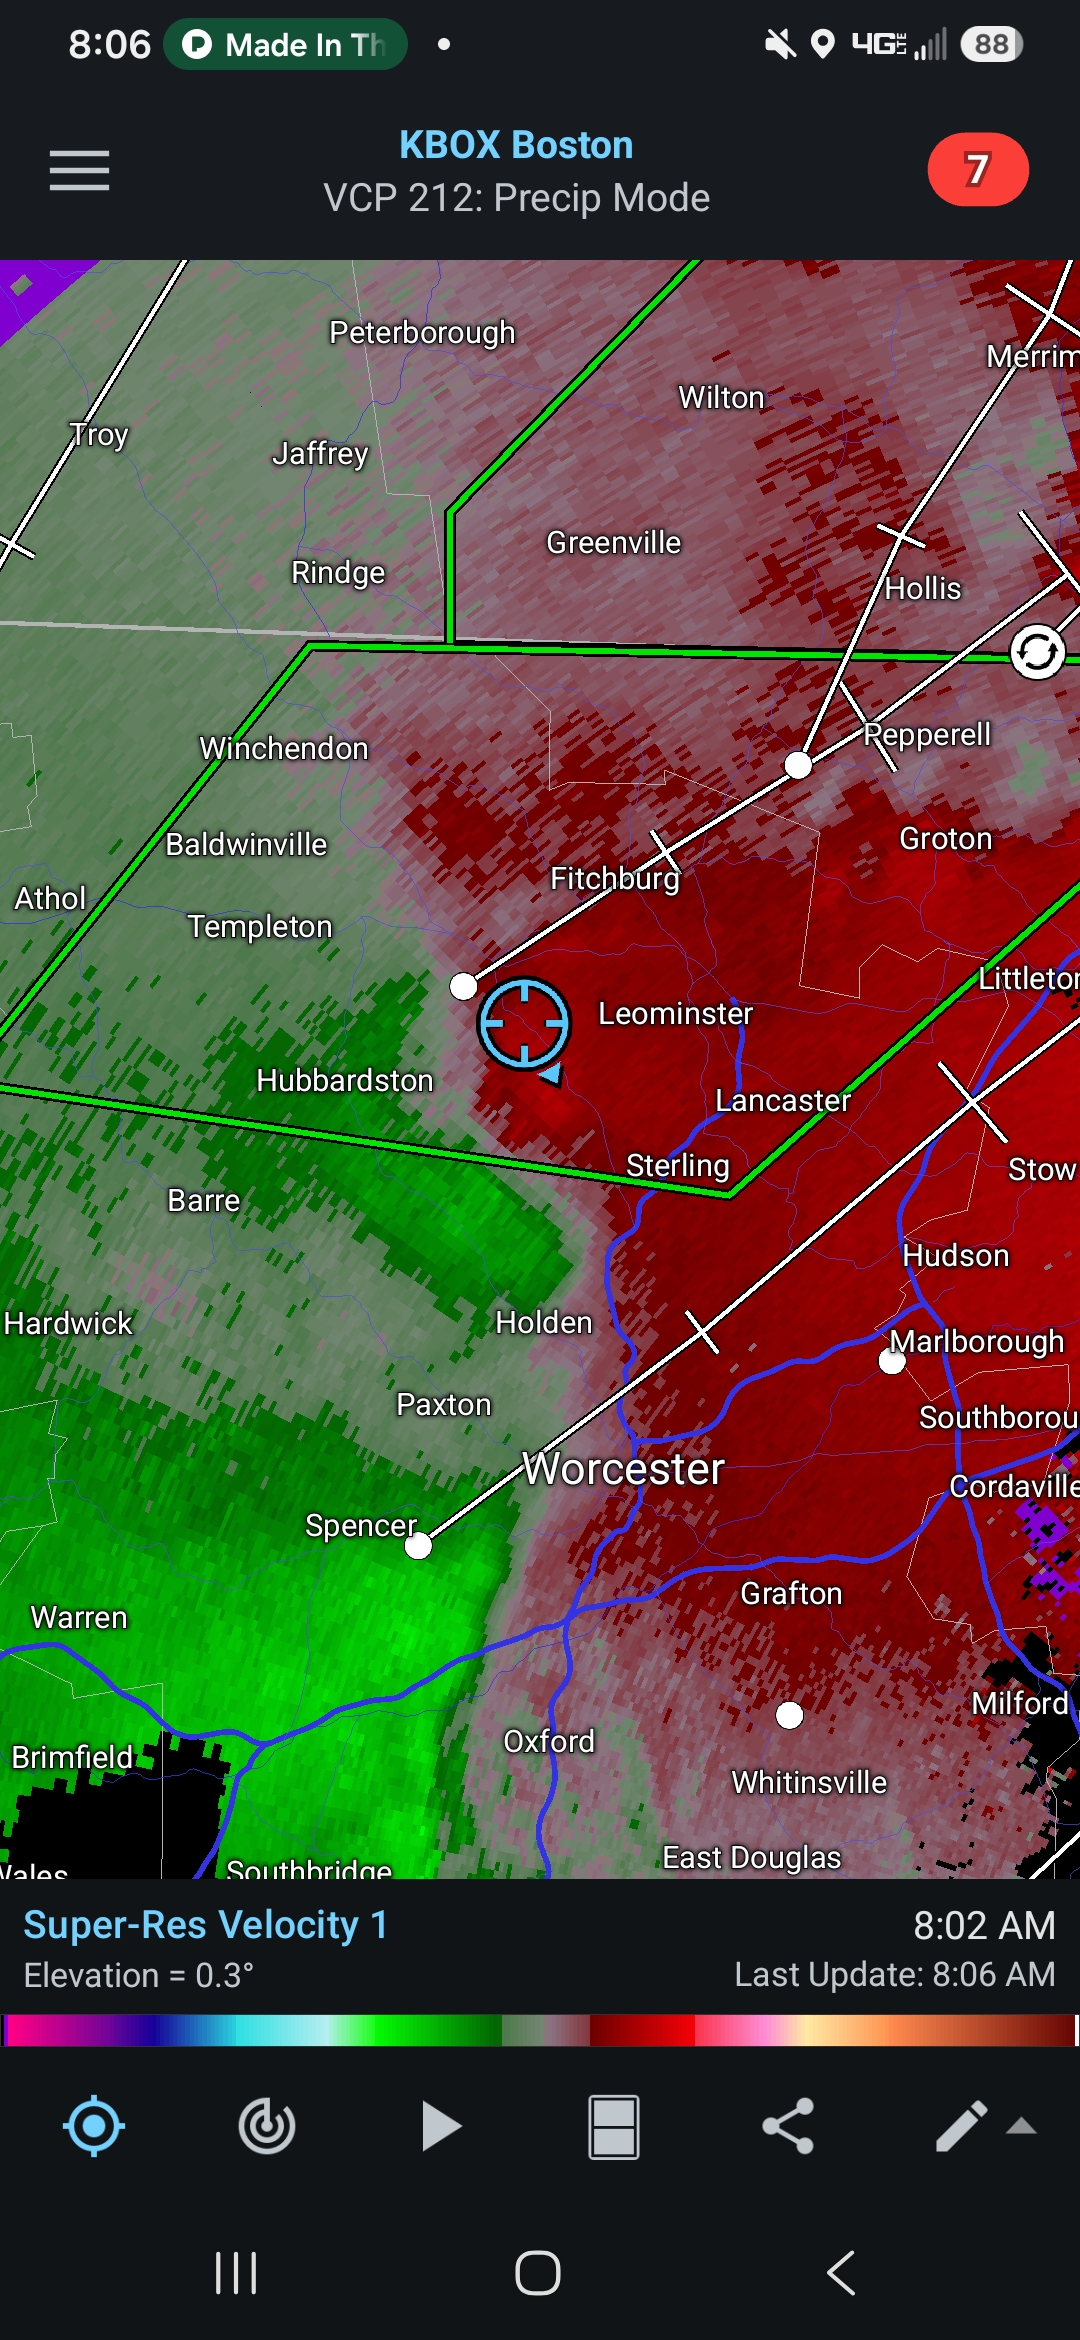
May have to watch SE CT and RI later if the Delmarva stuff gains ground. You can see the 850LLJ is ramping up. The rain seems to be on the western edge of it which makes sense because there would be convergence there. Pretty breezy here locally. FL vibe. -

Central PA Summer 2026 Discussion/Obs Thread
mahantango#1 replied to Voyager's topic in Upstate New York/Pennsylvania
1.21 rain fell yesterday and overnight. This rain was a much needed blessing. -

Chester County PA - Analytical Battle of Actual vs. Altered Climate Data
chubbs replied to ChescoWx's topic in Climate Change
The bulk of the post-war Coatesville cooling occurred in 1946 and 1947 which is consistent with a 1946 move. The cooling relative to West Chester and ABE also matches the timing and roughly 2F magnitude of the NCEI and Berkeley Earth bias adjustments that you posted above.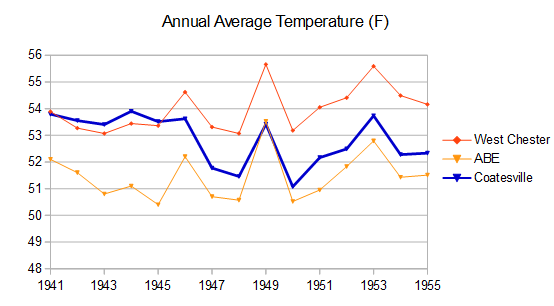
-

Augdewst 2026: Summer's Last Stand
Brian5671 replied to Prismshine Productions's topic in New England
We got slammed at 6am. Crazy rates. Enough already! -
Anything Slight Risk or higher would be great honestly. The worst flooding of my career was in a Slight Risk last July when inside the beltway got slammed.
-
Augdewst 2026: Summer's Last Stand
CoastalWx replied to Prismshine Productions's topic in New England
That Delmarva stuff might be river east. Think this morning stuff zapped some moisture for now. This morning stuff along LLJ. -
Picked up 0.03” (1.12” daily and MTD total) more yesterday evening but today has trended drier on models as the boundary sagged a little further south. With all the rain, it might be a blessing if we avoid a tropical system this year as grounds are completely saturated despite long term drought impacts. Earlier this summer I was adamant that we needed a tropical system to ease drought conditions but after the past month, it would likely be too much. What a crazy turnaround
-
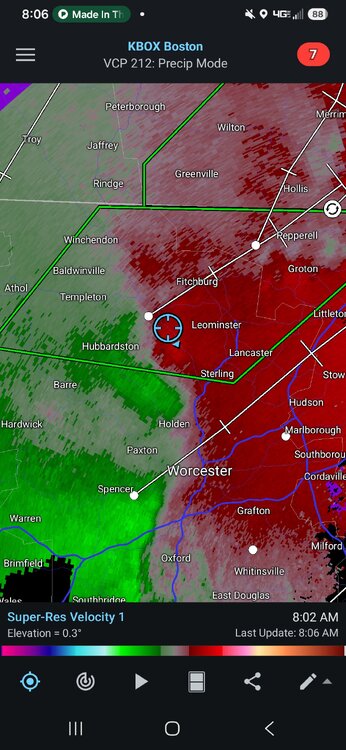
insane amt of rain here this AM. upton needed a watch here
-
The Franklin Institute and the airport getting close to 30 days with Harrison not far behind. 90° Day Data for January 1, 2026 through August 3, 2026 Click column heading to sort ascending, click again to sort descending. PHILADELPHIA INTL AP WBAN 28 PHILADELPHIA FRANKLIN INSTITUTE COOP 28 90° Day Data for January 1, 2026 through August 3, 2026 Click column heading to sort ascending, click again to sort descending. ESTELL MANOR COOP 27 HARRISON COOP 26
-
1.41 since midnight in holyoke, 73.7/71.8, peak rain rate 1.72in/h east of the river they's some serious wet.
-

2026-2027 Super El Nino
LakePaste25 replied to Stormchaserchuck1's topic in Weather Forecasting and Discussion
1972-1973 is the only super Nino analog we have of the -PDO not flipping into winter. However, the RONI peaked at +2.3 and we are potentially going much higher than that this time around, so it could be such an overwhelming force that it flips to + -
Been lucking out overnight near Berlin, Md. with very little to no rain since arriving Sunday. Excellent beach day on Sunday. Mostly overcast and humid this morning with a few peaks of sun, but dry so far. Hazardous weather statements locally for 3’-5’ waves, rough surf and rip currents.
-
2.3”
-
3+ more inches for the lawn, hoping that means the end of irrigation season (fingers crossed)
-

Augdewst 2026: Summer's Last Stand
Sey-Mour Snow replied to Prismshine Productions's topic in New England
There’s stuff all the way in the Delmarva headed this way , we will have rounds of downpours through this evening