All Activity
- Past hour
-
The key will be how much rain we get in early June. We probably make it back into the 80s between June 1st -10th. But we would probably need to dry out with more sun in order for the warm spots to get their first 90° of the season by June 15th. We are already running late on our first 90° day. First/Last Summary for NEWARK LIBERTY INTL AP, NJ Each section contains date and year of occurrence, value on that date. Click column heading to sort ascending, click again to sort descending. Minimum 04-07 (2010) 08-08 (2011) 69 Mean 05-18 09-09 113 Maximum 06-17 (2014) 10-02 (2019) 170 2024 05-02 (2024) 90 08-28 (2024) 95 117 2023 04-13 (2023) 92 09-08 (2023) 92 147 2022 05-21 (2022) 95 09-04 (2022) 93 105 2021 05-19 (2021) 91 09-15 (2021) 91 118 2020 06-06 (2020) 91 08-27 (2020) 93 81 2019 05-26 (2019) 90 10-02 (2019) 96 128 2018 05-02 (2018) 90 09-06 (2018) 98 126 2017 05-17 (2017) 92 09-25 (2017) 90 130 2016 05-25 (2016) 91 09-23 (2016) 90 120 2015 05-25 (2015) 90 09-09 (2015) 91 106 2014 06-17 (2014) 91 09-06 (2014) 95 80 2013 05-30 (2013) 93 09-11 (2013) 96 103 2012 05-28 (2012) 91 09-07 (2012) 90 101 2011 05-30 (2011) 92 08-08 (2011) 93 69 2010 04-07 (2010) 92 09-25 (2010) 90 170
-
I think Stonington, Pawcatuck, Westerly area is going to be the jackpot. Just a firehose down there.
-

2025-2026 ENSO
PhiEaglesfan712 replied to 40/70 Benchmark's topic in Weather Forecasting and Discussion
11-20 November 2019 (T15 coldest with 3 other years) 21-30 April 2018 (29th coldest) November 2018 (25th coldest famous for the mid-month snow event) June 2023 just missed out at T31 coldest -
50/41°F, Sun trying to make a rare appearance before the rain arrives.
-
Backlash showers! Yay!
-
Rain picked up a lot here now from the steady mist that was falling all morning. It was a joke. But, June is met summer, so things getting warm makes sense.
-
Interesting ... 2012 was one of if not the warmest total spring to summer transition years on record - least I thought it was...
-
I don't believe the recent winter hemisphere's would physically allow that to happen. This is happening now because the flow is slower ...everywhere. The entire manifold of the hemisphere still has energetics, and because the flow foot is lower, this allows for curvatures at smaller radii It's complex but we have to understand atmospheric motion in x, y and z coordinate system. The z is the omega term ( upward vs downward vertical motion )... x and y is the direction, w-e-n-s. When there is only so much uvm velocity available to rotating fields... this limits the amount of mass that can move up for inward moving air. Tornadoes, for example, rotate so fast because they have shit ton of vertical acceleration moving upwards - stretching the vortex in the vertical effectively speeds it up. Think figure-skater pulling their arms in, and the spin faster. Such that cyclonic motion has a relatively constant mass moving in the vertical. When x - y gradient is large --> faster flow of wind, but this exceeds the restoring mass moving upward; it can't flow in tighter curved space, because the mass moving in can't rise any faster. So instead of conserving the energy in the smaller scales, it ends up lengthening the long wave lengths with lots of jet velocity, and less small space curvatures - note, I did not say, "no" smaller space curvatures. We're dealing in offsets here... In recent years the gradient between ~30 N and 60 N has been extreme. This has power very strong westerlies through the deep tropospheric means. This has meant faster moving events. More sheared events. Event closed lows behavior more like "quasi" closed lows, because they move right along like rolling balls... These are just notable behaviors I'm listing...
-
What about top 11-30? Has the NE had any of those since 2015?
-
Gun to head I’ll say yes. Even if it’s 35-36° paws. I bet you were colder than that in 2012 too because of your station siting.
-
Looks like you might be the Jack spot
-
looks like radar is starting to fill in again as the ULL approaches
-
It's really hard to take (publicly accessible) LLM "science" seriously. Sure, there might be some specialized LLMs that the general public can't access that might be trustworthy. But Grok? No.
-
Could've used this pattern back in Jan-Feb with all these cutoff slow moving systems in April and May.
-
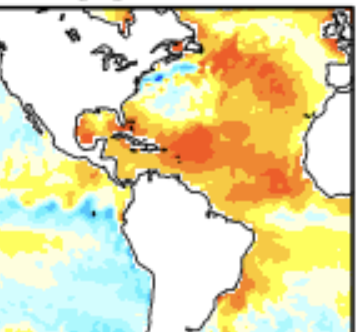
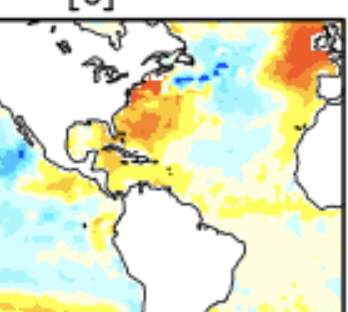
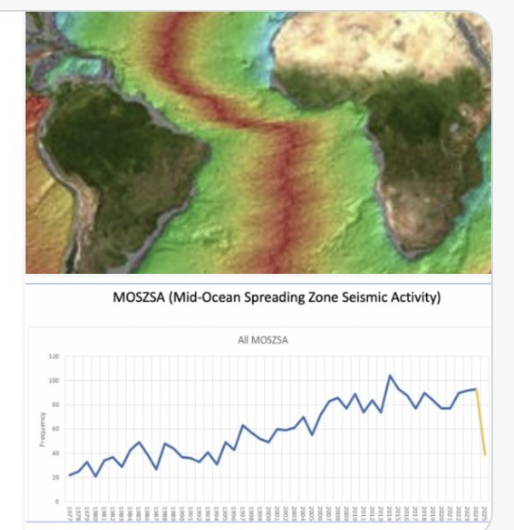
WxBell/JB continue to strongly push that underwater seismic activity has been an important factor in determining global SST anomalies and thus global air temps. JB asks AI (Grok) to assess I gave the charts below to Grok, 2024 SST, 2025 SST, the graphic of the mid ocean spreading zone and the recent drop off. Then I asked it this: Look at the difference in SST between this year and last year, and look at the rapid drop off in Mid Ocean spreading zone activity. What do you conclude based on this Grok Conclusion:The cooling of SST from 2024 to 2025, alongside the rapid drop-off in Mid-Ocean Spreading Zone Seismic Activity, indicates that the reduced tectonic activity is likely a key factor in the observed temperature change. The decrease in magma upwelling along the Mid-Atlantic Ridge has reduced the heat input into the ocean, leading to cooler SSTs in 2025 compared to 2024. Other factors like ocean circulation or climate variability may also contribute, but the timing of the MOSZSA drop aligns closely with the SST cooling, supporting a direct geological influence. But keep in mind that Grok has in previous JB posts insisted that the number of hydrothermal vents needs to be like a billion+ to have a large enough influence like Dr. Viterito has been suggesting. There are only like a few thousand at most that have been discovered. Let’s say 10K max: https://en.m.wikipedia.org/wiki/Hydrothermal_vent Even if we up the # of vents to a million, that would still be far too small. Dr. Spencer flat out doesn’t believe that undersea geothermal can possibly be a significant factor: https://www.drroyspencer.com/2024/01/how-much-ocean-heating-is-due-to-deep-sea-hydrothermal-vents/
-
Nantucket gusting to 45mph and increasing hourly. It’s out there, just to our east. Personally I’ll pass on winds like that this time of year. It would just make a mess.
-
The coldest departures have been finding a way to miss the Northeast like with a +PNA in January 2025 and a -PNA in February 2021. Our last top 10 coldest month back in February 2015 was a strong +NAO. But if the cold pools were bigger in January 2025 and February 2021, then the Northeast would have been much colder. February 1979 was one of the lowest February -PNAs at -1.82 and still stands as the coldest 2 week period since the 1960s on Long Island. Minimum 14-Day Mean Avg Temperature for ISLIP-LI MACARTHUR AP, NY Click column heading to sort ascending, click again to sort descending. 1 11.4 1979-02-06 through 1979-02-19 0 2 11.5 1979-02-07 through 1979-02-20 0 3 11.9 1979-02-05 through 1979-02-18 0 4 12.5 1979-02-08 through 1979-02-21 0 5 13.4 1979-02-04 through 1979-02-17 0 6 13.8 1979-02-09 through 1979-02-22 0 7 14.6 1967-12-31 through 1968-01-13 0 8 14.8 1967-12-30 through 1968-01-12 0 9 15.0 1979-02-03 through 1979-02-16 0 10 15.4 1979-02-10 through 1979-02-23 0
-
Absolutely pouring again down here.
-

Central PA Spring 2025
Mount Joy Snowman replied to canderson's topic in Upstate New York/Pennsylvania
You tell that..........ah nevermind -
And 48 right now is highly below average, much more so than some 80's in June.
-
All the 12Z models keep it dry throughout the 3 day holiday weekend. Rain chances on Tuesday GFS and Canadian. EURO delays any rain until Wed. this run.
-
No sun here today. Have been socked in with periods of light rain and mist all morning. Some more appreciable showers moving in for the afternoon. 59°.
-
.84 inches here so far. Radar looks like it’s gonna be a New London county on east kinda storm.
-
Not in early June. Mid to upper 80s is decently above average.
- Today
-
But the normal highs for the for the first week of June are still in the upper 70s.