All Activity
- Past hour
-

July 2025 Obs/Disco ... possible historic month for heat
RUNNAWAYICEBERG replied to Typhoon Tip's topic in New England
Yawn… -
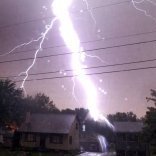
Business trip in ft Lauderdale. Entire sky lit up. I'm weening out and customers are like this is every night all summer . Once maybe twice a summer we get a coastal light show. .
-

Central PA Summer 2025
Mount Joy Snowman replied to Voyager's topic in Upstate New York/Pennsylvania
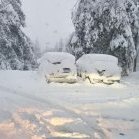
Saw that. Not great. Looks like a little over 3” for me thus far as I head to bed. More likely overnight. Official tally in the morning. Finally got the kids and dogs settled. Night, all. -

E PA/NJ/DE Summer 2025 Obs/Discussion
LVLion77 replied to Hurricane Agnes's topic in Philadelphia Region
I have 0.35” from multiple rounds this evenung. I was hoping to hit 5” for the month but will fall just short. . -
storms have been constantly avoiding this location after a couple good hits earlier this month. time for it to reverse.
-
E PA/NJ/DE Summer 2025 Obs/Discussion
KamuSnow replied to Hurricane Agnes's topic in Philadelphia Region
This last batch has been carrying on for a while now. Steady rain, lots of lightning and thunder, for the last hour. Letting up now but did pick up 0.40" of rain from it. -
Severe thunderstorm warning here, a rather pretty nasty storm. Mount Holly did well yesterday with a high probability of storms in NE MD and Northern De. today despite the cams. Beneficial rains for the garden and the lawn.
-
More storms to the northwest. Another shut-out in the books. The last few days have been classic Stephens City.
-
Certainly was a very impressive period, with departures in excess of 8F in spots. I wonder if it would be possible to see such large deviations in a summer month for a full 4 weeks. That would be nuts!
-

2025-2026 Winter Speculation Thread
KakashiHatake2000 replied to Carvers Gap's topic in Tennessee Valley
oh okay gotcha thank you -
Me neither. Bizarre stuff. I am up to .15” now with a little band that went through. CXY is at ,2” for the day too.
-
2013-14 and 2014-15.
-
Highs: TEB: 95 PHL: 94 TTN: 93 EWR: 93 New Brnswck: 92 LGA: 91 JFK: 90 NYC: 90 ISP: 89 ACY: 89 BLM: 88 * missing readings ACY:
-
Lebanon is now up to almost 5” of rain on the day and more in the queue it appears .
-
92 high here on si today...missed the rain again, just 0.04"... 1.47" for month .
-

July 2025 Discussion-OBS - seasonable summer variability
TheClimateChanger replied to wdrag's topic in New York City Metro
This June was miles hotter at Charlotteburg Reservoir than anything observed in 1980. Looks like in 1980, you could beat the heat by traveling an hour or so outside the urban heat island, while in 2025, the temperatures are much more uniform even way out in Passaic County. Climatological Data for CHARLOTTEBURG RESERVOIR, NJ - June 2025 Click column heading to sort ascending, click again to sort descending. Sum 2372 1802 - - 47 190 1.47 0.0 - Average 79.1 60.1 69.6 2.3 - - - - 0.0 Normal 77.8 56.7 67.3 - 51 118 4.85 M - Above Normals represent the month through 2025-06-30. 2025-06-01 62 46 54.0 -9.2 11 0 M 0.0 0 2025-06-02 65 43 54.0 -9.5 11 0 0.01 M 0 2025-06-03 71 45 58.0 -5.7 7 0 0.00 0.0 0 2025-06-04 80 50 65.0 1.0 0 0 0.00 0.0 0 2025-06-05 86 58 72.0 7.7 0 7 0.00 0.0 0 2025-06-06 89 64 76.5 11.9 0 12 0.00 0.0 0 2025-06-07 86 62 74.0 9.1 0 9 M 0.0 0 2025-06-08 76 58 67.0 1.8 0 2 M 0.0 0 2025-06-09 76 58 67.0 1.5 0 2 M M 0 2025-06-10 65 58 61.5 -4.3 3 0 0.57 M M 2025-06-11 77 55 66.0 -0.1 0 1 0.01 M M 2025-06-12 80 62 71.0 4.6 0 6 0.00 M M 2025-06-13 87 60 73.5 6.8 0 9 0.00 M M 2025-06-14 80 59 69.5 2.6 0 5 0.02 M M 2025-06-15 66 56 61.0 -6.2 4 0 0.04 M M 2025-06-16 62 56 59.0 -8.5 6 0 0.01 M M 2025-06-17 64 59 61.5 -6.3 3 0 0.07 M M 2025-06-18 66 60 63.0 -5.1 2 0 0.21 M M 2025-06-19 82 65 73.5 5.2 0 9 0.39 M M 2025-06-20 88 64 76.0 7.4 0 11 0.07 M M 2025-06-21 82 66 74.0 5.1 0 9 M M M 2025-06-22 87 72 79.5 10.4 0 15 M M M 2025-06-23 87 69 78.0 8.6 0 13 M M 0 2025-06-24 97 71 84.0 14.4 0 19 0.00 0.0 0 2025-06-25 97 71 84.0 14.2 0 19 0.00 0.0 0 2025-06-26 95 72 83.5 13.4 0 19 0.00 M M 2025-06-27 76 61 68.5 -1.8 0 4 0.03 M M 2025-06-28 70 59 64.5 -6.0 0 0 0.04 M M 2025-06-29 84 61 72.5 1.8 0 8 0.00 M M 2025-06-30 89 62 75.5 4.6 0 11 0.00 M M -
July 2025 Discussion-OBS - seasonable summer variability
TheClimateChanger replied to wdrag's topic in New York City Metro
Climatological Data for CHARLOTTEBURG RESERVOIR, NJ - June 1980 Click column heading to sort ascending, click again to sort descending. Sum 2187 1486 - - 151 43 2.99 0.0 - Average 72.9 49.5 61.2 -6.1 - - - - 0.0 Normal 77.8 56.7 67.3 - 51 118 4.85 M - 1980-06-01 71 56 63.5 0.3 1 0 0.30 0.0 0 1980-06-02 77 60 68.5 5.0 0 4 0.31 0.0 0 1980-06-03 76 59 67.5 3.8 0 3 0.02 0.0 0 1980-06-04 79 57 68.0 4.0 0 3 0.60 0.0 0 1980-06-05 66 47 56.5 -7.8 8 0 0.00 0.0 0 1980-06-06 69 41 55.0 -9.6 10 0 0.00 0.0 0 1980-06-07 71 51 61.0 -3.9 4 0 0.32 0.0 0 1980-06-08 69 57 63.0 -2.2 2 0 0.09 0.0 0 1980-06-09 75 37 56.0 -9.5 9 0 0.23 0.0 0 1980-06-10 55 43 49.0 -16.8 16 0 0.37 0.0 0 1980-06-11 58 34 46.0 -20.1 19 0 0.02 0.0 0 1980-06-12 59 35 47.0 -19.4 18 0 0.00 0.0 0 1980-06-13 68 42 55.0 -11.7 10 0 0.00 0.0 0 1980-06-14 73 42 57.5 -9.4 7 0 0.00 0.0 0 1980-06-15 79 49 64.0 -3.2 1 0 T 0.0 0 1980-06-16 79 52 65.5 -2.0 0 1 0.05 0.0 0 1980-06-17 67 45 56.0 -11.8 9 0 0.00 0.0 0 1980-06-18 71 43 57.0 -11.1 8 0 0.00 0.0 0 1980-06-19 70 44 57.0 -11.3 8 0 0.00 0.0 0 1980-06-20 74 49 61.5 -7.1 3 0 0.07 0.0 0 1980-06-21 63 53 58.0 -10.9 7 0 T 0.0 0 1980-06-22 72 44 58.0 -11.1 7 0 0.00 0.0 0 1980-06-23 77 45 61.0 -8.4 4 0 0.00 0.0 0 1980-06-24 82 54 68.0 -1.6 0 3 0.00 0.0 0 1980-06-25 85 64 74.5 4.7 0 10 0.00 0.0 0 1980-06-26 84 56 70.0 -0.1 0 5 0.00 0.0 0 1980-06-27 82 59 70.5 0.2 0 6 0.00 0.0 0 1980-06-28 86 53 69.5 -1.0 0 5 0.00 0.0 0 1980-06-29 75 57 66.0 -4.7 0 1 0.00 0.0 0 1980-06-30 75 58 66.5 -4.4 0 2 0.61 0.0 0 Climatological Data for CHARLOTTEBURG RESERVOIR, NJ - July 1980 Click column heading to sort ascending, click again to sort descending. Sum 2496 1806 - - 15 157 3.15 0.0 - Average 80.5 58.3 69.4 -2.7 - - - - 0.0 Normal 82.9 61.4 72.1 - 6 228 4.59 M - 1980-07-01 74 54 64.0 -7.0 1 0 0.01 0.0 0 1980-07-02 78 54 66.0 -5.2 0 1 0.00 0.0 0 1980-07-03 75 62 68.5 -2.9 0 4 0.13 0.0 0 1980-07-04 71 60 65.5 -6.0 0 1 0.02 0.0 0 1980-07-05 82 54 68.0 -3.7 0 3 0.00 0.0 0 1980-07-06 81 58 69.5 -2.3 0 5 1.02 0.0 0 1980-07-07 70 46 58.0 -13.9 7 0 0.00 0.0 0 1980-07-08 75 52 63.5 -8.5 1 0 0.00 0.0 0 1980-07-09 79 58 68.5 -3.6 0 4 T 0.0 0 1980-07-10 81 61 71.0 -1.2 0 6 0.00 0.0 0 1980-07-11 80 61 70.5 -1.8 0 6 0.00 0.0 0 1980-07-12 80 60 70.0 -2.3 0 5 0.21 0.0 0 1980-07-13 73 49 61.0 -11.4 4 0 0.00 0.0 0 1980-07-14 78 48 63.0 -9.4 2 0 0.00 0.0 0 1980-07-15 83 55 69.0 -3.5 0 4 0.00 0.0 0 1980-07-16 83 66 74.5 2.0 0 10 0.41 0.0 0 1980-07-17 88 68 78.0 5.5 0 13 0.01 0.0 0 1980-07-18 84 62 73.0 0.5 0 8 0.11 0.0 0 1980-07-19 84 59 71.5 -1.0 0 7 0.00 0.0 0 1980-07-20 85 62 73.5 1.0 0 9 0.00 0.0 0 1980-07-21 91 69 80.0 7.5 0 15 0.00 0.0 0 1980-07-22 93 65 79.0 6.5 0 14 0.00 0.0 0 1980-07-23 86 63 74.5 2.0 0 10 0.62 0.0 0 1980-07-24 78 55 66.5 -5.9 0 2 0.00 0.0 0 1980-07-25 80 52 66.0 -6.4 0 1 0.00 0.0 0 1980-07-26 84 56 70.0 -2.3 0 5 0.00 0.0 0 1980-07-27 85 59 72.0 -0.3 0 7 0.00 0.0 0 1980-07-28 82 58 70.0 -2.2 0 5 0.00 0.0 0 1980-07-29 78 61 69.5 -2.7 0 5 0.08 0.0 0 1980-07-30 75 63 69.0 -3.1 0 4 0.53 0.0 0 1980-07-31 80 56 68.0 -4.0 0 3 0.00 0.0 0 Climatological Data for CHARLOTTEBURG RESERVOIR, NJ - August 1980 Click column heading to sort ascending, click again to sort descending. Sum 2460 1785 - - 20 135 1.81 0.0 - Average 79.4 57.6 68.5 -1.9 - - - - 0.0 Normal 81.3 59.5 70.4 - 13 181 4.33 M - 1980-08-01 79 59 69.0 -3.0 0 4 0.00 0.0 0 1980-08-02 80 62 71.0 -0.9 0 6 0.00 0.0 0 1980-08-03 83 62 72.5 0.7 0 8 1.14 0.0 0 1980-08-04 83 63 73.0 1.3 0 8 0.00 0.0 0 1980-08-05 84 63 73.5 1.8 0 9 0.00 0.0 0 1980-08-06 89 64 76.5 4.9 0 12 0.10 0.0 0 1980-08-07 82 59 70.5 -1.0 0 6 0.00 0.0 0 1980-08-08 84 63 73.5 2.1 0 9 T 0.0 0 1980-08-09 86 67 76.5 5.2 0 12 0.26 0.0 0 1980-08-10 83 55 69.0 -2.2 0 4 0.00 0.0 0 1980-08-11 78 56 67.0 -4.1 0 2 0.07 0.0 0 1980-08-12 80 66 73.0 2.0 0 8 0.02 0.0 0 1980-08-13 76 55 65.5 -5.4 0 1 0.00 0.0 0 1980-08-14 76 53 64.5 -6.3 0 0 0.00 0.0 0 1980-08-15 76 55 65.5 -5.2 0 1 T 0.0 0 1980-08-16 76 55 65.5 -5.1 0 1 0.04 0.0 0 1980-08-17 67 47 57.0 -13.5 8 0 0.00 0.0 0 1980-08-18 76 50 63.0 -7.3 2 0 0.00 0.0 0 1980-08-19 71 55 63.0 -7.2 2 0 0.04 0.0 0 1980-08-20 78 58 68.0 -2.1 0 3 0.13 0.0 0 1980-08-21 70 54 62.0 -7.9 3 0 0.00 0.0 0 1980-08-22 67 57 62.0 -7.8 3 0 T 0.0 0 1980-08-23 72 53 62.5 -7.1 2 0 0.01 0.0 0 1980-08-24 80 51 65.5 -4.0 0 1 0.00 0.0 0 1980-08-25 81 53 67.0 -2.3 0 2 0.00 0.0 0 1980-08-26 83 52 67.5 -1.6 0 3 0.00 0.0 0 1980-08-27 86 56 71.0 2.0 0 6 0.00 0.0 0 1980-08-28 86 63 74.5 5.7 0 10 0.00 0.0 0 1980-08-29 85 57 71.0 2.4 0 6 0.00 0.0 0 1980-08-30 80 59 69.5 1.1 0 5 0.00 0.0 0 1980-08-31 83 63 73.0 4.8 0 8 0.00 0.0 0 Reliable observation times are not available prior to 1982. -
There were torrential downpours in Harrisburg at my office today. No idea how @canderson somehow, someway, got missed by the rain today…
-
July 2025 Discussion-OBS - seasonable summer variability
TheClimateChanger replied to wdrag's topic in New York City Metro
I don't know the observations from Jersey City and Passaic County don't strike me as very warm for those years. If there was a Sonoran heat release, it must have skipped over those areas. Climatological Data for JERSEY CITY, NJ - June 1980 Click column heading to sort ascending, click again to sort descending. Sum 2216 1716 - 67 91 2.73 0.0 - Average 73.9 57.2 65.5 - - - - 0.0 Normal M M M M M M M - 1980-06-01 81 62 71.5 0 7 T 0.0 0 1980-06-02 79 65 72.0 0 7 0.00 0.0 0 1980-06-03 82 65 73.5 0 9 1.25 0.0 0 1980-06-04 72 59 65.5 0 1 0.00 0.0 0 1980-06-05 71 55 63.0 2 0 0.00 0.0 0 1980-06-06 69 53 61.0 4 0 T 0.0 0 1980-06-07 74 60 67.0 0 2 0.47 0.0 0 1980-06-08 74 50 62.0 3 0 0.52 0.0 0 1980-06-09 62 44 53.0 12 0 0.47 0.0 0 1980-06-10 58 49 53.5 11 0 0.00 0.0 0 1980-06-11 64 45 54.5 10 0 0.00 0.0 0 1980-06-12 70 47 58.5 6 0 0.00 0.0 0 1980-06-13 68 52 60.0 5 0 0.00 0.0 0 1980-06-14 80 51 65.5 0 1 0.00 0.0 0 1980-06-15 82 63 72.5 0 8 T 0.0 0 1980-06-16 69 60 64.5 0 0 0.00 0.0 0 1980-06-17 68 53 60.5 4 0 0.00 0.0 0 1980-06-18 67 55 61.0 4 0 0.00 0.0 0 1980-06-19 69 55 62.0 3 0 0.00 0.0 0 1980-06-20 68 55 61.5 3 0 T 0.0 0 1980-06-21 76 55 65.5 0 1 0.00 0.0 0 1980-06-22 81 58 69.5 0 5 0.00 0.0 0 1980-06-23 80 62 71.0 0 6 0.00 0.0 0 1980-06-24 79 65 72.0 0 7 0.00 0.0 0 1980-06-25 86 68 77.0 0 12 0.00 0.0 0 1980-06-26 75 63 69.0 0 4 0.00 0.0 0 1980-06-27 90 64 77.0 0 12 0.00 0.0 0 1980-06-28 73 60 66.5 0 2 0.00 0.0 0 1980-06-29 72 63 67.5 0 3 0.02 0.0 0 1980-06-30 77 60 68.5 0 4 T 0.0 0 Reliable observation times are not available prior to 1982. Climatological Data for JERSEY CITY, NJ - July 1980 Click column heading to sort ascending, click again to sort descending. Sum 2526 2034 - 0 272 5.01 0.0 - Average 81.5 65.6 73.5 - - - - 0.0 Normal M M M M M M M - 1980-07-01 73 58 65.5 0 1 0.00 0.0 0 1980-07-02 80 64 72.0 0 7 1.17 0.0 0 1980-07-03 72 66 69.0 0 4 0.13 0.0 0 1980-07-04 84 65 74.5 0 10 0.00 0.0 0 1980-07-05 79 65 72.0 0 7 0.16 0.0 0 1980-07-06 75 63 69.0 0 4 0.00 0.0 0 1980-07-07 79 55 67.0 0 2 0.00 0.0 0 1980-07-08 80 63 71.5 0 7 T 0.0 0 1980-07-09 82 64 73.0 0 8 0.00 0.0 0 1980-07-10 76 67 71.5 0 7 0.00 0.0 0 1980-07-11 84 65 74.5 0 10 0.00 0.0 0 1980-07-12 79 66 72.5 0 8 T 0.0 0 1980-07-13 82 57 69.5 0 5 0.00 0.0 0 1980-07-14 81 61 71.0 0 6 0.00 0.0 0 1980-07-15 85 65 75.0 0 10 0.00 0.0 0 1980-07-16 91 71 81.0 0 16 0.02 0.0 0 1980-07-17 85 67 76.0 0 11 0.10 0.0 0 1980-07-18 83 70 76.5 0 12 0.00 0.0 0 1980-07-19 78 69 73.5 0 9 0.00 0.0 0 1980-07-20 95 73 84.0 0 19 0.00 0.0 0 1980-07-21 94 79 86.5 0 22 0.00 0.0 0 1980-07-22 83 67 75.0 0 10 0.45 0.0 0 1980-07-23 76 68 72.0 0 7 0.03 0.0 0 1980-07-24 83 64 73.5 0 9 0.00 0.0 0 1980-07-25 85 63 74.0 0 9 0.00 0.0 0 1980-07-26 85 68 76.5 0 12 T 0.0 0 1980-07-27 80 69 74.5 0 10 0.00 0.0 0 1980-07-28 76 68 72.0 0 7 0.00 0.0 0 1980-07-29 73 64 68.5 0 4 2.95 0.0 0 1980-07-30 83 65 74.0 0 9 0.00 0.0 0 1980-07-31 85 65 75.0 0 10 0.00 0.0 0 Reliable observation times are not available prior to 1982. Climatological Data for JERSEY CITY, NJ - August 1980 Click column heading to sort ascending, click again to sort descending. Sum 2469 1995 - 2 225 4.01 0.0 - Average 79.6 64.4 72.0 - - - - 0.0 Normal M M M M M M M - 1980-08-01 78 68 73.0 0 8 T 0.0 0 1980-08-02 86 66 76.0 0 11 2.50 0.0 0 1980-08-03 88 64 76.0 0 11 T 0.0 0 1980-08-04 83 70 76.5 0 12 0.00 0.0 0 1980-08-05 84 70 77.0 0 12 0.04 0.0 0 1980-08-06 85 69 77.0 0 12 0.00 0.0 0 1980-08-07 86 68 77.0 0 12 0.00 0.0 0 1980-08-08 89 72 80.5 0 16 0.00 0.0 0 1980-08-09 86 72 79.0 0 14 0.00 0.0 0 1980-08-10 82 65 73.5 0 9 T 0.0 0 1980-08-11 84 68 76.0 0 11 0.46 0.0 0 1980-08-12 84 68 76.0 0 11 0.03 0.0 0 1980-08-13 79 63 71.0 0 6 0.00 0.0 0 1980-08-14 76 63 69.5 0 5 0.00 0.0 0 1980-08-15 77 68 72.5 0 8 0.03 0.0 0 1980-08-16 72 58 65.0 0 0 0.00 0.0 0 1980-08-17 77 51 64.0 1 0 0.00 0.0 0 1980-08-18 72 60 66.0 0 1 T 0.0 0 1980-08-19 74 62 68.0 0 3 0.03 0.0 0 1980-08-20 67 62 64.5 0 0 0.72 0.0 0 1980-08-21 68 60 64.0 1 0 0.00 0.0 0 1980-08-22 73 60 66.5 0 2 0.00 0.0 0 1980-08-23 74 58 66.0 0 1 0.00 0.0 0 1980-08-24 83 59 71.0 0 6 0.00 0.0 0 1980-08-25 82 65 73.5 0 9 0.00 0.0 0 1980-08-26 80 62 71.0 0 6 0.00 0.0 0 1980-08-27 87 66 76.5 0 12 0.00 0.0 0 1980-08-28 86 65 75.5 0 11 0.00 0.0 0 1980-08-29 71 63 67.0 0 2 0.00 0.0 0 1980-08-30 77 64 70.5 0 6 0.00 0.0 0 1980-08-31 79 66 72.5 0 8 0.20 0.0 0 Reliable observation times are not available prior to 1982. -
It’s pouring again in Marysville now.
-

June 2025 discussion-obs: Summerlike
LongBeachSurfFreak replied to wdrag's topic in New York City Metro
Marine stability, no focusing mechanism for convention. Need lift, like a strong seabreeze front or warm/cold front. Tomorrow we should at least see some precipitation. -
MU's Elliott now forecasting 6-10" of rain in northern Lanco...
-
Central PA Summer 2025
Mount Joy Snowman replied to Voyager's topic in Upstate New York/Pennsylvania
Starting to get concerned with all this back-building right over my area. New flash flood warning issued. -
True. Used it to keep my resident rodents warm last winter.

-
3.87" so far today. Upstream (literally, lol) radar continues to fill in so maybe shot at 5". Absolutely unreal. So what's the mechanism for this mesoscale training over such a relatively small area?