All Activity
- Past hour
-

July 2025 Obs/Disco ... possible historic month for heat
weatherwiz replied to Typhoon Tip's topic in New England
Good call, you sniffed this out several days ago -
July 2025 Obs/Disco ... possible historic month for heat
weatherwiz replied to Typhoon Tip's topic in New England
That was at Big Y in Wilbraham, MA! Sorry for late response -

July 2025 Discussion-OBS - seasonable summer variability
Stormlover74 replied to wdrag's topic in New York City Metro
And interestingly the one street that's lined with sycamore had almost no damage. It's those damn old oaks I guess -
July 2025 Discussion-OBS - seasonable summer variability
Stormlover74 replied to wdrag's topic in New York City Metro
Glad you made out better than we did. They haven't even started cleanup yet. I'm estimating 7 to 10 days before we have power again. Thankfully no damage to my house but many houses had trees crush them and yeah 3 deaths from trees falling on cars -

Invest 92L--70% Two Day & 70% Seven Day Odds
WxWatcher007 replied to WxWatcher007's topic in Tropical Headquarters
Recon descending now -

2025-2026 ENSO
Stormchaserchuck1 replied to 40/70 Benchmark's topic in Weather Forecasting and Discussion
Yeah, it's been a +WPO pattern -

July 2025 Obs/Disco ... possible historic month for heat
Torch Tiger replied to Typhoon Tip's topic in New England
memorable = hottest July ever. got it -

July 2025 Discussion-OBS - seasonable summer variability
ForestHillWx replied to wdrag's topic in New York City Metro
3 dead in your area; crushed in their cars from tree falls. -

Invest 92L--70% Two Day & 70% Seven Day Odds
GaWx replied to WxWatcher007's topic in Tropical Headquarters
Recon will be in it shortly. They released this 2PM EDT TWO quite early: Tropical Weather OutlookNWS National Hurricane Center Miami FL200 PM EDT Fri Jul 4 2025For the North Atlantic...Caribbean Sea and the Gulf of America:1. Near the Southeastern United States (AL92):Satellite wind data indicate that the system located about 150 miles off the northeast Florida coast has become better defined today with an area of strong winds located on its east side. Showers and thunderstorms are also persisting near and to the east of the center. A short-lived subtropical or tropical depression could form later today or on Saturday while the system drifts generally north-northwestward. This low is expected to move inland over the southeastern U.S. by early Sunday. An Air Force Reserve Hurricane Hunter aircraft is currently en route, and the data they collect should provide more details on the system's structure. Regardless of development, heavy rainfall is possible across portions of west-central and southwestern Florida through early Saturday, and across coastal sections of the Carolinas beginning later on Saturday. * Formation chance through 48 hours...high...70 percent. * Formation chance through 7 days...high...70 percent.Forecaster Cangialosi/Beven -

July 2025 Obs/Disco ... possible historic month for heat
HoarfrostHubb replied to Typhoon Tip's topic in New England
Wind was pretty brisk on our local pond, but the resident bald eagle was happy to show up.
-

July 2025 Obs/Disco ... possible historic month for heat
512high replied to Typhoon Tip's topic in New England
73F/ my thoughts are this is a top 10 day........Happy 4th everyone, be safe and enjoy! -
We really need an almost perfect setup to beat that 2012 record. The cool June and continued strong +AO and cool isn't going to cut it regardless of the May melt pond data IMO.
-

July 2025 Discussion-OBS - seasonable summer variability
winterwx21 replied to wdrag's topic in New York City Metro
Hey Stormlover! I'm glad you're ok. I lost power a few seconds after my last response to you. The power just came back on now -- over 18 hours of no power here. By far the longest power outage I've ever experienced. We didn't even lose power for long here during Sandy. I agree with you -- this was the worst storm I've ever seen. Wind gusts were easily over 70mph here. Projectiles flying through the air like I've never seen before and the biggest amount of trees down that I've ever seen. Couldn't cook dinner last night with the power out, so we decided to go to Longhorn Steakhouse (they didn't lose power there). Usually it takes 8 or 9 minutes to get there, but it took over a half hour because so many roads were closed. Was starting to think I couldn't get there but I found a way. It was amazing driving around and seeing the huge amount of damage. Definitely the worst t-storm damage ever since I've lived here. Since the power was out so long, I decided to cancel our 4th of July cookout today. Not enough time to get things ready now. A shame because of the perfect weather, but we're gonna have the cookout tomorrow and Sunday instead. I will still light off some fireworks tonight though. -
I am frackin jealous. What's that bright object in the sky?
-
I am not sure what the sam hill is going on here in central TX right now. We got this round area of heavy rain just spinning like a top so much, it's making me dizzy. We have picked up 2.6 inches since yesterday. We are under a flood watch that has been extended out to evening. Lots folks disgruntled over soggy 4th celebrations and the prospect of soaked fireworks. This thing just does not want to leave. NWS says possibly up to 7 inches by tonight. I thought this was gonna be done by 9am today? This is Central Texas not northern Virginia.
-

July 2025 Obs/Disco ... possible historic month for heat
Typhoon Tip replied to Typhoon Tip's topic in New England
That's typically how we get our biggest heat as a matter of climate fact... The model of AN in NE has 2 origins: 1 MS Valley/Gulf 2 S/W U.S. These have different large synoptic circulation modes and are easily identifiable. 1 is a WAR sourced. The West Atlantic Ridge retrogrades west and bulges the westerlies N of New England. This tends to collocate with a surface ridging which imparts a deep layer SW flow from east Texas and the Gulf region up and around the periphery of the high. This type of heat seldom exceeds the low 90s, but will transport high theta-e ( elevated DP) air. think 92/76 2 is Sonoran desert/elevation processed heat. This is led by a +PNA that collapses into a mode change -PNA. This ejects plume(s) of intense kinetically charged desert air, with exceedingly hot 850 mb type temperatures, EMLs and very tall mixing columns on the soundings. The -PNA sends heights higher over the eastern mid latitude continent, and the ejected plume(s) of high heat get timed into that ridge expansion and trapped. This kind of AN pattern is typically where we get our biggest T. DPs may start out diurnal cycles in the 70s, but will tend to mix down to the 60s. think 100/66 Sometimes... you can hybridize between these two ... For example, the retrograding WAR may be coupled with a --> -PNA.... but there is no certainty while that is happening that a plume will be timed. So it's important in climate awareness to understand the mechanistic differences in how the heat is transported across the continent. That EPS mean above is indicating the #2 method of heat transport is favored - assuming that gaudy look actually materializes that way. - Today
-

July 2025 Obs/Disco ... possible historic month for heat
rimetree replied to Typhoon Tip's topic in New England
77/57...couldn't draw it up any better for the 4th. Enjoy the day folks. -

July 2025 Obs/Disco ... possible historic month for heat
powderfreak replied to Typhoon Tip's topic in New England
66/50 in the valley. Bit cooler up here at the mountain. A nice break in the heat. -

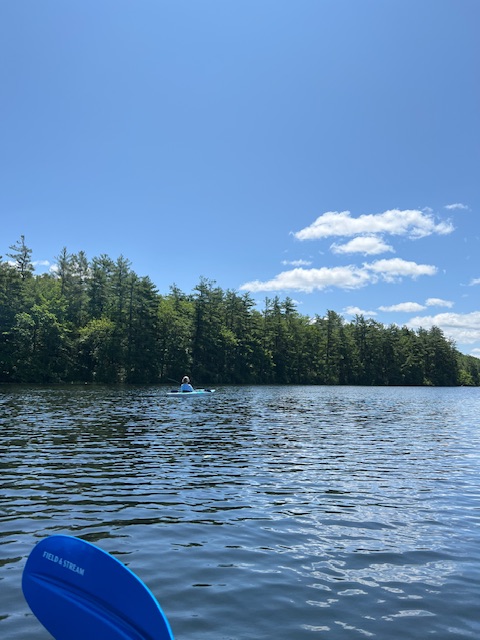
July 2025 Obs/Disco ... possible historic month for heat
Lava Rock replied to Typhoon Tip's topic in New England
Gusty NW winds at the lake. Sent from my SM-S921U using Tapatalk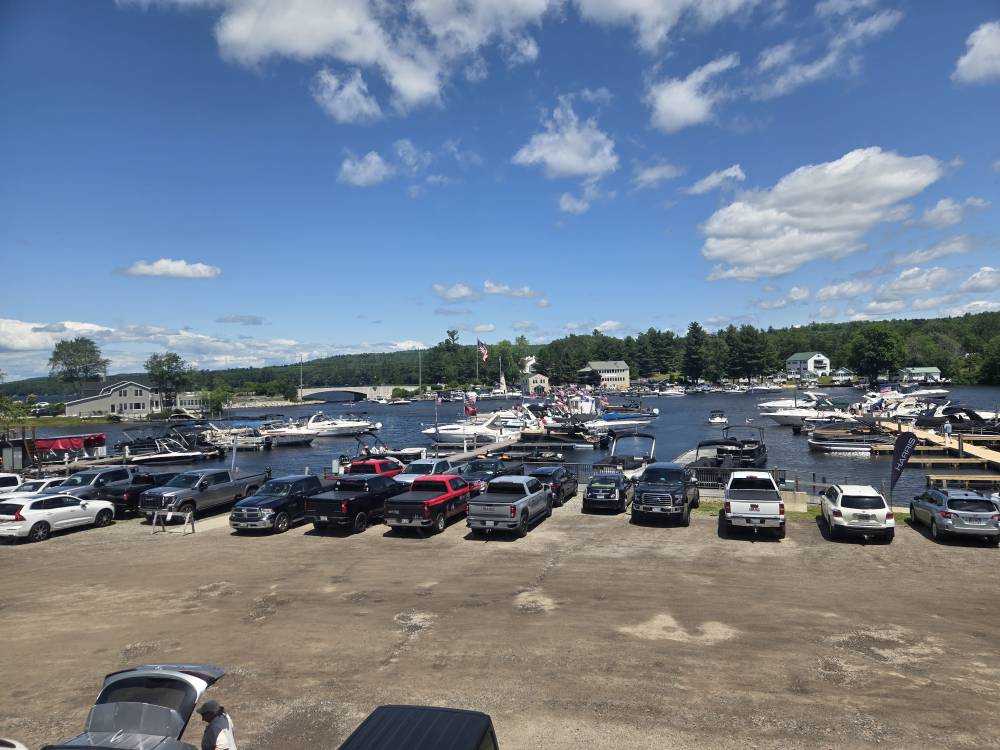
-
Early split picture showing up in the data. It was a warmer than average May across the Arctic. But not as warm as 2020 was which lead to all the preconditioning that year. June was the coolest in the Arctic over the last decade. Yet the extent is currently in 1st place for lowest in early July. But the area is only 8th lowest. Area and melt pond fraction are more important this time of year than extent in trying to guess a September low. Unfortunately, the May melt pond data still hasn’t been released. This is what the statistical model uses to forecast a June September low. If I had to take an early guess, the higher area now than extent could mean that the extent will fall behind the steep 2012 drop which happened back in early August 2012. So it’s possible that the 2012 record low will hold for another year. But I want to see the May melt pond fraction first before making a final call. I will update this if the ARCUS SPIN site gets around to posting the model forecasts for September. They have been delayed in their update.
-
Unexpected 1.2” early this AM. Garden now having a happy 4th. The brisket, however, is going to be delayed.
-

July 2025 Obs/Disco ... possible historic month for heat
weathafella replied to Typhoon Tip's topic in New England
Lovely day! I enjoy my heat but love the gathering planned in near perfect outdoor wx today. It should be hot Sunday onward for a few days and like the past few weeks, cooldowns are short lived. -
Was surprised the military planes made it this far north this morning. Had numerous fly by
-
GGEM remains consistent bringing rain from future Chantal into the area. Many runs in a row even though it has no support.
-

Occasional Thoughts on Climate Change
TheClimateChanger replied to donsutherland1's topic in Climate Change
Funnily enough, the USCRN data largely supports my contention decades ago that the US climate record likely understates the change. If you accept USCRN as the gold standard, then, you must conclude nClimDiv [and the older USHCN] clearly understates warming in recent decades.