All Activity
- Past hour
-

December 2025 Short/Medium Range Forecast Thread
Reb replied to John1122's topic in Tennessee Valley
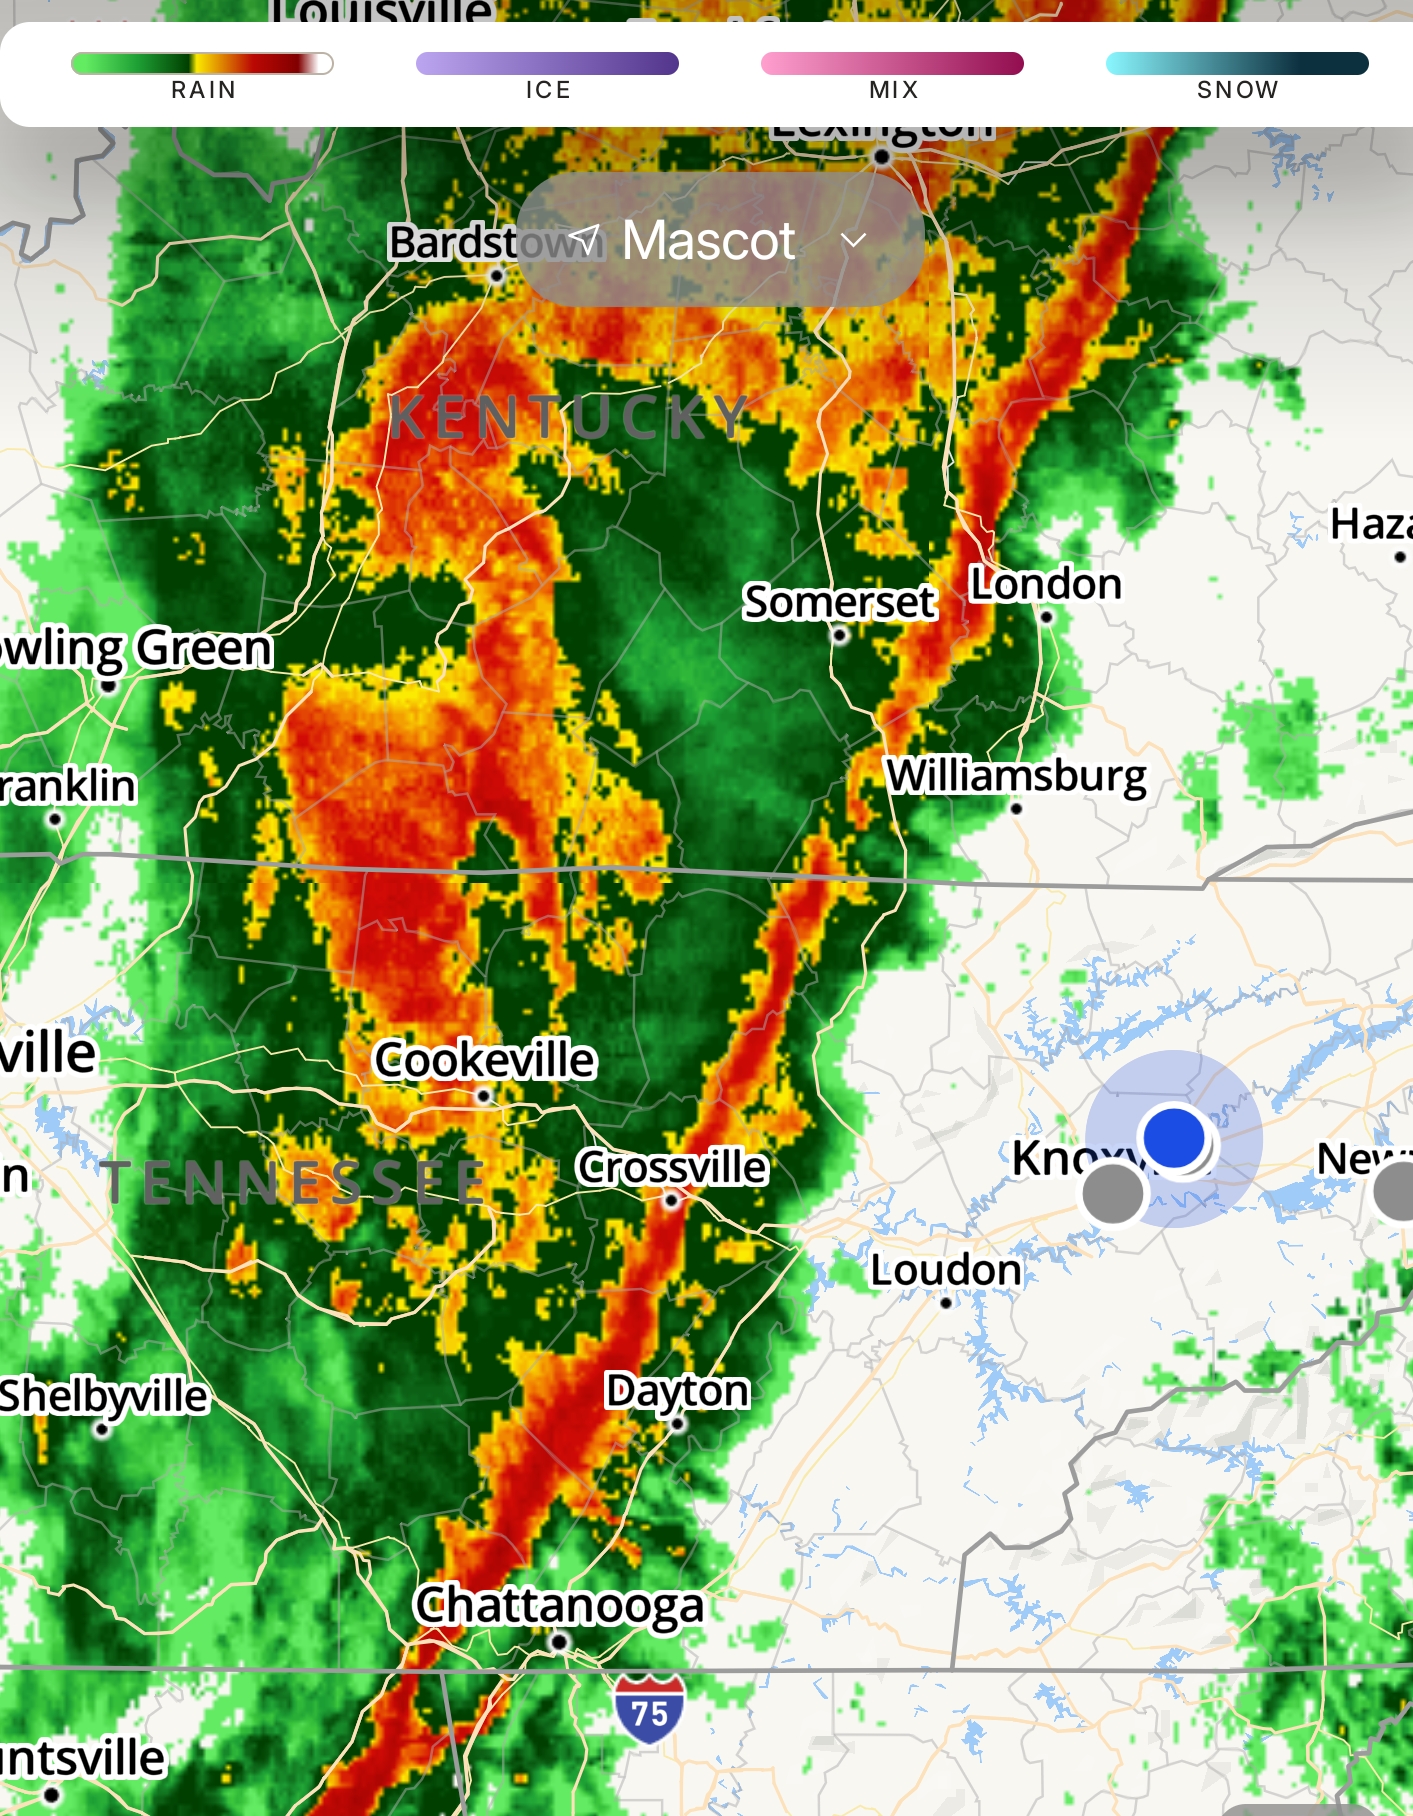
It feels awesome outside. MPING reports show shingle damage near Harriman and Decatur -
I mean January is 2 weeks away, prime climo window starts in 4 weeks. Could it turn around by then and the models won't pick up on it until it's closer?
-
Eff the PNA....can I get an amen?
-

December 2025 regional war/obs/disco thread
40/70 Benchmark replied to Torch Tiger's topic in New England
Still have about 1.5" of crust on the ground here....all a dream tomorrow. -
It’s awful. Good people doing important work pilloried due to nonsense.
-
Quite the eventful weather day, we lost a good amount of snowpack from the combination of high dews, warm overnight temps and a bit of rain. Was 39F when I left for work at 6am. Temps came crashing down mid/late morning and haven’t stopped falling. Snow showers moved through this afternoon and put down around an inch, although with all the blowing it’s impossible to tell. Winds gusting between 35-40mph with the snow. Clearing now and 7F with blowing snow.
-
Was always obvious the second half of Dec would be a CONUS-wide blowtorch, unless if you have no pattern recognition ability whatsoever.
-

E PA/NJ/DE Winter 2025-26 Obs/Discussion
Ralph Wiggum replied to LVblizzard's topic in Philadelphia Region
Brother, patience isn't even enough. Admittedly, I prematurely extrapolated. We are in dire trouble thru MLK day at best. I will check back after the New Year. Wishing a happy holiday to all you guys and gals. -
@stormtracker needs to have his tech gurus add a vomit emoji
-

December 2025 Short/Medium Range Forecast Thread
housemtnTN replied to John1122's topic in Tennessee Valley
Has anyone noticed the line of storms coming through? It's 60 degrees at my house, very windy. I cannot believe how warm it is right now lol.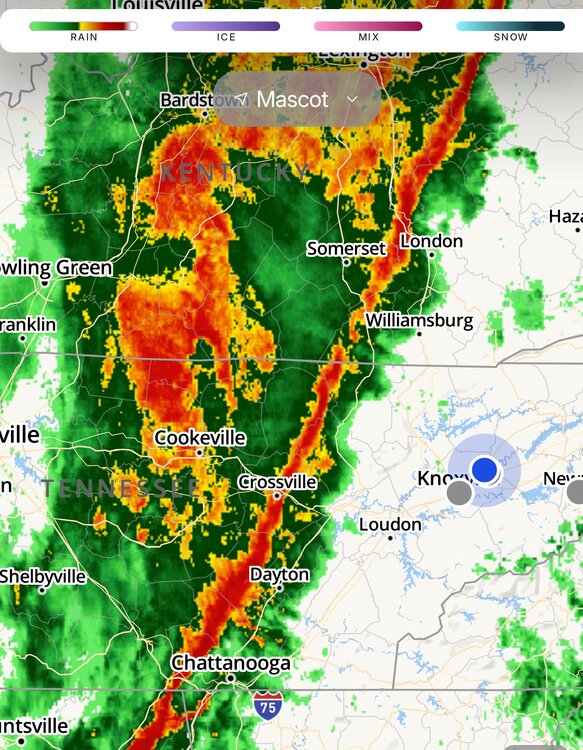
-
With the PNA dipping even further negative, it’s likely that trough will persist, and there will be some ridge either over central US or east US. Even if northeast remains colder than average, with the rest of the country torching, there’s no snowstorm that can make its way over here. Unironically; the winter weather across CONUS this month could be the most significant of this entire winter.
-
Fielded lots of calls about that today! The worry about bus routes and tree limbs falling is always a significant concern for many districts. Many districts will be in the middle of their elementary bus runs as this event ramps up. But given the fickle nature of tree damage and strong wind events in general, usually nothing proactive you can do in advance; unless we are dealing with the rare case of a true tropical system coming onshore. Hopefully this event under-performs, like most of our wind events? But it does have chance to be locally nasty.
-
Low of 37 at 5:09am, high of 61 at 12:37pm. Still 59 at 10pm. .08" in the bucket so far.
-
It's remarkable that every CAM has a forced line of convection tomorrow morning arriving on the west side of DC around 7AM and hitting the eastern side around 8. I'm also very intrigued by all CAMs showing a broken line on the secondary front in the early afternoon. This environment will have some CAPE and some low freezing levels, so I suspect that these could be accompanied by small hail or graupel.
-
Great turnaround by the Caps tonight
-
Ok lets be real....we arent losing the trof in the NW US anytime soon are we?
-
It is indeed remarkable how fast these AI-based models run. It really opens the door to running larger ensembles than ever thought possible, although getting meaningful spread still needs research
-
Low of 38, high of 62 and the rain has finally started.
-
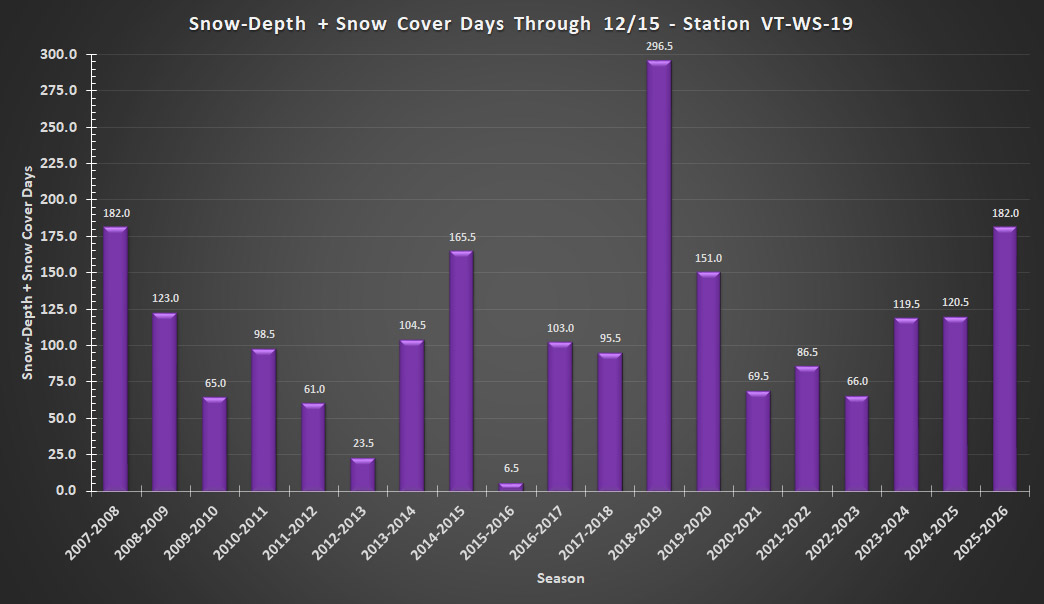
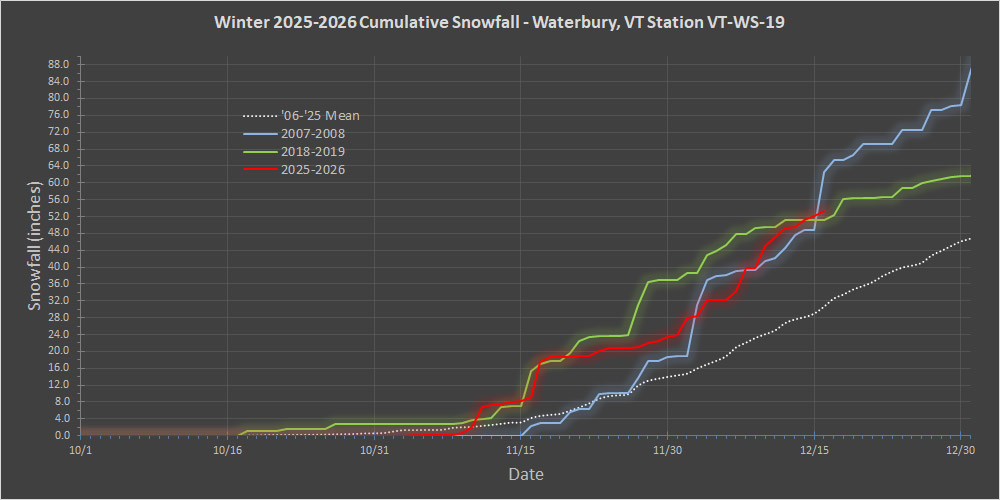
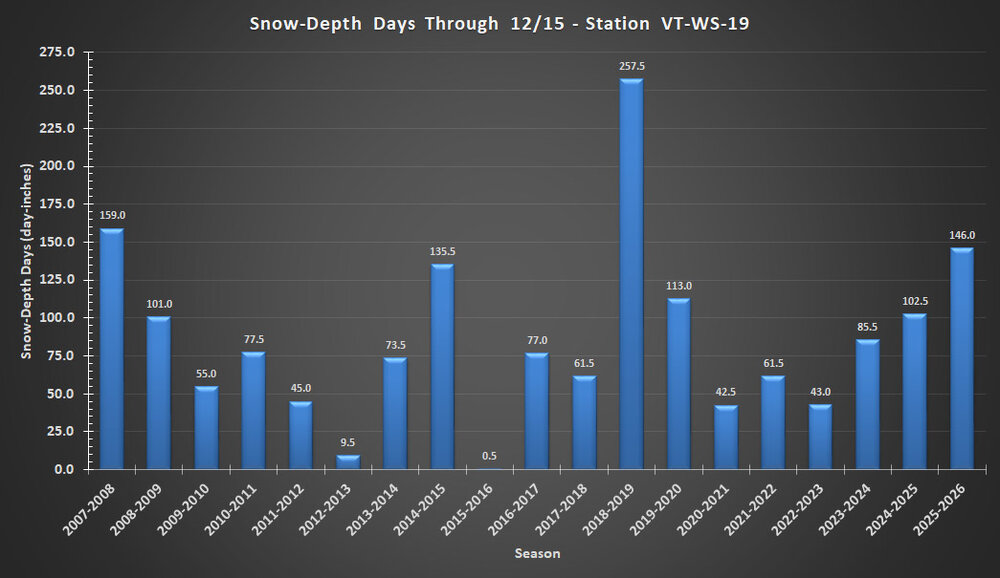
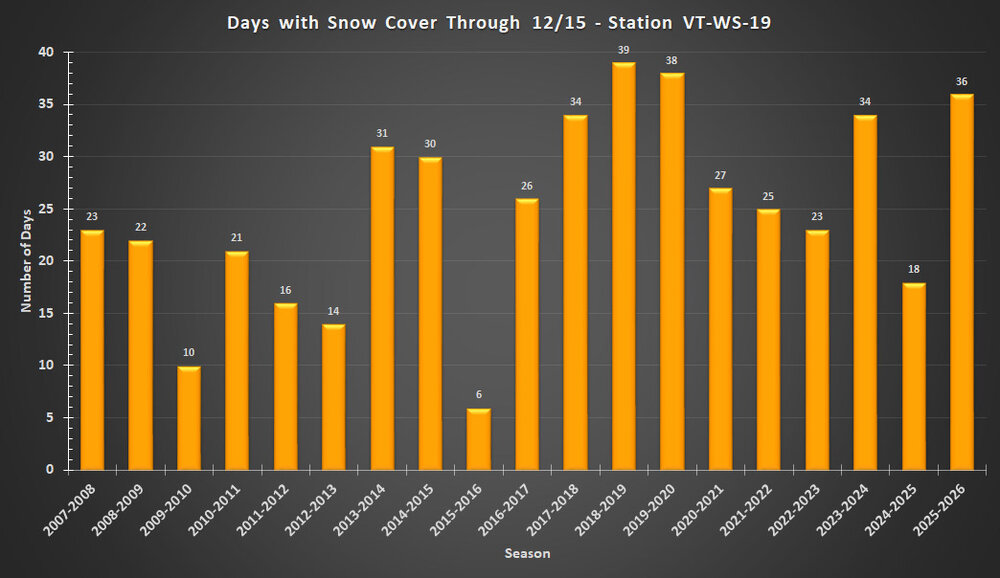
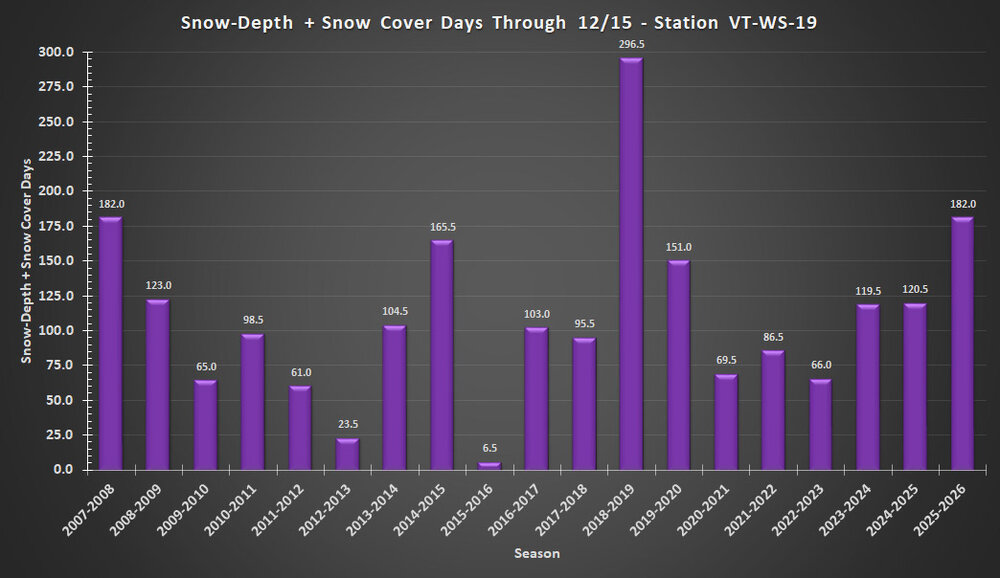
Since the snow depth for our VT-WS-19 CoCoRaHS site is reported each day, SDD for our site is actually something that can be obtained publicly. SDD isn’t something that CoCoRaHS reports directly though, so it would require some offline analysis (unless it’s available in one of the various CoCoRaHS analysis tools – I haven’t explored all the features in those tools exhaustively). You could even explore some of the data for a CoCoRaHS site closer to you if you wanted something that might be more relevant to compare to your location. It looks like southern Franklin County has relatively poor coverage on CoCoRaHS, but the one active site in that area is in Fairfax: VT-FR-21: Fairfax 4.9 WNW. Anyway, I have all my data in a spreadsheet, so it’s really quick for me to calculate SDD. If one is looking for relative snow retention/snow cover, SDD is certainly going to be helpful, but I could also envision the total number of days with snow cover being another important parameter. There could be a season with a solid number of SDD through mid-December, but it all happened to come from one notable storm that fell in the last week of November and hung around for several days, but the rest of November and the first half of December had bare ground. Or, there could be a few inches of snow cover right from the start of November that never melted and the ground was white the entire time. It’s hard to say which one of those is “snowier”, so I made plots for both of those parameters. There are three plots below covering data from the start of the snow season (Oct 1) through Dec 15: the first one plots SDD, the second is total days with snow cover, and the third is the sum of those two (sort of a way to blend those two parameters into a more comprehensive parameter for integrated snow depth & snow cover – the numbers are generally within an order of magnitude of each other, so a straight up sum seemed reasonable). As you can see from the data, this season is solid, but not really a standout that jumps from the pack of other decently performing seasons in either SDD, days with snow cover, or the combined parameter. I’ve never really explored these numbers until you inquired, so it’s interesting to see the season that does jump out here is 2018-2019. It’s actually the top season on all three plots, but boy does it absolutely soar above everything else with respect to SDD. It’s not surprising to see that 2018-2019 is one of the comparative seasons I’ve been tracking in my snowfall progression plots (I added that latest plot at the bottom here for reference). Coincidentally, there is currently a discussion on First Tracks!! Online Ski Magazine about the strong start to the ski season here in Northern Vermont, and in that discussion, Tony Crocker has a post showing that as impressive as this start has been with respect to open terrain – through December 8th, the 2018-2019 season was even better than this one.
-
Just posted this in another thread. Saw it on LinkedIn. Should have looked here first lol. That’s quite a speed increase re AIGFS.
-
Maybe posted already, but discusses the NOAA AI models… https://www.noaa.gov/news-release/noaa-deploys-new-generation-of-ai-driven-global-weather-models
-
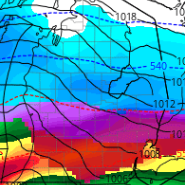
Wasn't this the AI model that had us in the purple shade for days leading up to the storm that gave us 15 minutes of mix then a bunch of rain at the beginning of December? Or was that the GFS AI?
- Today
-
Stopped drizzling and temp climbed to 41.8/40.3.
-
December 2025 regional war/obs/disco thread
WxWatcher007 replied to Torch Tiger's topic in New England
-
Jan '99 prolly belongs on that list as well.