All Activity
- Past hour
-
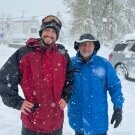
Gonna get my last round of golf for a while in today
-
Your rested eyes saw it correctly
-

Possible Record Breaking Cold + Snow Sunday 1/25 - Tuesday 1/27
LawdogGRNJ replied to TriPol's topic in New York City Metro
Exactly - having gone through one of the historic ice storms of the 1990's, there's nothing "nice" about them. -
 LennyLeonard60 joined the community
 -
“Cory’s in LA! Let’s MECS!” Jan. 24-26 Disco
wx_observer replied to TheSnowman's topic in New England
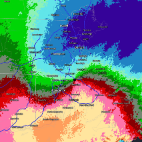
Not too often that you see San Antonio and Presque Isle have extreme cold watches at the same time...with a nearly solid wall of winter weather alerts in between.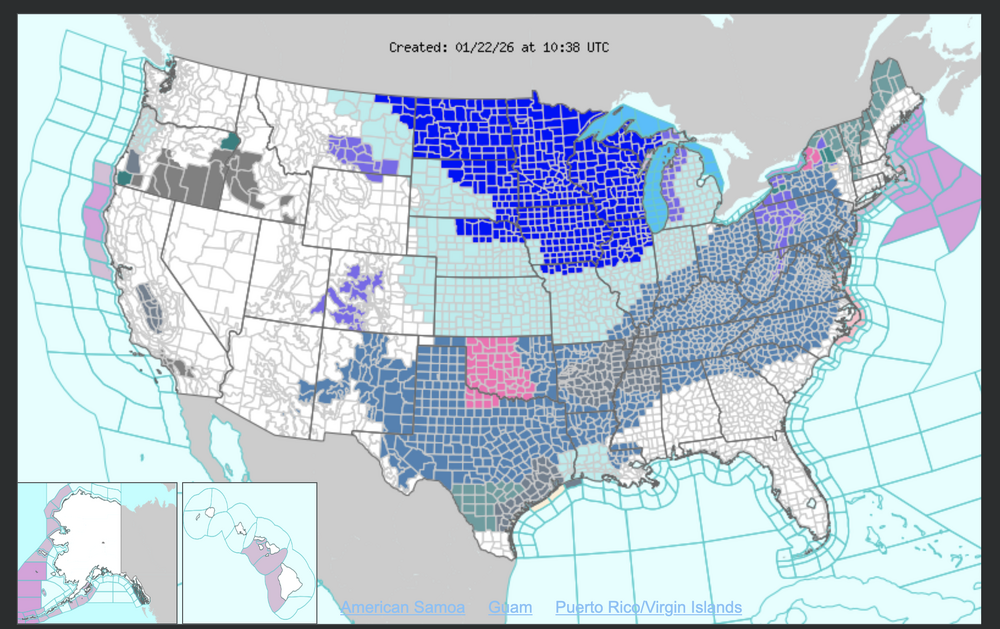
-
Couldn't stay awake for the runs last night either. Needed a good night's sleep. Hopefully, we have seen the constant jumps north come to and end after the 6z gfs. The first run I have seen that actually had a slight bump south. Unless I am missing anything. Too many posts to sift through! Hoping the euro at least holds.
-
You’ll be primed today, wandering what happened to you
-
I passed out at 945 last night lol. Staying up the two prior nights killed me. But glad I woke up to still in the game. 6z euro out shortly.
-
Don’t want to see that. I pray that does not happen
-
1/24-1/25 Major Winter Storm - S. IL, IN, and OH
Stevo6899 replied to A-L-E-K's topic in Lakes/Ohio Valley
Same but it's not gonna take much qpf to stack a foot. Pretty rare to get high ratio snow for a potential somewhat big dog. -
6:30 ish
-
620
-
What time does the morning euro come out?
-

“Cory’s in LA! Let’s MECS!” Jan. 24-26 Disco
SouthCoastMA replied to TheSnowman's topic in New England
Southern areas will want the north trend with the primary to stop to maximize totals with any secondary development. Otherwise it's a flip to rain and dryslot after the good thump. GFS on the other hand is great, though little confidence it's correct -
That trend simply terrifies me and why I feel pretty ok saying 6-8in for many before the slop
-

Central PA Winter 25/26 Discussion and Obs
Ruin replied to MAG5035's topic in Upstate New York/Pennsylvania
Yeah, most of the models are saying that it does get kicked out more east than north. Thus, that's why most of the precipitation ends early monday.I hope we can get it to stay a little bit longer into the afternoon on monday -
What did the 6z CMC say?
-

January 24-26: Miracle or Mirage JV/Banter Thread!
nj2va replied to SnowenOutThere's topic in Mid Atlantic
Keep us posted each model run please! -
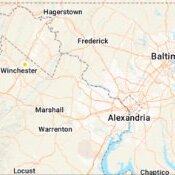
This is a very very alarming excerpt from the latest Richmond AFD as of 248am EST. https://forecast.weather.gov/product.php?site=AKQ&issuedby=AKQ&product=AFD&format=CI&version=1&glossary=1&highlight=off A variety of precipitation types are expected in this setup with big differences as you head NW to SE across the forecast area. Cold air holds strong at the surface for inland areas as the wedge reinforces. Warmer air likely intrudes across the far SE, with temperatures potentially climbing into the upper 40s to around 50 while areas across the NW stay in the lower 20s. In addition, all guidance indicates some form of a warm nose developing around ~850mb, potentially spreading as far inland as the NW Piedmont. This will result in a messy situation with snow, sleet, freezing rain, and plain rain possible across the forecast area. The thickness and strength of the eventual warm nose is what will ultimately decide our precipitation types. Precipitation likely starts off as all snow for a majority of the area Saturday afternoon-evening, spreading north from the south. A change over then occurs from SE to NW with areas across the far SE changing to plain rain. Meanwhile, it gets messier further inland with snow/sleet/freezing rain all being possible Saturday night into Sunday night. Right now far NW portions of the area would be favored for the most snowfall, while areas south of I-64 and along/west of I-95 would be favored for more icing (see further details about both below). Whatever form of wintry precipitation that does fall will be significant, hence the Winter Storm Watches. Ice: After looking at the 00z guidance, am really starting to get concerned that a good portion of the area may see significant to potentially catastrophic ice impacts. The latest NBM indicates a 30- 50% chance for AT LEAST 0.50" of freezing rain for much of the area along/south of I-64 from our western border over to the western Tidewater and up to the Middle Peninsula. 1.00" probabilities of freezing rain have increased to near 20% across South Central Virginia which may be too low. Even more concerning, the EPS Mean accumulation of freezing rain ranges from 1.00-1.50" across the same locations, with the deterministic ECWMF showing even higher/more alarming numbers. It is possible that the EPS/ECMWF, are overdoing the freezing rain and some of this QPF may be sleet instead (from glancing at model soundings), but even half of these amounts will result and a significant ice storm. Ice accumulation of this magnitude would likely result in major travel impacts as well as widespread and long-lasting power outages. Snow: Snow probabilities remain fairly steady, favoring the far northern half of the area up to DC. The probabilities for greater than 12" of snow (off of the NBM) range from 40-60% for much of the northern half of the forecast area, with even higher probabilities (60-80%+) for at least 6". I am concerned these values may be overdone, especially the further south you go, due to substantial mixing of sleet and/or freezing rain. There will likely be a very sharp cutoff in snow amounts (from north to south) just over or near the northern half of the forecast area which we will still need to fine tune with future forecasts. Everyone should take note and begin to make preparations for a significant snow/icing event as moderate to major (potentially extreme) impacts are looking increasingly likely from this storm. In addition, after effects from the storm will likely last well into the work week due to very cold temperatures. I am sorry if this has been mentioned before but this situation is SERIOUS BUSINESS. I am very concerned about those higher numbers. A few years ago I personally experienced three quarters of an inch of ice in Buda, TX. The effect on the oaks down here were alarming to say the least. Ice in excess of 1.50 inches is something I can not even begin to imagine. South Virginia and parts of North Carolina will very likely become disaster zones deteriorating into outright humanitarian catastrophes.
-
Could be a top 10 in Dulles ??
-

January 25-26 Winter Storm Potential
Ralph Wiggum replied to Ralph Wiggum's topic in Philadelphia Region
AI euro drops about 11" before ending as a mix. -
If you read the 2nd part of that I said I’d be back in if 6z stopped the bleeding. So far so good.
-
January 24-26: Miracle or Mirage JV/Banter Thread!
aldie 22 replied to SnowenOutThere's topic in Mid Atlantic
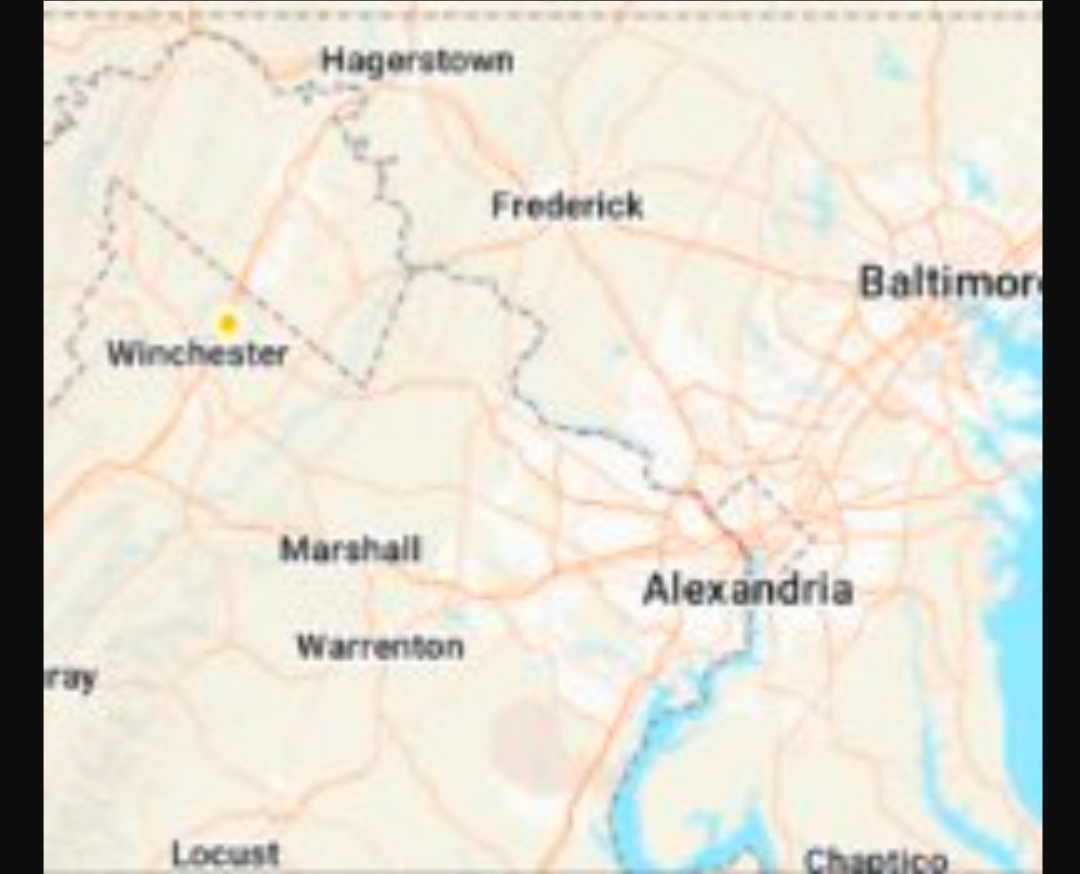
Im really struggling with expectations out here. This will be my first winter event in the area after so many years in central/eastern Loudoun. I think we hold onto temps better so more snow than sleet probably. I really had a good feel for winter and rain events in leesburg and aldie but zero clue out here in Stephenson. Good luck to everyone
-
 .
. -

1/24-1/25 Major Winter Storm - S. IL, IN, and OH
michsnowfreak replied to A-L-E-K's topic in Lakes/Ohio Valley
I dont like to jump on ratios too much. Sometimes when its bitterly cold you get sandy sugar snow instead of fluff. Either way, good trends. -

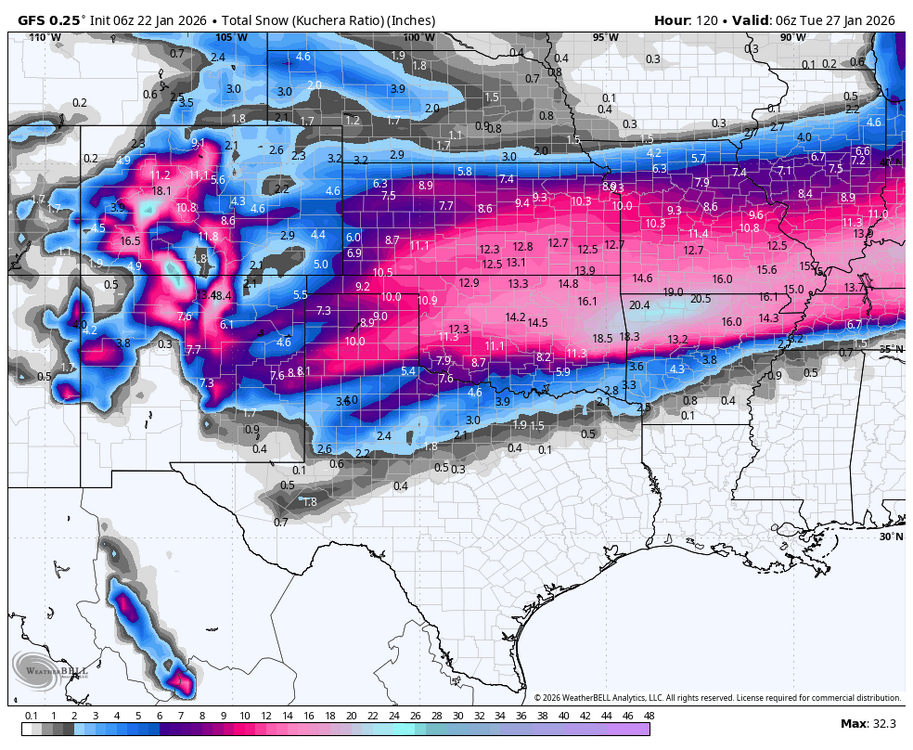
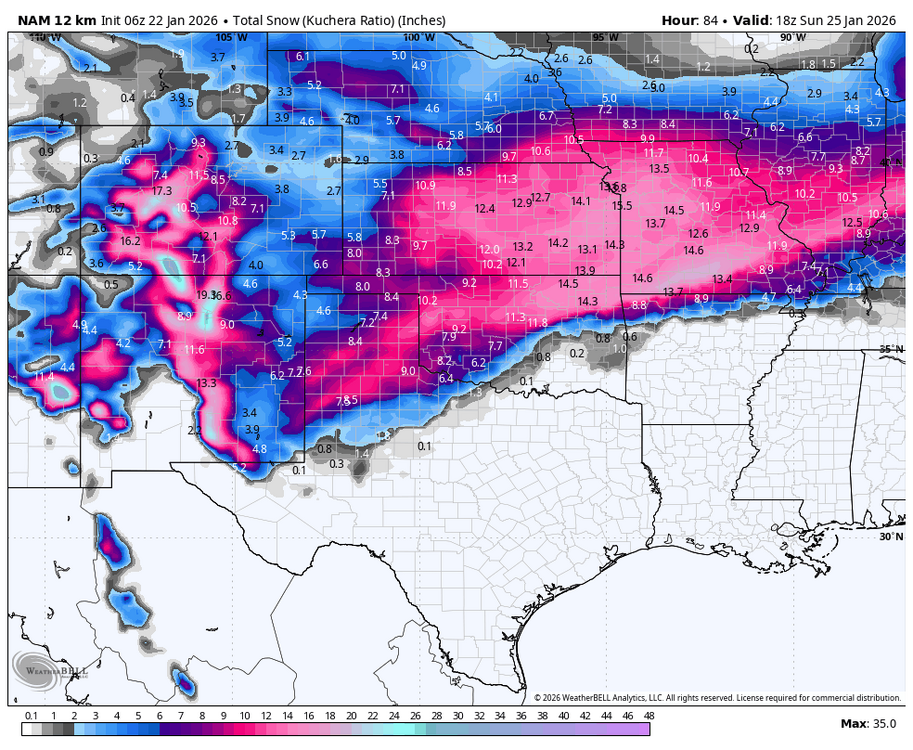
MO/KS/AR/OK 2025-2026 Winter Discussion
rockchalk83 replied to stormdragonwx's topic in Central/Western States
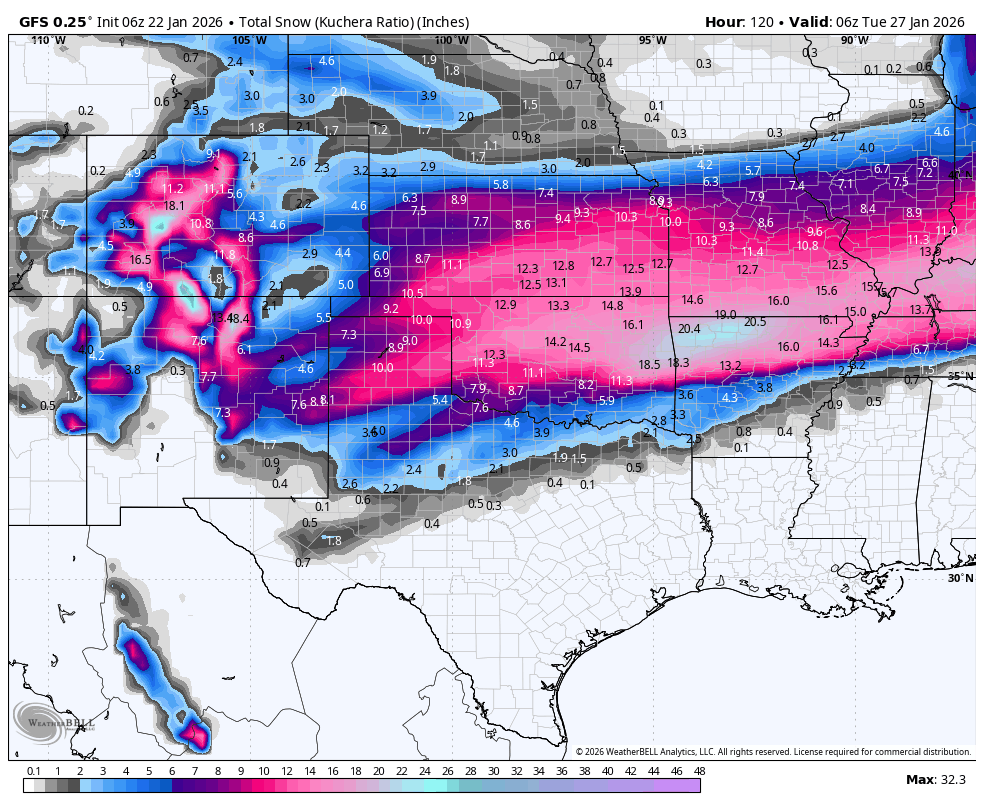
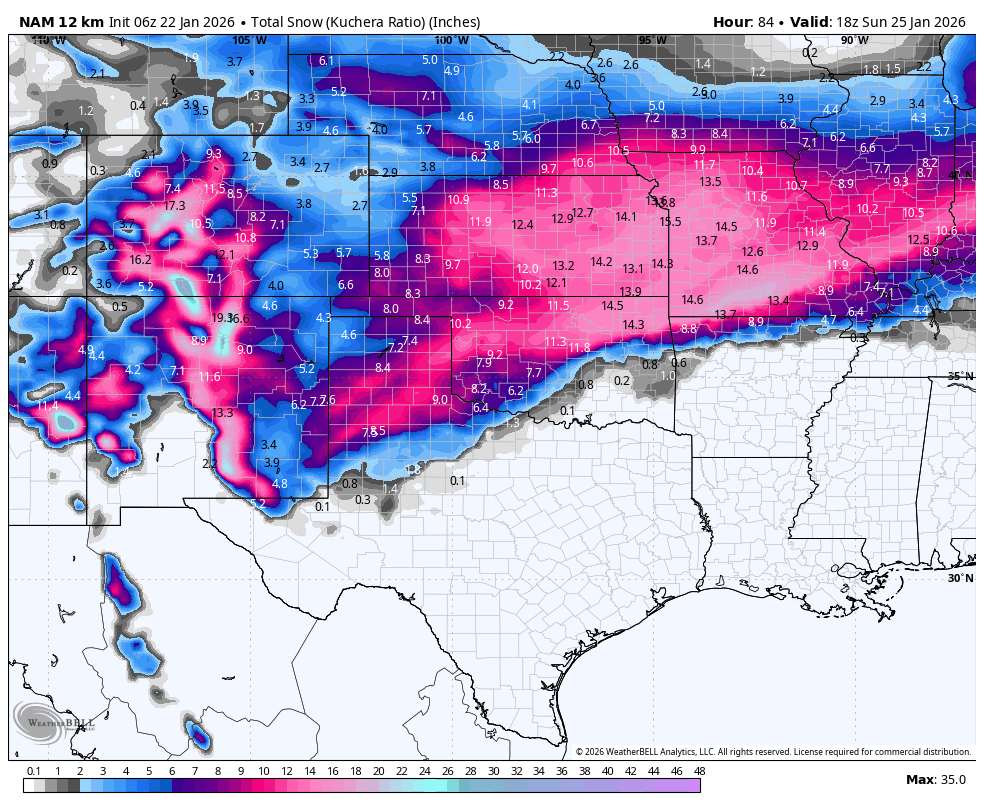
Good morning! The GFS took all of the dropsonde data from the Hurricane Hunters and finally caught up to the Euro. GFS AI & Ensembles also support liquid equivalent moisture over 1/2 inch for most of the area. Here is the 06z operational output: Here is the 06z NAM, too.