All Activity
- Past hour
-

1/23/26-1/25/26 Winter Storm Thread
Holston_River_Rambler replied to AMZ8990's topic in Tennessee Valley
The nice thing is they don't wear out quickly here. I actually bought a snow pusher a couple of days ago for my decks. Maybe I'll get to use it eventually. -
Yeah if not for the thaw we would've seen a solid -6 or 7 for the month
-

Possible Record Breaking Cold + Snow Sunday 1/25 - Tuesday 1/27
Wxbear25 replied to TriPol's topic in New York City Metro
I wonder how well sampled the northern energy is as well, that’s another important part of this equation between the ULL off the coast of CA, the ULL over southeastern Canada, energy south of Alaska and energy currently over Russia that dives into the trough, there are a lot of players on the field -
try clearing your cache - it probably has a generic name and your browser is like "I have this snow map already"
-

Possible Record Breaking Cold + Snow Sunday 1/25 - Tuesday 1/27
oceanctyguy replied to TriPol's topic in New York City Metro
Yeah, not buying some of the highest totals along the Jersey shore. I'm about 15 mins north of Toms River, I'm counting on mostly sleet if not pure rain at some point. -
As shown that's a snow sounding. But in reality when the ECMWF model sounding looks like that, it usually verifies as sleet. Either the model or more likely the 3rd party vendor lack the vertical resolution to properly depict the sounding. That's why the plot looks too linear and granular. Using the NAM as a reference, there's probably a warmer layer in there below 700mb.
-
Possible Record Breaking Cold + Snow Sunday 1/25 - Tuesday 1/27
EastonSN+ replied to TriPol's topic in New York City Metro
Hey Forky wanted to check in and see if any changes in your opinion. -
Just wait until DT’s map comes out. Going to proactively take some Tylenol.
-
My wx station had 57 and I thought it was way off. Doesn’t seem so if you torched too
-
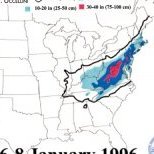
I have no doubt that elevation was huge in 2006. That storm is why I don't question the low amount at DCA in borderline events, though. It really is warmer down there.
-
I'm in the 6 to 81 feet. Nice!
-

January 24-26: Miracle or Mirage JV/Banter Thread!
H2O replied to SnowenOutThere's topic in Mid Atlantic
Anyone else cracking up that we have people debating why sleet is counted as snow on maps? -

January 2026 regional war/obs/disco thread
SouthCoastMA replied to Baroclinic Zone's topic in New England
stay safe out there -
If I keep looking at these weather models and message board, my wife may take my phone and chunk it lol
-
This is definitely on your end, but also not your fault. When folks hyperlink the NWS forecasts those maps are dynamic and sometimes update themselves. I recall one of the LWX sites just stopped updating its snow maps after Feb 2024, which is likely where BigCountry's browser is pulling its info from?
-

Possible Record Breaking Cold + Snow Sunday 1/25 - Tuesday 1/27
Stormlover74 replied to TriPol's topic in New York City Metro
Yeah start conservative and adjust later on -
HRRR at 38 hours? Why
-

January 24-26: Miracle or Mirage Thread 2
SomeguyfromTakomaPark replied to mappy's topic in Mid Atlantic
That's one thing I love not seeing on the models. The absolute worst thing the models can show is the WAA precip going north to PA and we don't get anything. In this situation it appears we will most likely get the WAA precip even if things shift either north or south. -

January 25/26 Jimbo Back Surgery Storm
Blacksburg Coach replied to Jimbo!'s topic in Southeastern States
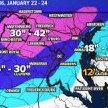
If EURO/GFS Low Temps verify. Lowest Temps for these locations since... Charlotte- - ( 7 - 2015) Greensboro- (-8 - 1985) Roanoke- (-11 - 1985) Asheville - (-4 1994) Wilmington- (11 1996) Raleigh -( 1 -2000) -
56F for the high at DCA, 57F in upper NW
-

Possible Record Breaking Cold + Snow Sunday 1/25 - Tuesday 1/27
wthrmn654 replied to TriPol's topic in New York City Metro
As strong high pressure retreats to the NE late Sat night into Sunday, an expansive winter storm will impact the area from then into Mon. Primary low pressure moving into the TN valley on Sunday should dissipate while a secondary low forms near Cape Hatteras and the VA capes, and then moves to a position just inside the 40N/70W benchmark. Snow should begin in the NYC metro area after midnight Sat night and spread NE to the rest of the CWA by daybreak, with some accumulation of 1-2 inches possible by daybreak for the NYC metro area. Heavy snow is then likely daytime Sunday into Sunday evening via strong front-end H7-8 frontogenetic and thermal forcing aided by an anticyclonic upper jet to the north. Given the cold air mass in place, snow ratios look to be on the high side (15:1) at the onset, and then settle down a little closer to 12:1 as heavier precip arrives and the low to mid levels slowly warm. Depending on the ultimate track of the system, it remains possible enough warm air could intrude aloft to force a brief mix with sleet and/or freezing rain Sunday night, especially for NYC and Long Island. Have only mentioned a slight chance of this occurring, and at any rate the damage will have been done well before then as far as meeting 6+ inch snowfall amounts. Total QPF for the event should be roughly between 1.0-1.5 inches. Watch mentions a boilerplate 6-12 inches likely with localized accumulations over 12 inches, but the above QPF with higher snow ratios could yield widespread potential accumulations of over a foot. -

Possible Record Breaking Cold + Snow Sunday 1/25 - Tuesday 1/27
cleetussnow replied to TriPol's topic in New York City Metro
Its before the good stuff hits even. -
Absolutely awful map cause I don’t have any other way to make a map till I locate my computer but my general idea for snow totals.
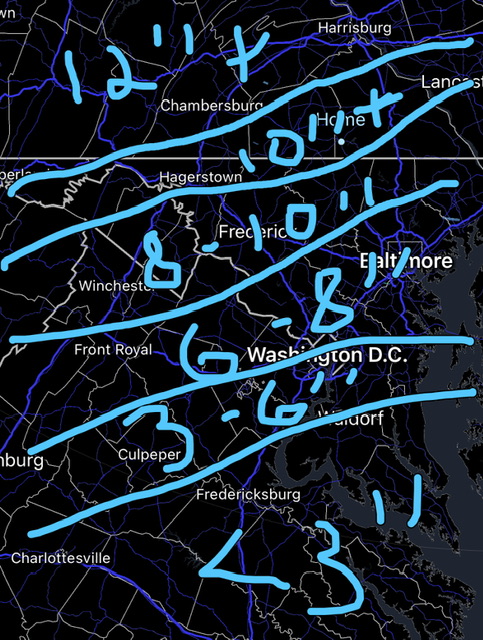
-
Temps have started falling around noon.
-

January 24-26: Miracle or Mirage JV/Banter Thread!
pazzo83 replied to SnowenOutThere's topic in Mid Atlantic
don't anger the models!!!