All Activity
- Past hour
-
It is absolute ass outside. DP 74° but it feels like it’s 125% humidity. Just cut grass and it crushed me.
-
77F/75 DP 93% RH with sun out now. It feels awful.
-

E PA/NJ/DE Summer 2026 Obs/Discussion
Hurricane Agnes replied to PhiEaglesfan712's topic in Philadelphia Region
Round 3 here in NW Philly with another thin but potent band coming through with > 2"/ hr rates. Now at 1.79" at post time Temp 76/dp 74.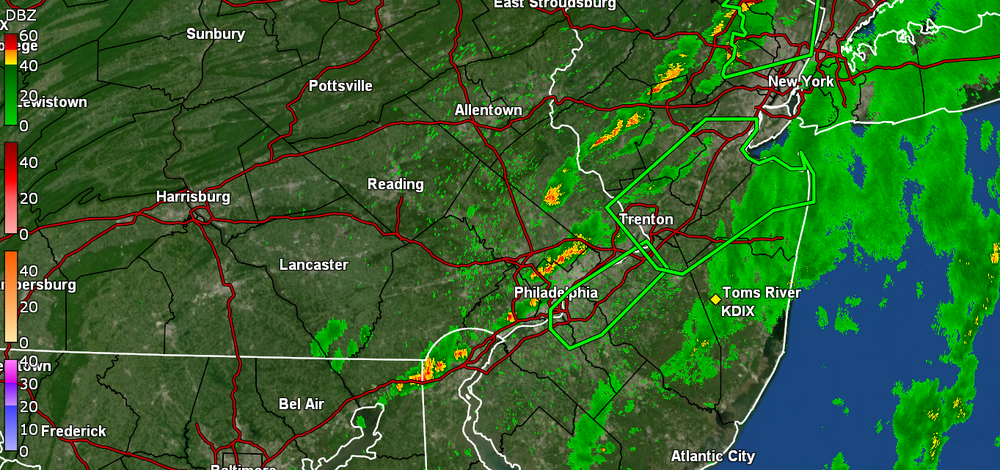
-
Up to 2.04" for this event. 11.84" since July 1. Just about a foot of rain.
-

Augdewst 2026: Summer's Last Stand
CoastalWx replied to Prismshine Productions's topic in New England
Almost half inch -
.thumb.jpg.aec747d13df1d95d5fed34574f74d4fd.jpg)
Augdewst 2026: Summer's Last Stand
Vinny Findley replied to Prismshine Productions's topic in New England
2.2 in Cranston 1/4 mile east of 295 and South on route 14 -

Augdewst 2026: Summer's Last Stand
Damage In Tolland replied to Prismshine Productions's topic in New England
The rain over PVD is yours -
Augdewst 2026: Summer's Last Stand
CoastalWx replied to Prismshine Productions's topic in New England
Not this Wey -
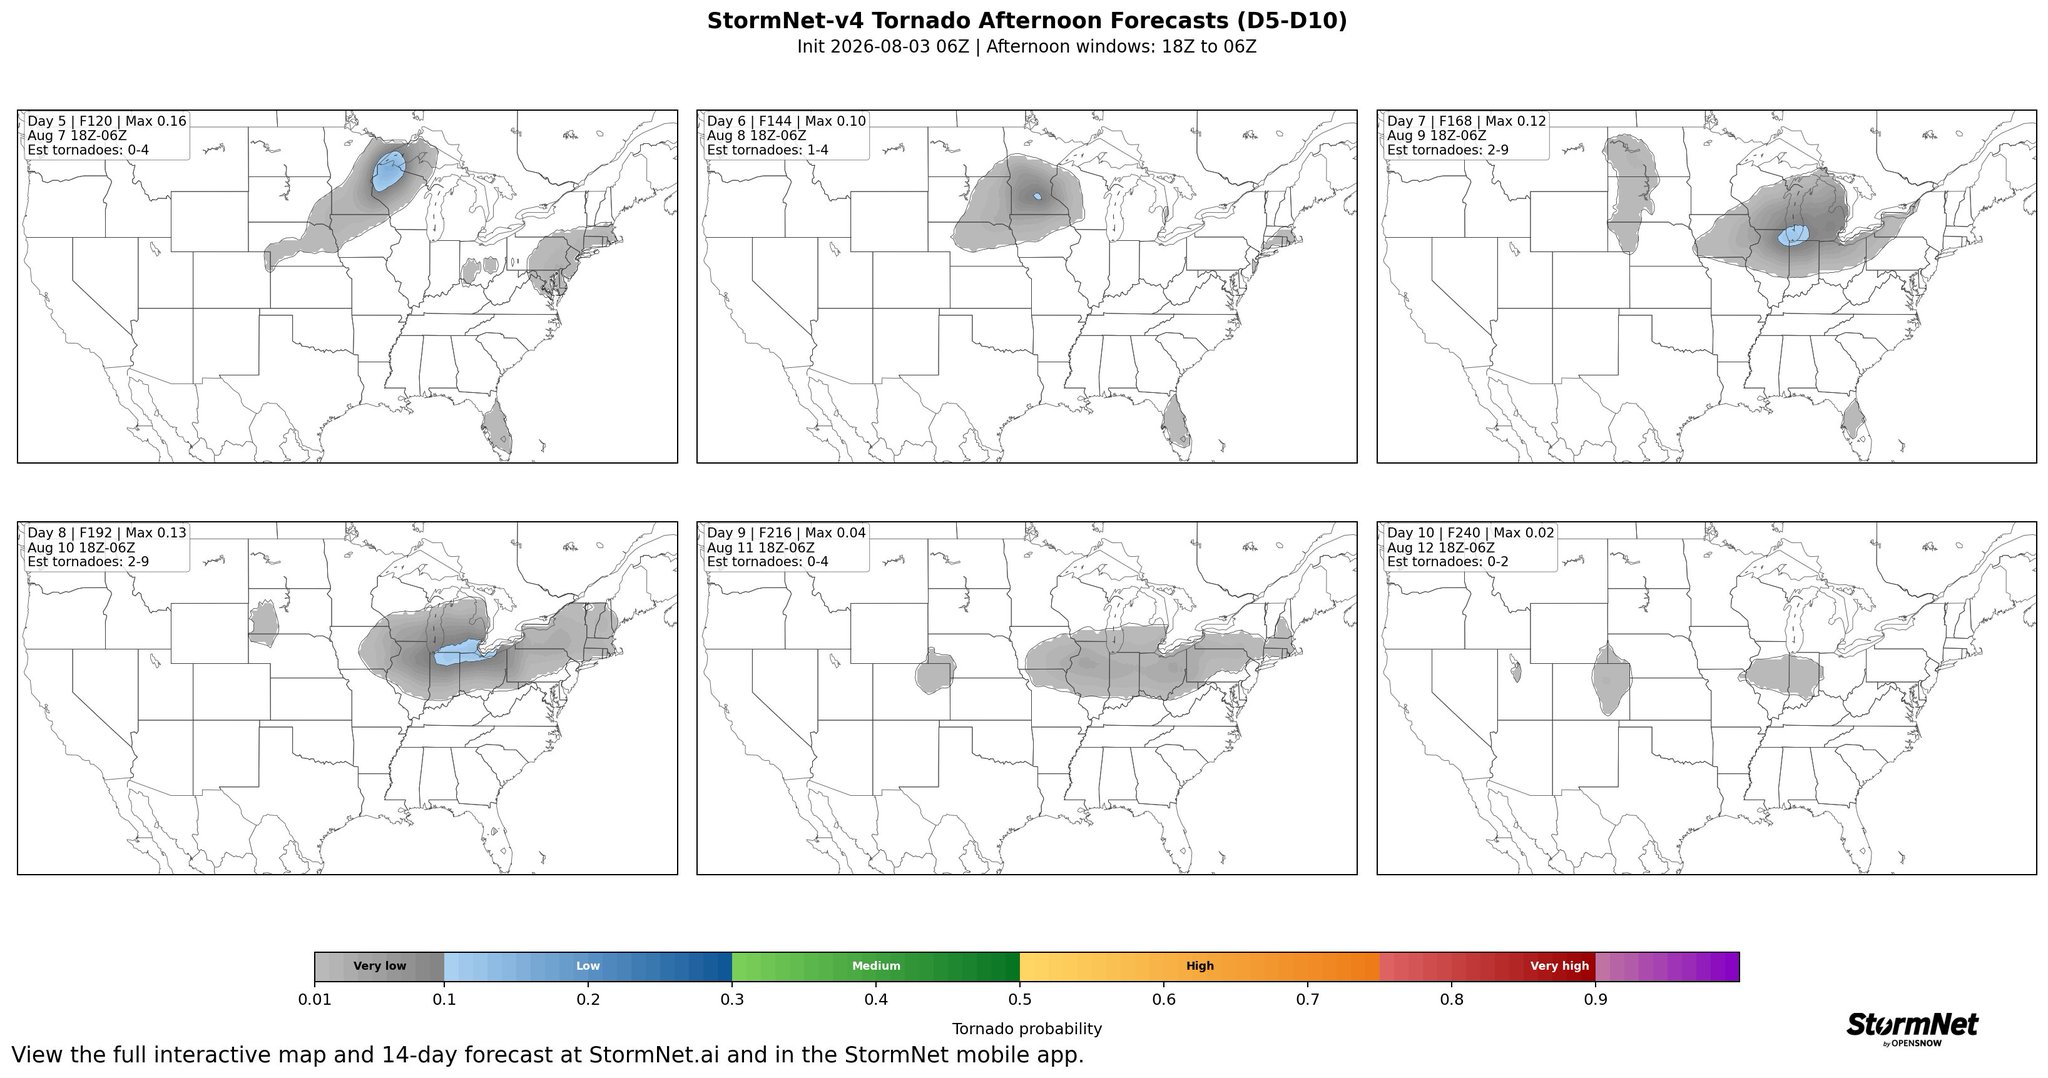
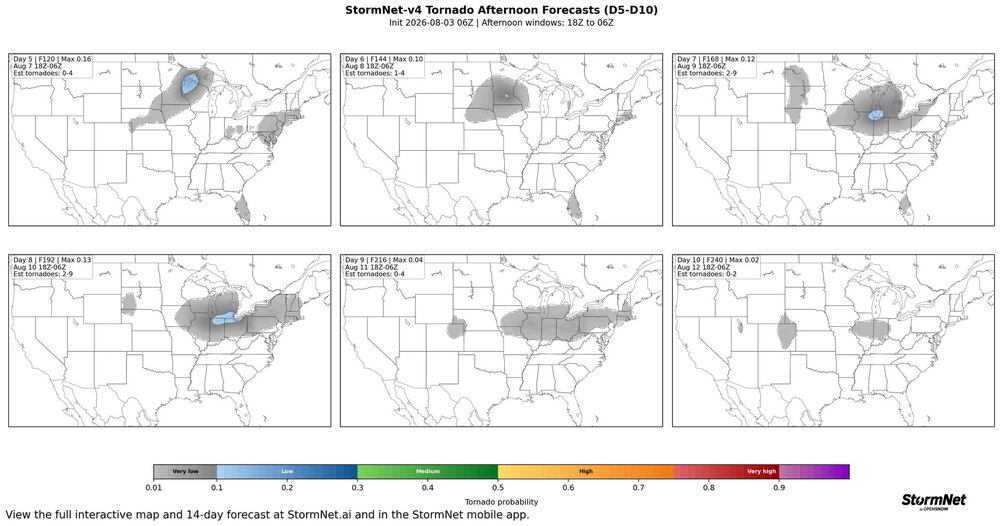
Long range but neat
-

Augdewst 2026: Summer's Last Stand
dendrite replied to Prismshine Productions's topic in New England
Even the wife with the mustache getting wet.
-
Not flat / hilly slope and closer to tree line though not under it
-
Early summer 10-3 Now 11:30-2:30 Winter an hour or two depending
-
To be fair, I had that issue when I had a Vantage Vue years ago even though it was out in the yard. That said, it's kind of hard to believe that the deck/house doesn't impact your temps. You mentioned its accurate in the sun, how much sun do you get on the deck back there?
-
Just put it down on that grassy area at base of stairs.
-
Augdewst 2026: Summer's Last Stand
Damage In Tolland replied to Prismshine Productions's topic in New England
That band is headed right at S Wey. No way that misses -

Augdewst 2026: Summer's Last Stand
Baroclinic Zone replied to Prismshine Productions's topic in New England
gotta be 2-3” at home now -
Augdewst 2026: Summer's Last Stand
Damage In Tolland replied to Prismshine Productions's topic in New England
Each wife in the river . The city of Taunton has exhausted all available resources -
Pretty sure my rain guage was empty yesterday. I know it rained a lot but I got 3 1/4" in the guage now in se Bergen County.
-

Augdewst 2026: Summer's Last Stand
RUNNAWAYICEBERG replied to Prismshine Productions's topic in New England
Wives coming to rescue Brett and meeting each other for the first time… wife 1 - I’m his wife wife 2 - no FU, I’m his wife wife 3 - fuk this, let him drown -
Augdewst 2026: Summer's Last Stand
CoastalWx replied to Prismshine Productions's topic in New England
How many rescued already? -
Augdewst 2026: Summer's Last Stand
bristolri_wx replied to Prismshine Productions's topic in New England
Torrential on the way from Bristol to Providence over the last 45 minutes. Portions of 114 Wampanoag Trail flooded. -
Augdewst 2026: Summer's Last Stand
Damage In Tolland replied to Prismshine Productions's topic in New England
Multiple Wife rescues on the Taunton River? -
Augdewst 2026: Summer's Last Stand
RUNNAWAYICEBERG replied to Prismshine Productions's topic in New England
FFW just to his SW but TWives has 0.25” lol. -

2026-2027 Super El Nino
GaWx replied to Stormchaserchuck1's topic in Weather Forecasting and Discussion
From that same pro-met, the strong support for a solid La Niña by next fall is there. This is just for ASO: If you look at RONI values that exceeded 1.0 in ASO, the higher end events almost always resulted in La Nina by the next year's ASO:1957: 1.2 -> 0.21963: 1.0 -> -0.61965: 1.9 -> 0.01972: 1.7 -> -1.51982: 1.8 -> -0.61987: 1.5 -> -1.41994: 1.0 -> -0.71997: 2.3 -> -1.52002: 1.3 -> 0.22015: 1.9 -> -1.12023: 1.1 -> -0.8 -

2026-2027 Super El Nino
PhiEaglesfan712 replied to Stormchaserchuck1's topic in Weather Forecasting and Discussion
July 2026 PDO: -2.03