All Activity
- Past hour
-

2026-2027 Record-breaking El Nino
mitchnick replied to Stormchaserchuck1's topic in Weather Forecasting and Discussion
Lower mean today....underwater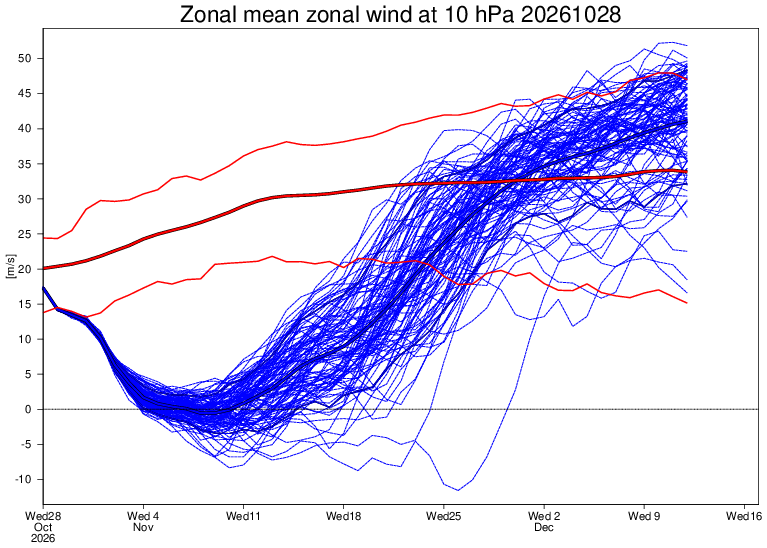
-

2026-2027 Record-breaking El Nino
MJO812 replied to Stormchaserchuck1's topic in Weather Forecasting and Discussion
So the pattern will not get colder even if its brief ? ^ -
As already noted, same idea with hurricanes. Personal significant ice storms: Jan 1953 NNJ: 1-1.5", every tall tree lost limbs or snapped completely, lost power for 6 days. Dec 1970 NNJ: 0.7-0.8", took out some large branches, short power outage. Dec 1983 Fort Kent: Similar to 12/70. Jan 1998 Gardiner: 1.5"+, possibly the widest area with heavy heavy damage, outage. We lost power 4 days, phone 13 days. Other than those, none even reaching 1/2" - nothing bigger than 1/4" since '98.
-
Honestly, no need to do that. The ones who cancel winter every year before it begins and tout warm this and snowless that absolutely disappear in spring when its time to own up on their massive fails- they just start touting how warm the next winter will be.
-
Life would absolutely SUCK without the 4 seasons we are fortunate to get. That said, this weather has been perfect to enjoy the beauty of Fall.
-
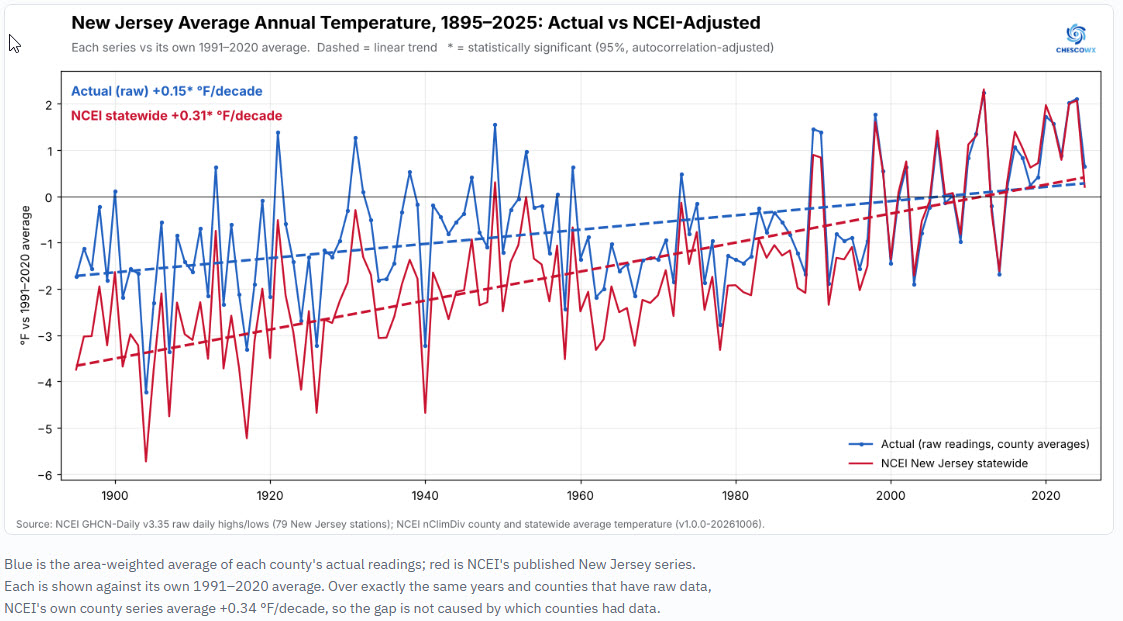
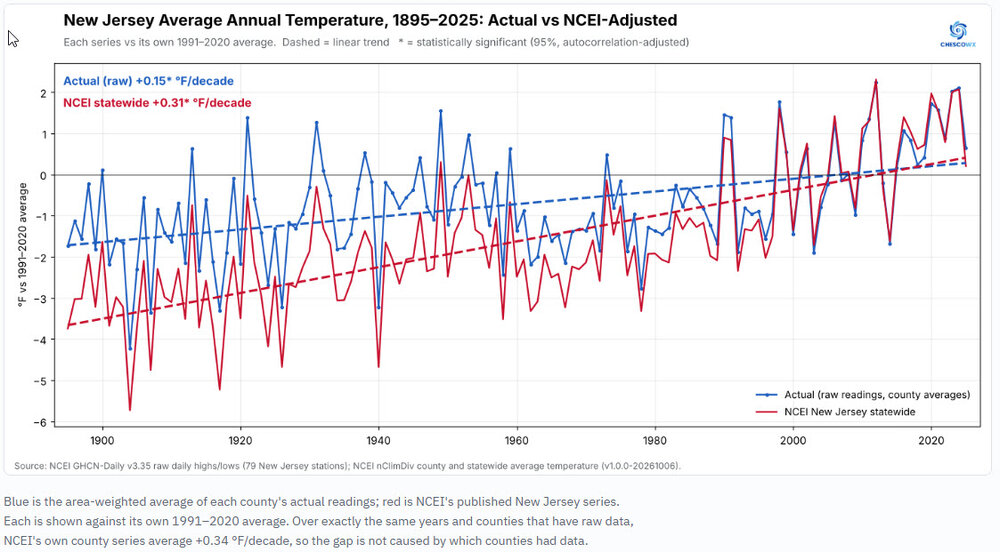
 Our 2nd state in the Nationwide Actual Raw vs. NCEI Adjusted Study for New Jersey is now available for review and download. For much more detail including study design, by decade breakdowns, county by county maps and breakdowns for all State Counties that compare actual vs NCEI trends for each NJ county please go to https://chescowx.com/raw-vs-ncei-state-by-state/ The main finding The NWS raw trained observer temperatures show significant warming in New Jersey since 1895 (+0.15 °F per decade). NCEI's adjusted temperatures show about twice as much warming (+0.31 °F per decade). That difference between the two trend lines is statistically significant. Averaging what New Jersey's observers actually recorded, county by county and weighted by county area, gives +0.15 °F per decade from 1895 to 2025 (significant), about +2.0 °F in total. NCEI's published statewide series gives +0.31 °F per decade (significant), about +4.1 °F in total. NCEI's series runs 1.4–1.7 °F below the actual readings in every decade from 1895 through the 1940s; 0.7–1.1 °F below them in the 1950s to 1970s; 0.4–0.6 °F below them in the 1980s and 1990s; within 0.2 °F of them from 2000 on. NCEI's adjusted temperatures are lower than the actual readings in every decade from the 1890s through the 1990s.
-
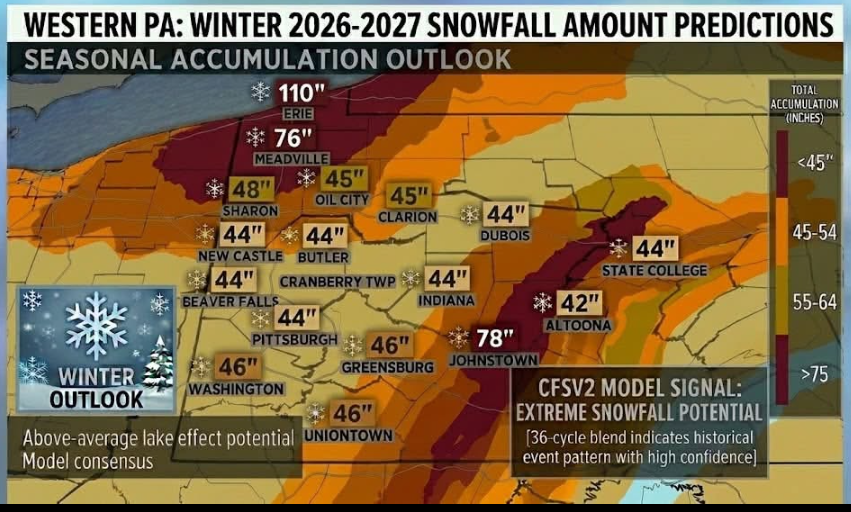
FINAL OUTLOOK FOR WINTER 2026-2027 (Western Pennsylvania Weather Forecaster) UPDATED!!!!! The threat of a polar vortex setting up in later November through mid December is looking a bit more likely. [OVERALL OUTLOOK] -December could start with early season arctic blasts and a potential early winter storm with Milder periods possible . It will began to get cold with frequent winter storms in mid January-March with polar vortex disruptions. Winter storms could include messy mixtures of sleet, freezing rain, and snow. The atmosphere will be well loaded with moister due to the super El Niño. With polar vortex disruptions, this will increase the chances for bigger snowstorms (8-12 Inches+). Above average snow likely with 45-55 inches of snow expected for the season. 140% of average snow. [MOTHLY OUTLOOK] {DECEMBER} - Potential for colder and snowier start due to the Polar Vortex then normal across much of the area. Temps could get very cold at times. Potential for Milder periods. Some winter storms possible mainly mixing or ice/snow. {JANUARY} -Colder with the threat of several winter storms. These could include mixtures of rain/freezing rain/sleet/snow especially in northwestern Pa. Southwestern Pa would have the higher chance of seeing all snow events or rain transitioning to snow events. {FEBRUARY} -Coldest air of winter will arrive in strong arctic blasts. Most Winter storms will more likely be all snow. Northwestern Pa could see storms mixing with ice. Potential for a few significant winter storms bringing as much as 12 inches + of snow in some areas. {MARCH} -Off and on arctic blasts with swings of warm and cold likely. Winter storms possible early month. Temperatures warm near the end of the month.
-
^that's not terrible at all
-

2026-2027 Record-breaking El Nino
forkyfork replied to Stormchaserchuck1's topic in Weather Forecasting and Discussion
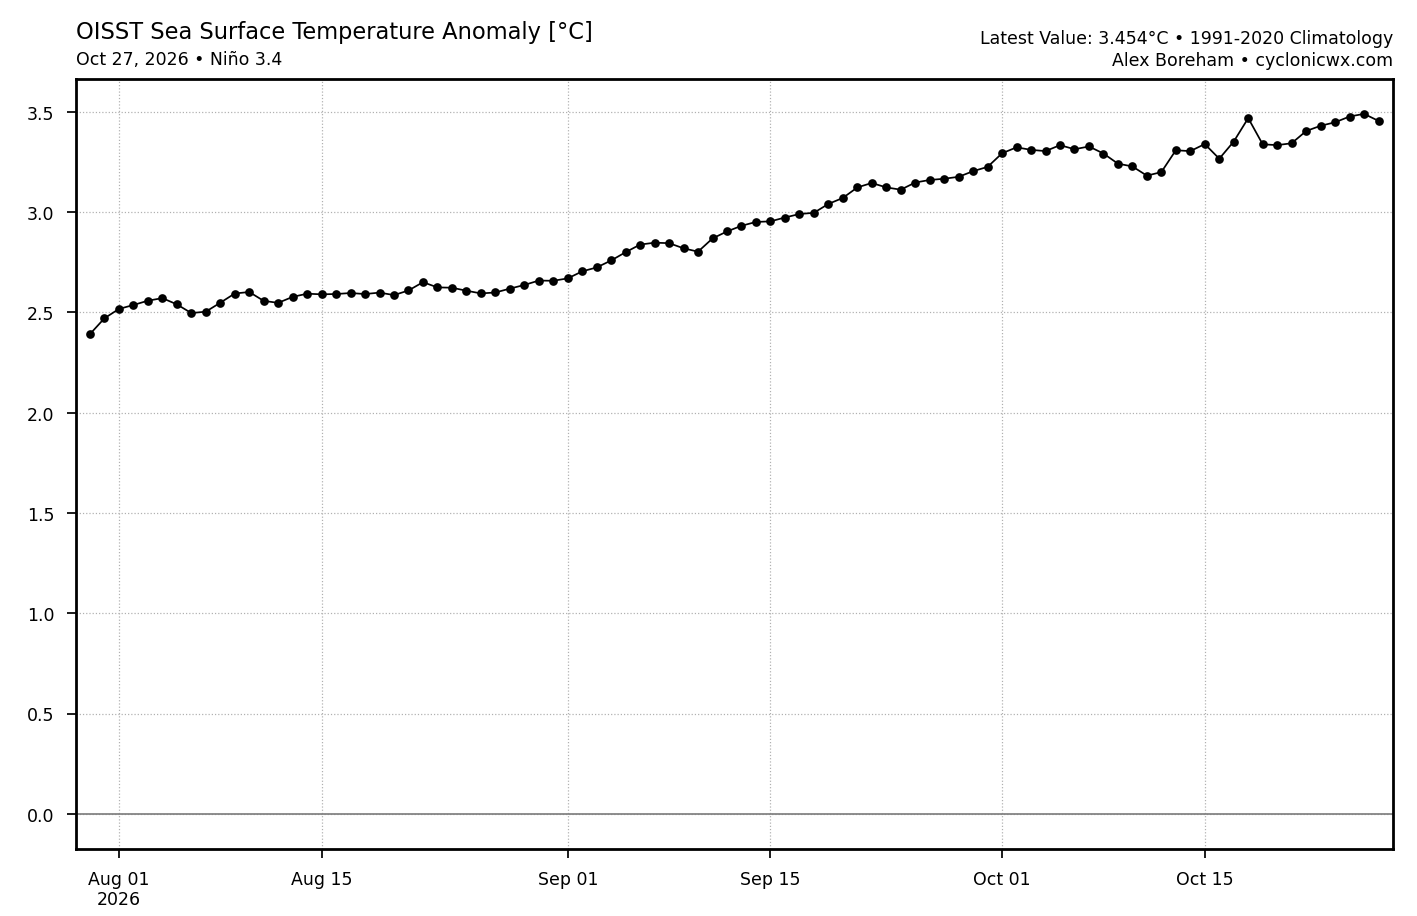
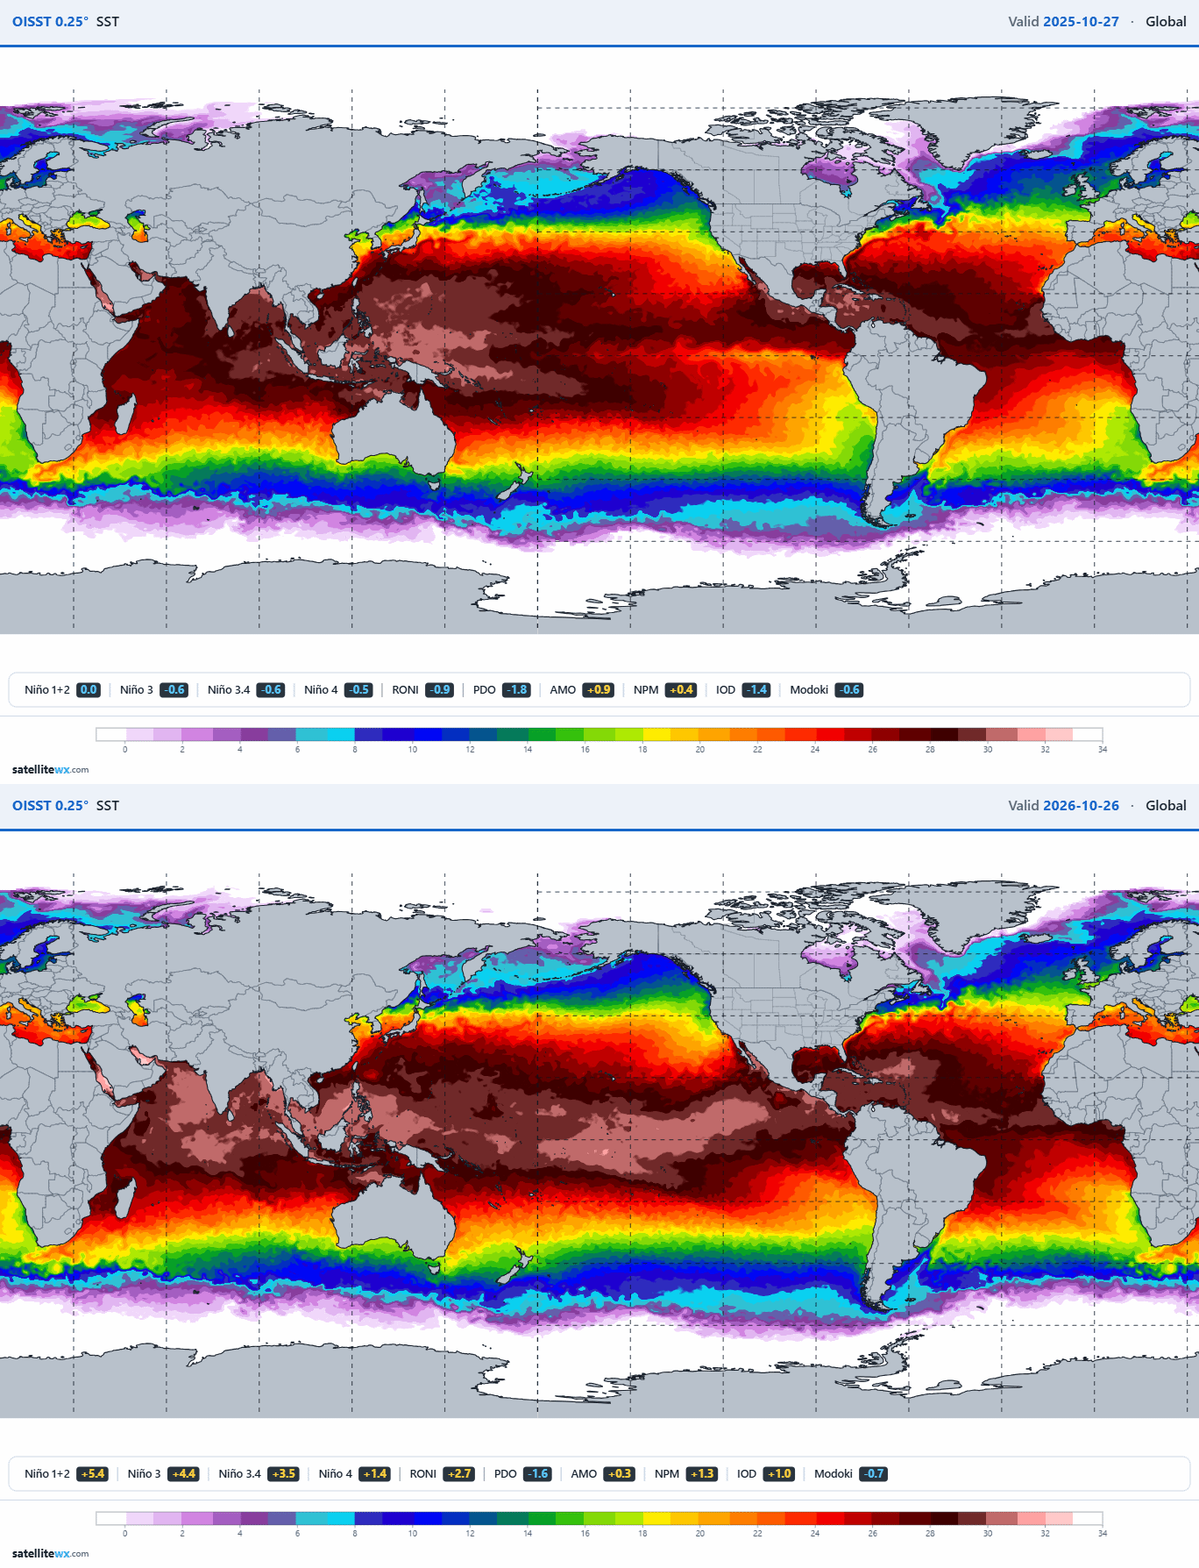
yes. i was wrong about the anomaly. it's actually +3.5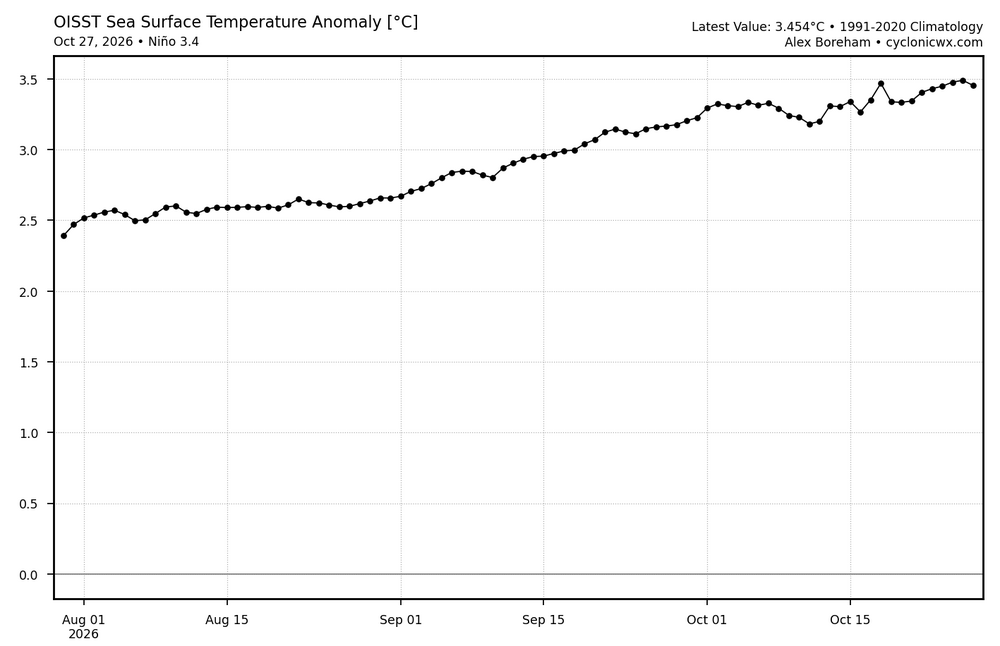
-
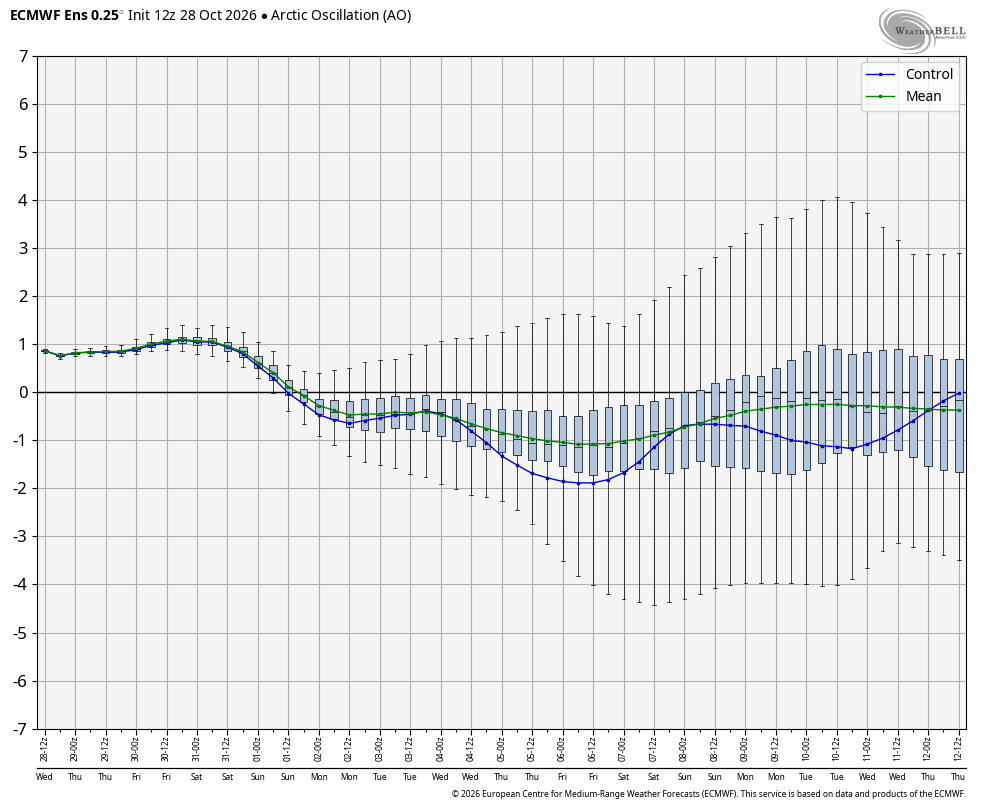
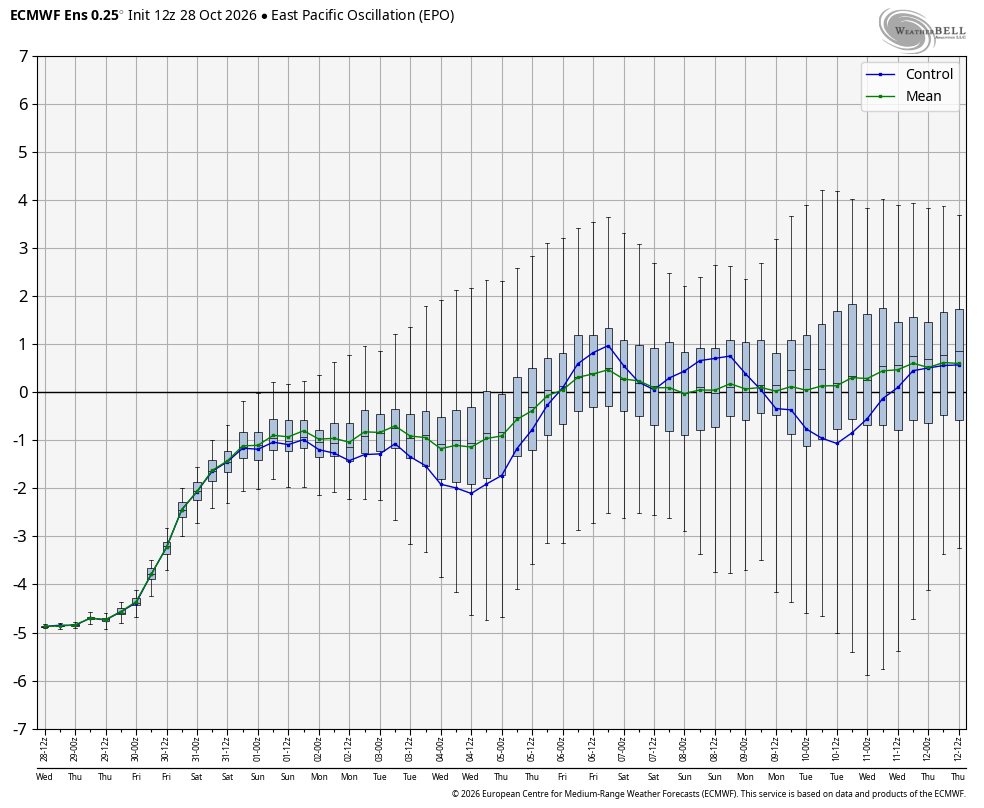
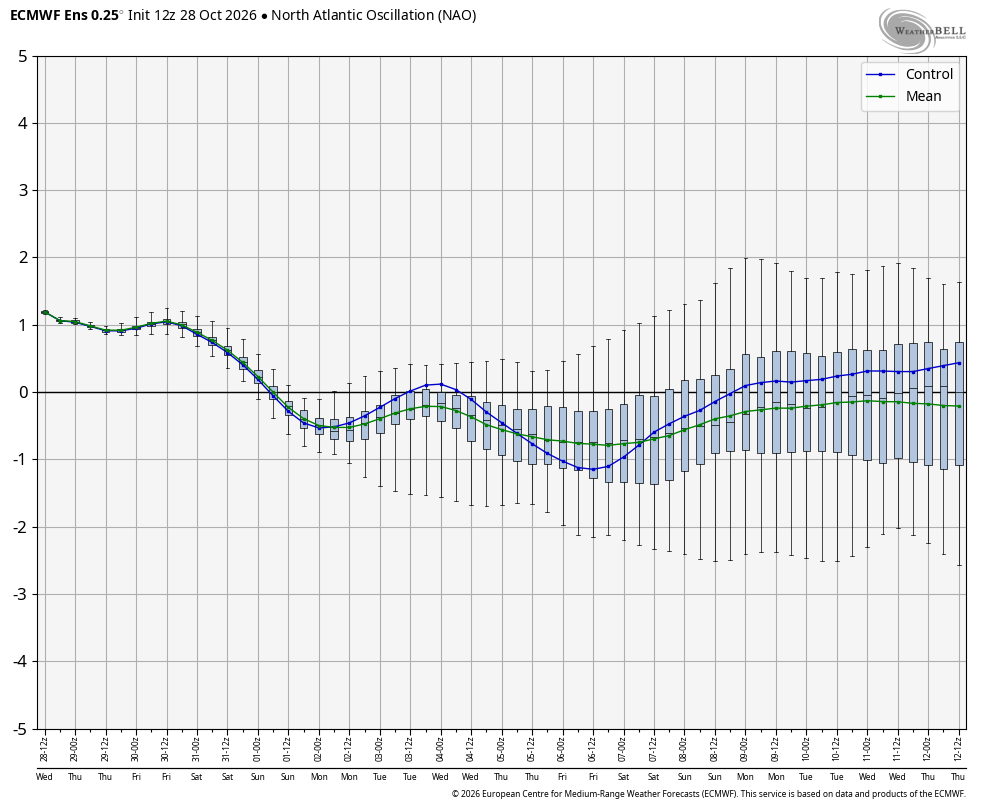
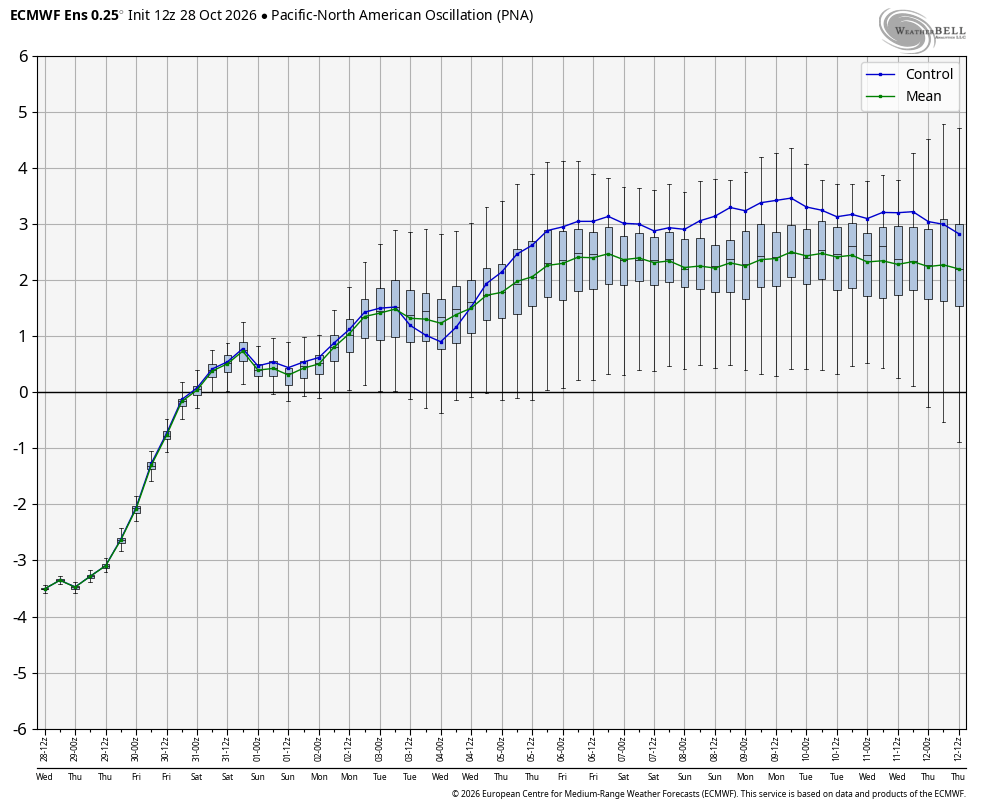
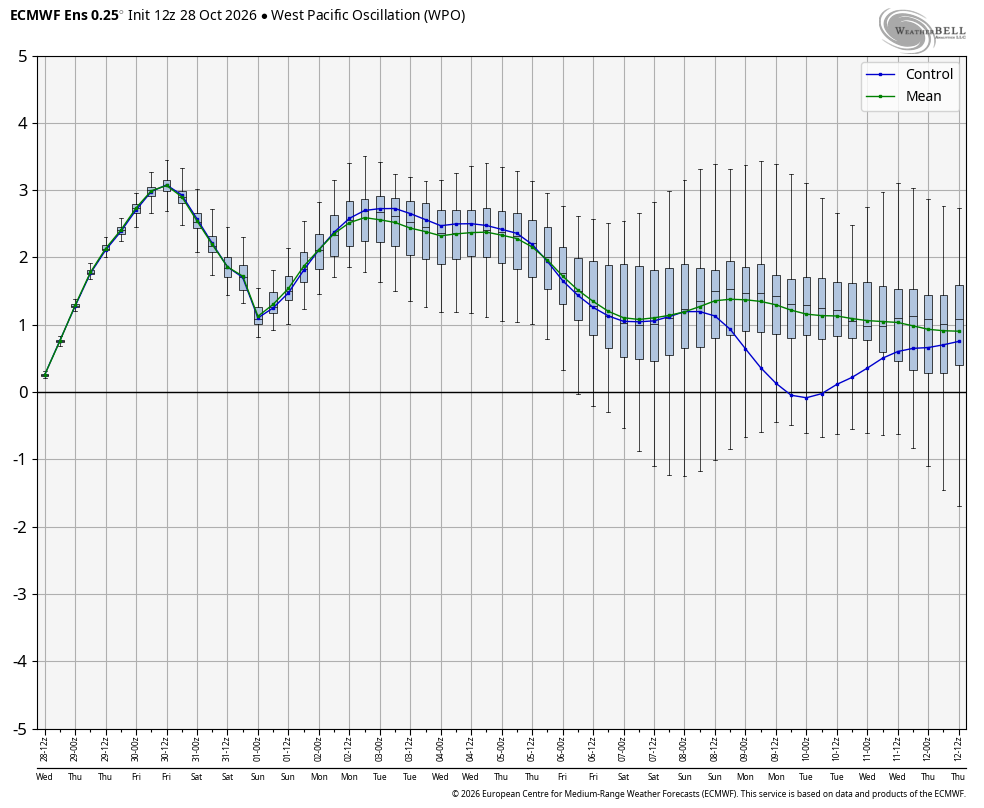
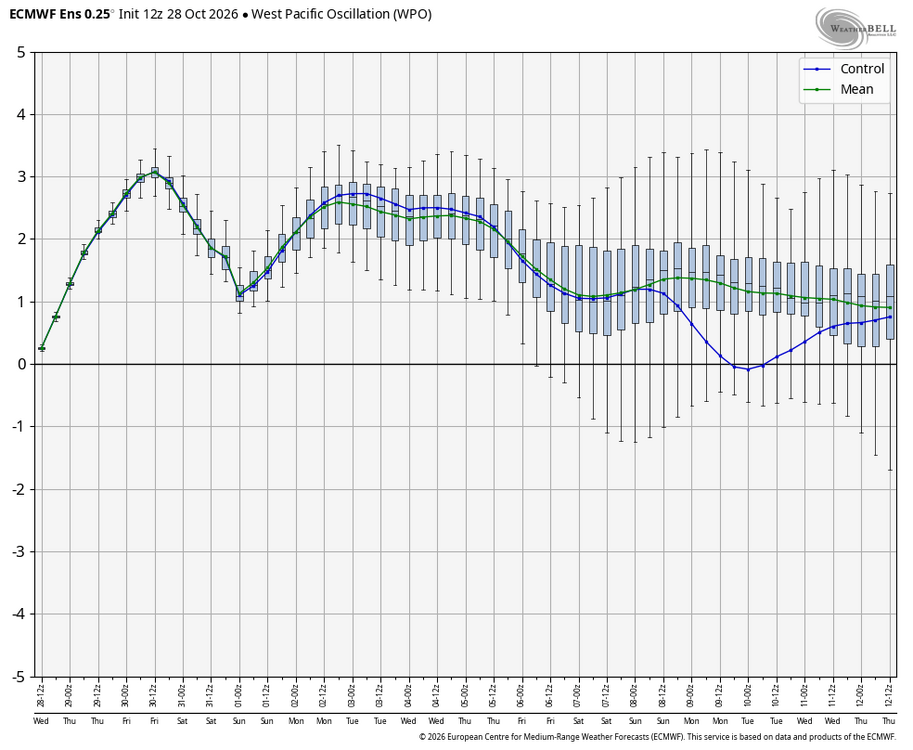
WB 12Z EPS teleconnection charts. Not bad. Need to work on the EPO and WPO. Actually, if the PNA verifies, it looks really good.
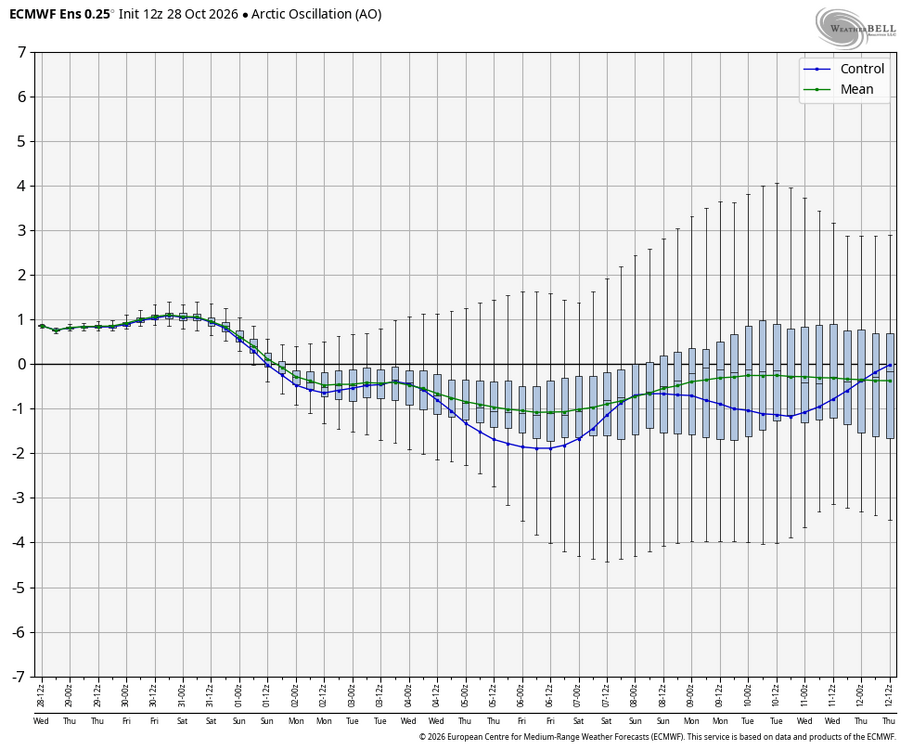
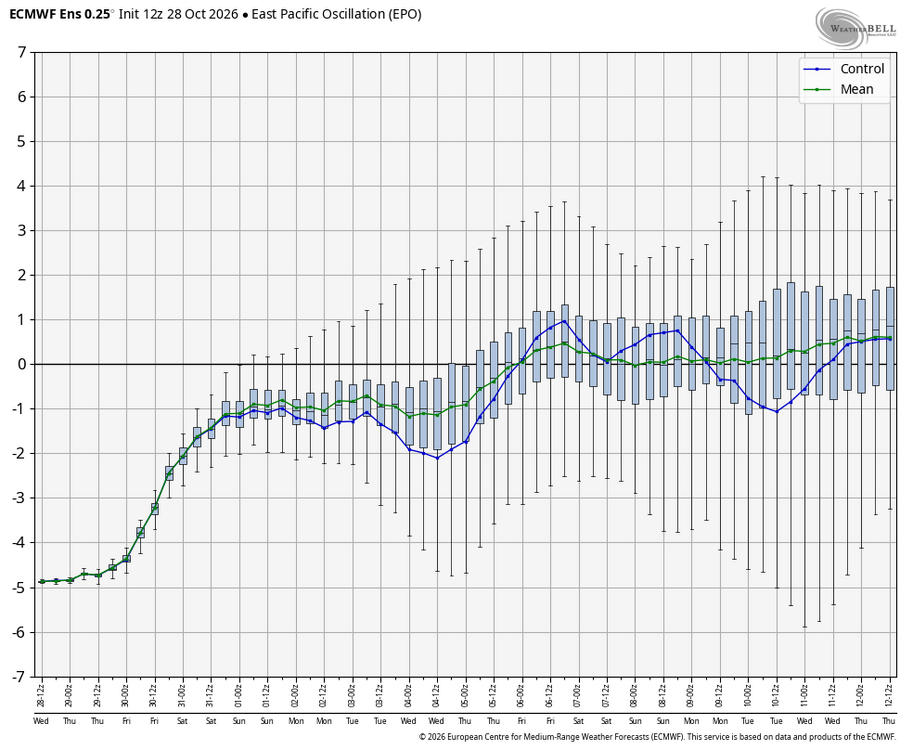
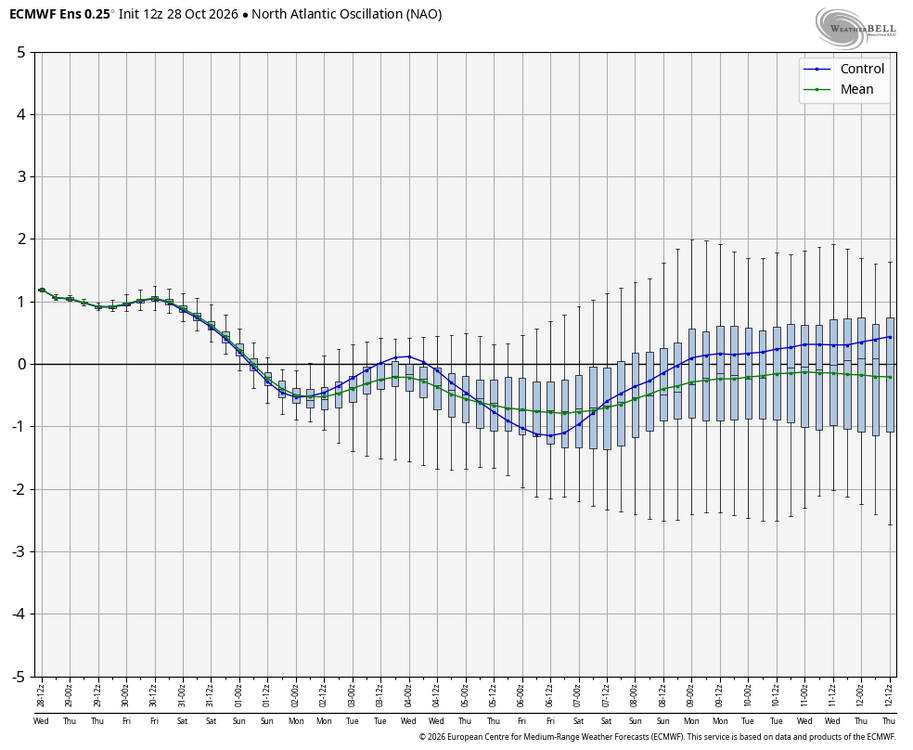
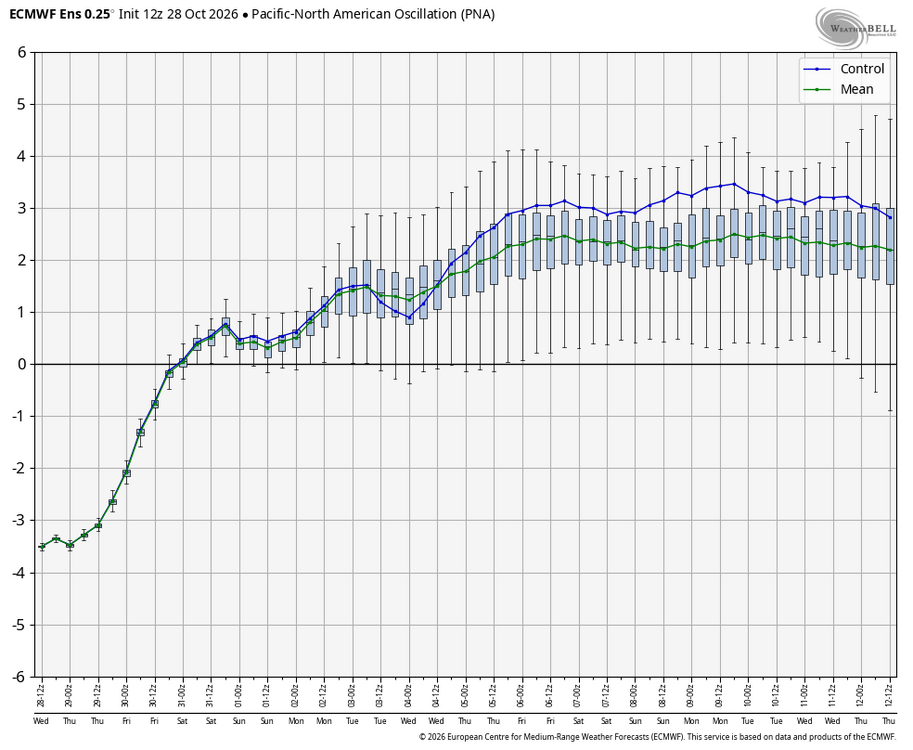
-

2026-2027 Record-breaking El Nino
GaWx replied to Stormchaserchuck1's topic in Weather Forecasting and Discussion
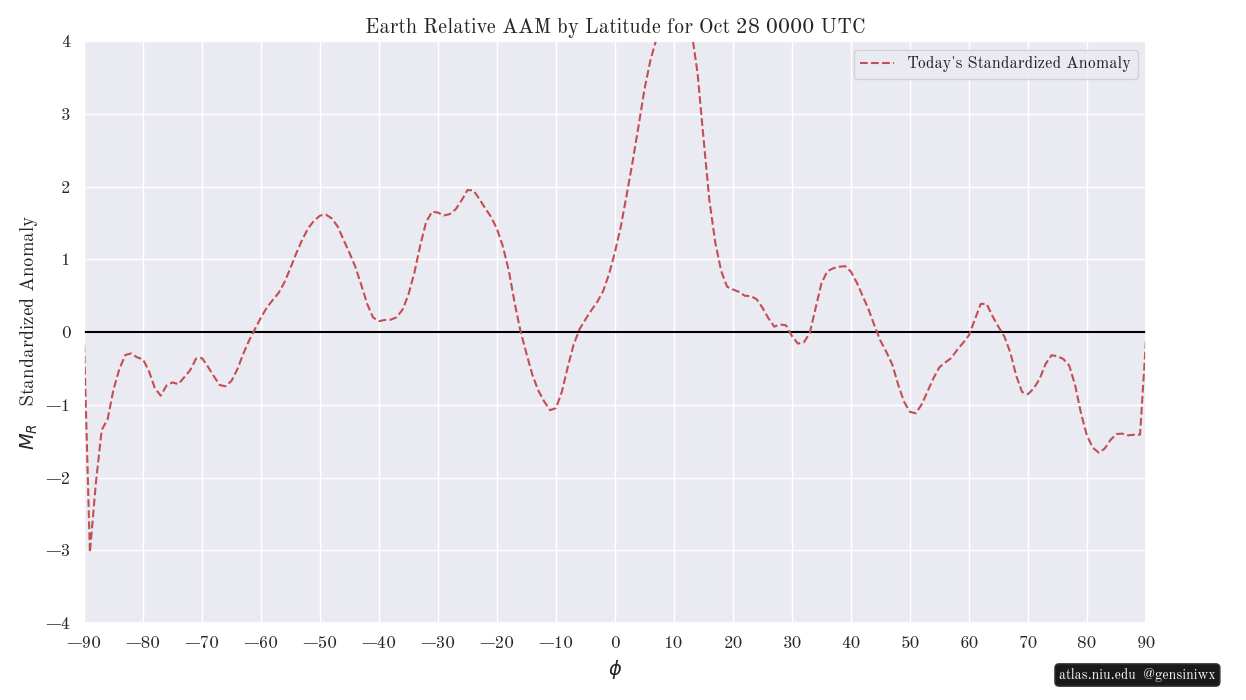
It’s not +3. It’s ~+2.6 per NOAA. Record for any week is +2.9: https://www.cpc.ncep.noaa.gov/data/indices/rel_wksst9120.txt Meanwhile there’s this to look at that shows strong +AAM still S of 30N: @40/70 Benchmark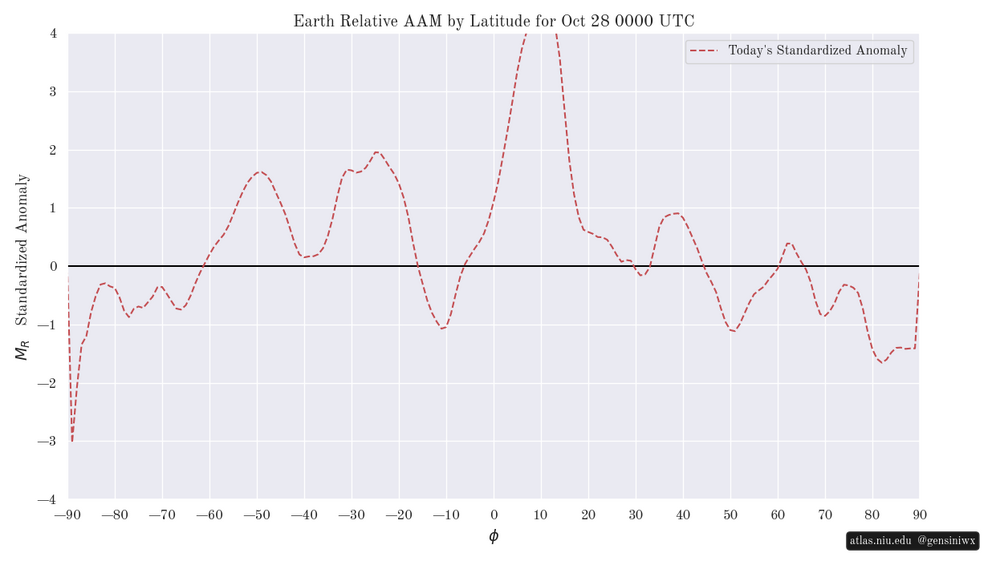
-
Ahhh .. and yes I'm sure payback will be a bitch.
-
Also seems about time for a massive asteroid strike.
-
We are also due for a cane…but that hasn’t happened either.
-
2026-2027 Record-breaking El Nino
forkyfork replied to Stormchaserchuck1's topic in Weather Forecasting and Discussion
remember in april when you hive members were trying to will this event under +2 because you knew it would be really bad for cold and snow this winter? now it's +3 and you're willing some kind of magic block that will defeat the pacific vortex -

2026-2027 Record-breaking El Nino
snowman19 replied to Stormchaserchuck1's topic in Weather Forecasting and Discussion
In the last 50+ years, the super El Niño that most closely resembles this one in development/evolution, forcing and orientation (even though this one is much stronger and more east-based) is 1997, hands down -

2026-2027 Fall/Winter Mountain Thread
eyewall replied to BlueRidgeFolklore's topic in Southeastern States
Thank you all. It does not look like I am going to find the time to get there but I am glad I took the trip I did for the shots above. - Today
-
Starting to see the colors pop around here:
-
thank you for this thorough scientific analysis.
-

2026-2027 Record-breaking El Nino
jconsor replied to Stormchaserchuck1's topic in Weather Forecasting and Discussion
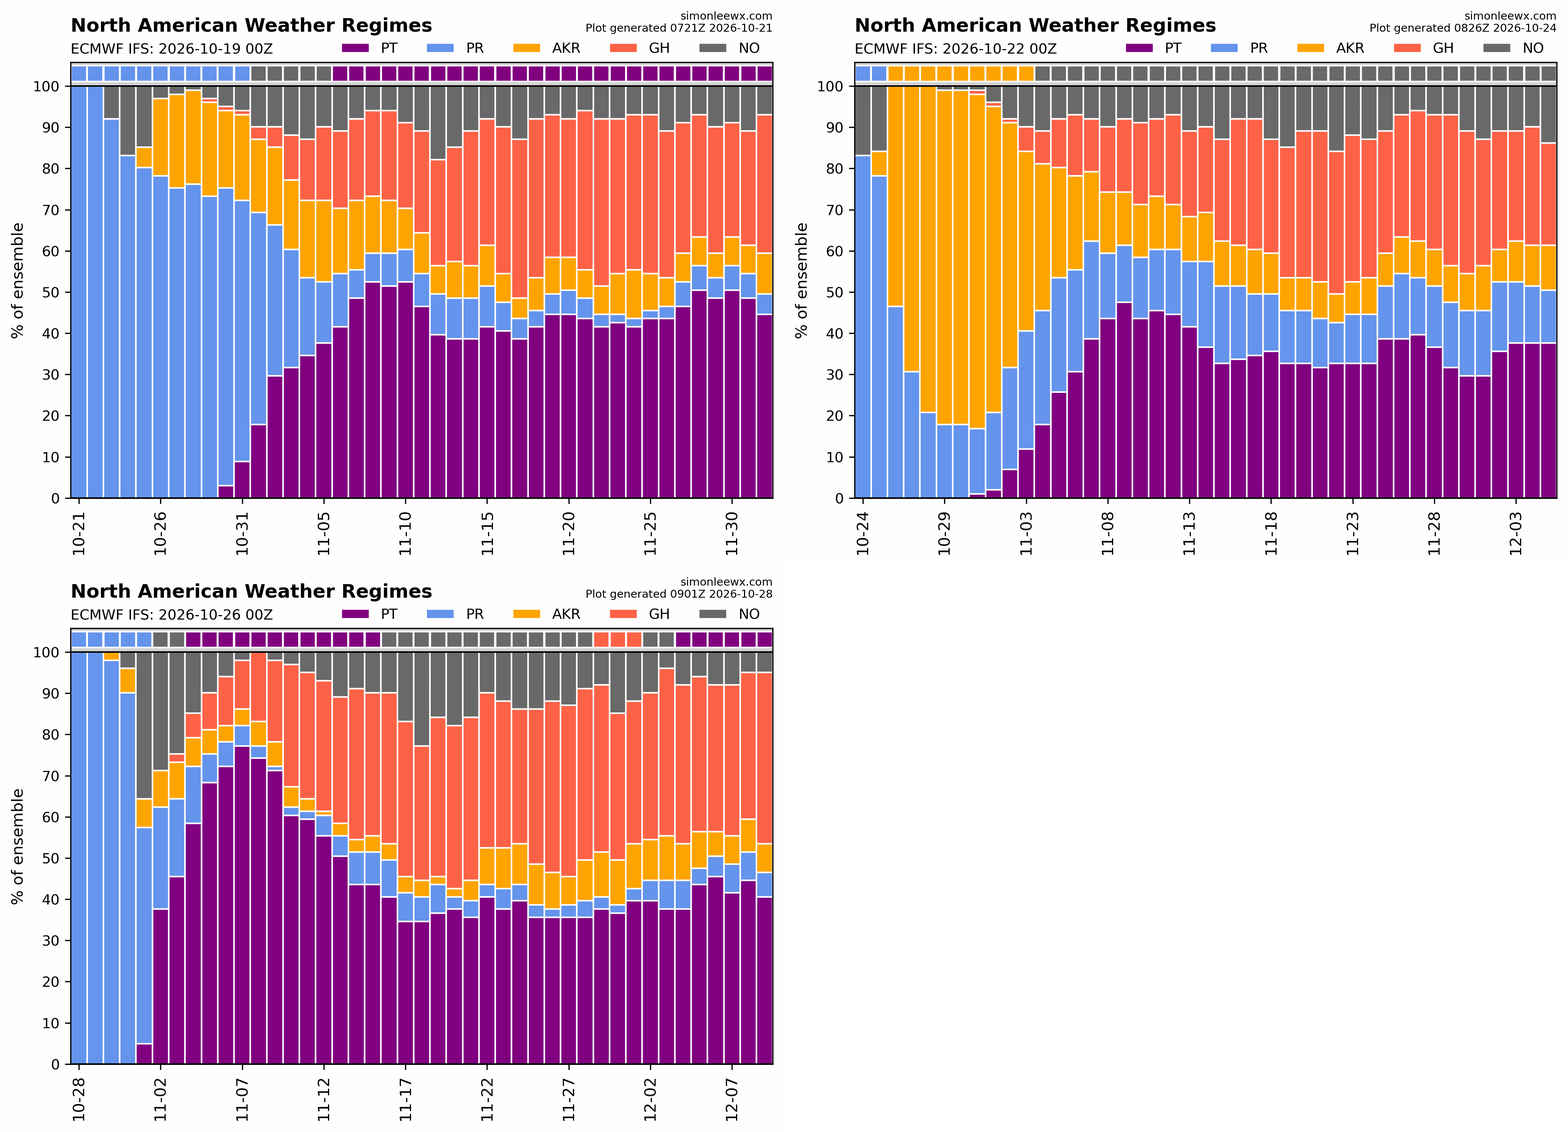
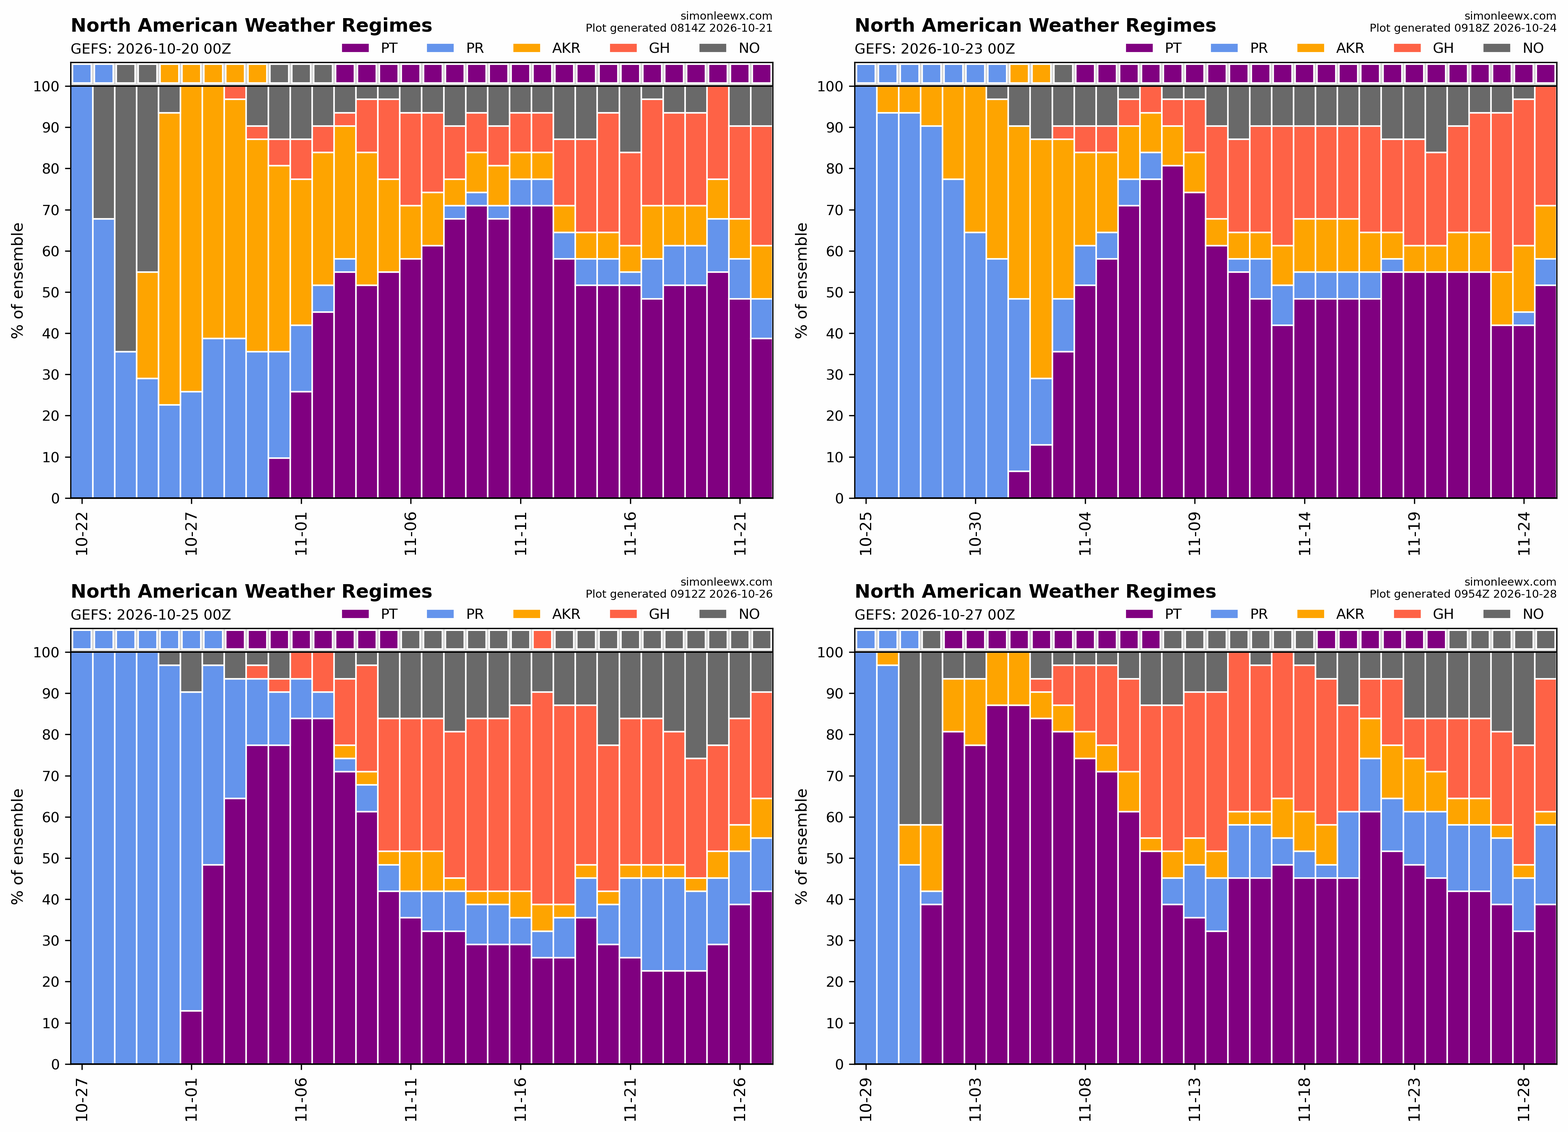
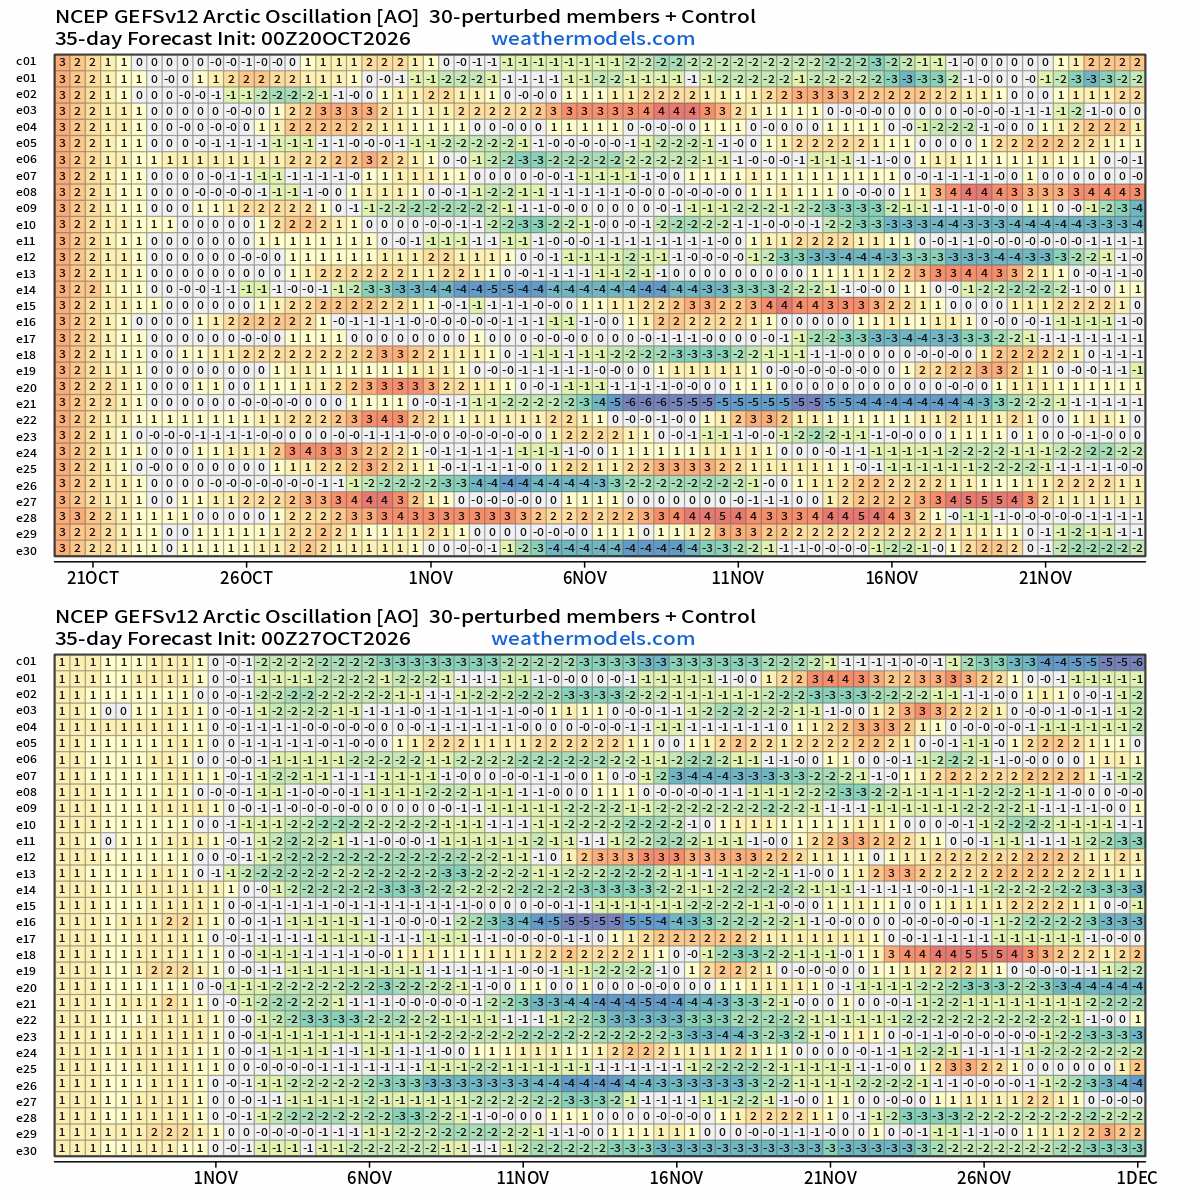
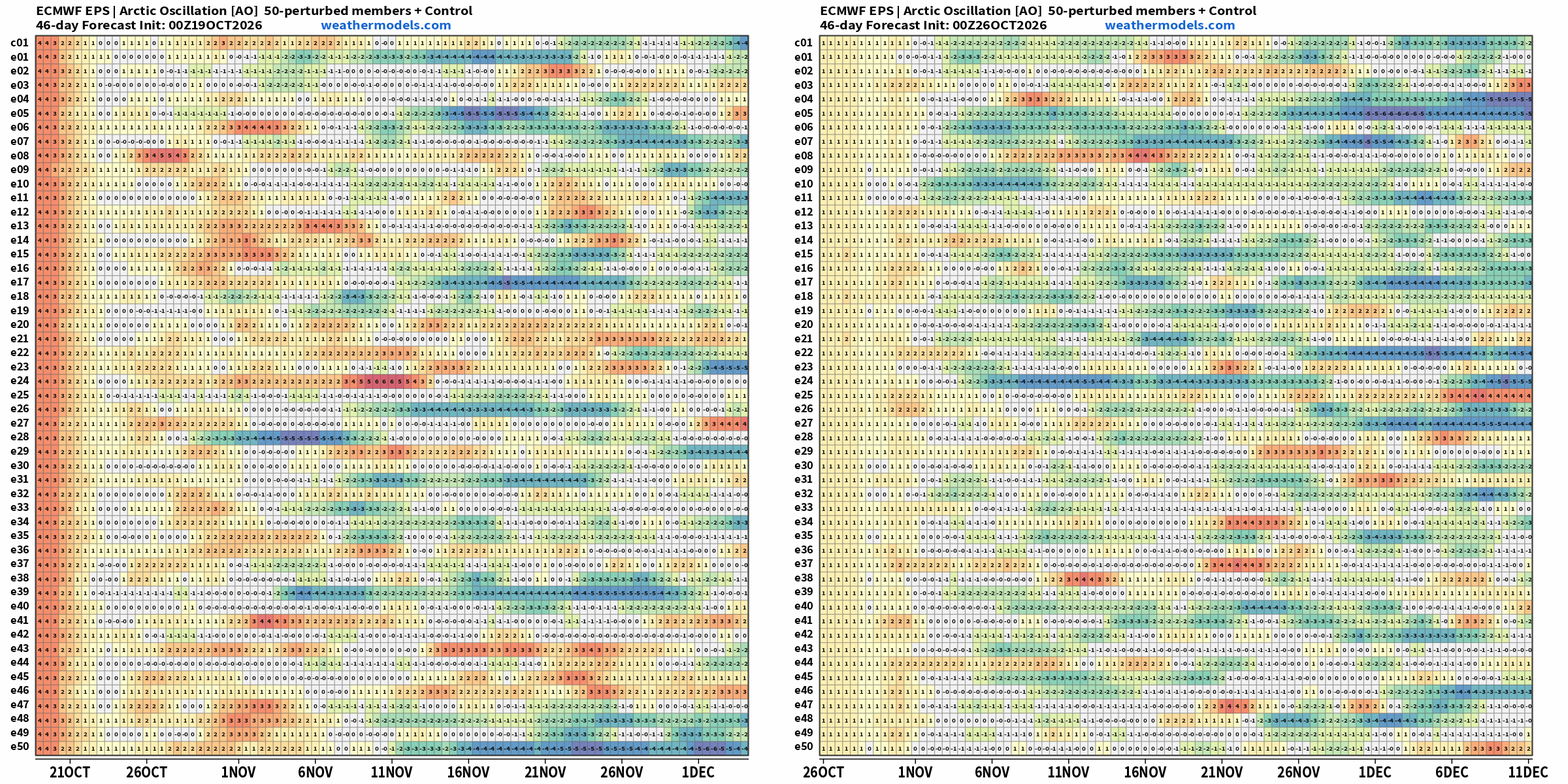
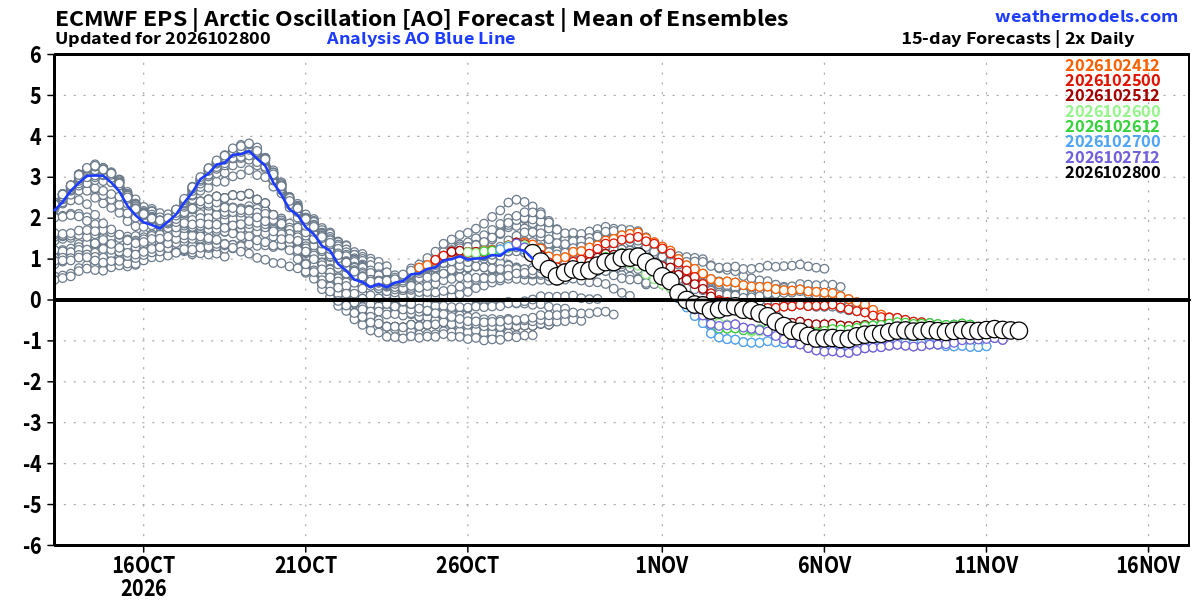
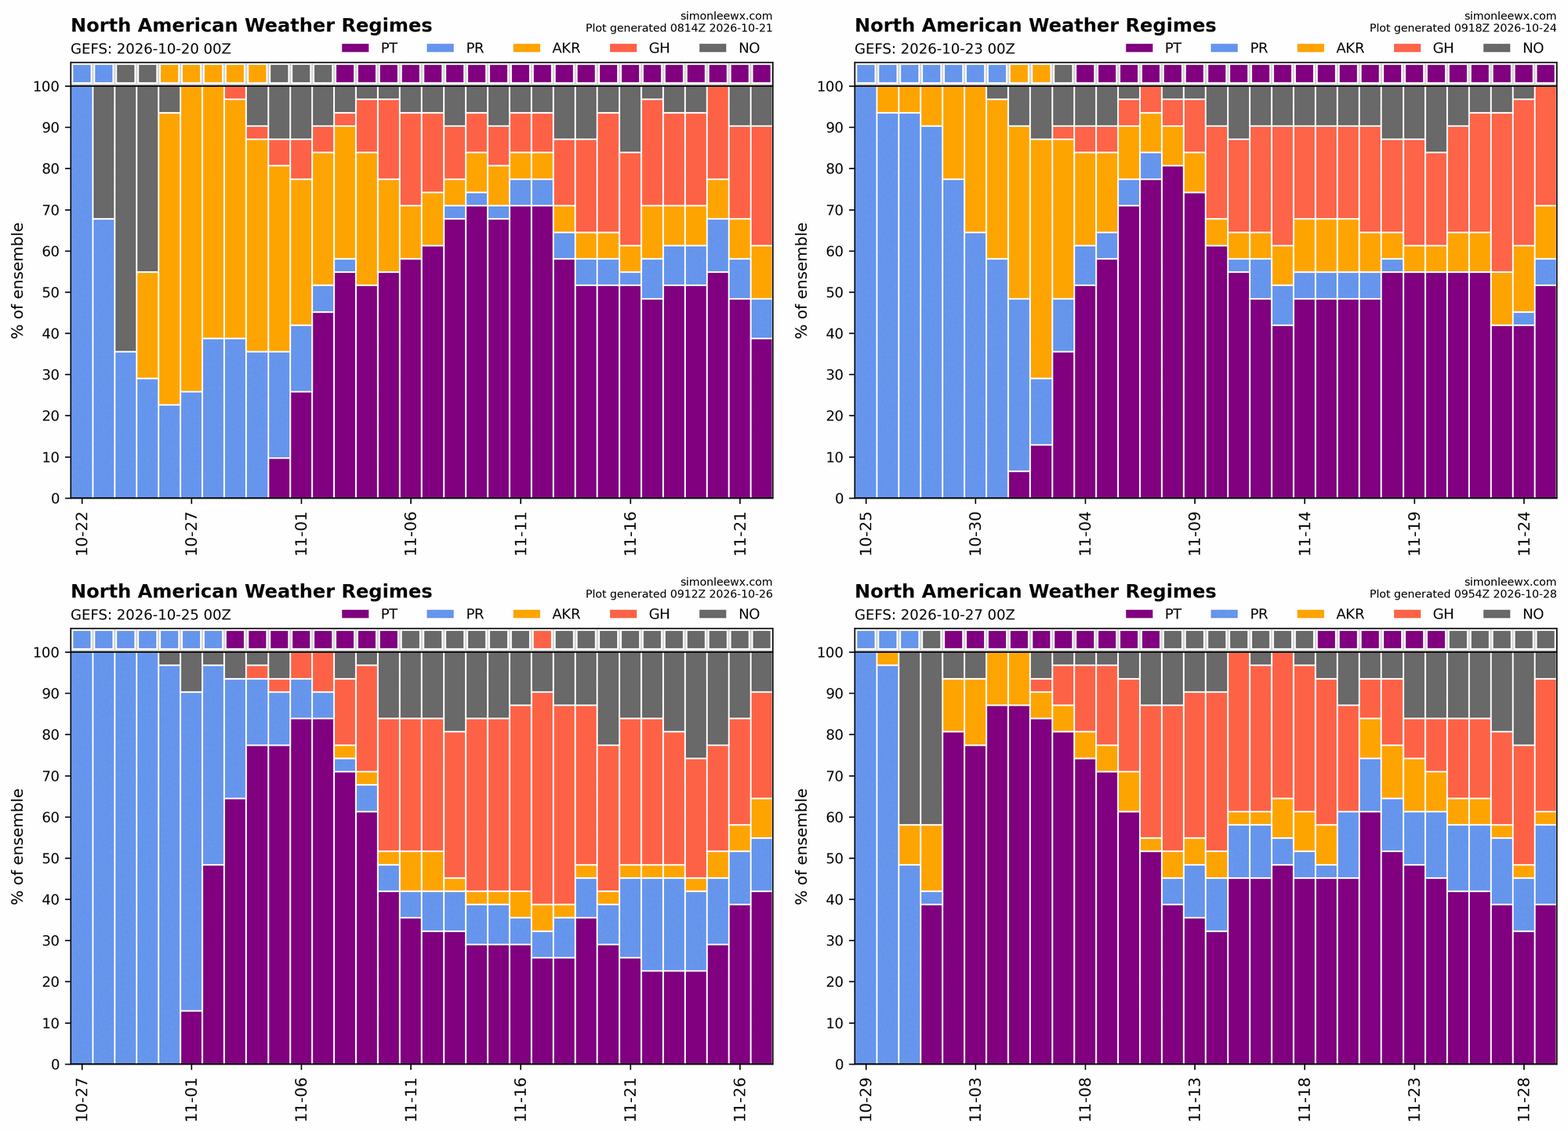
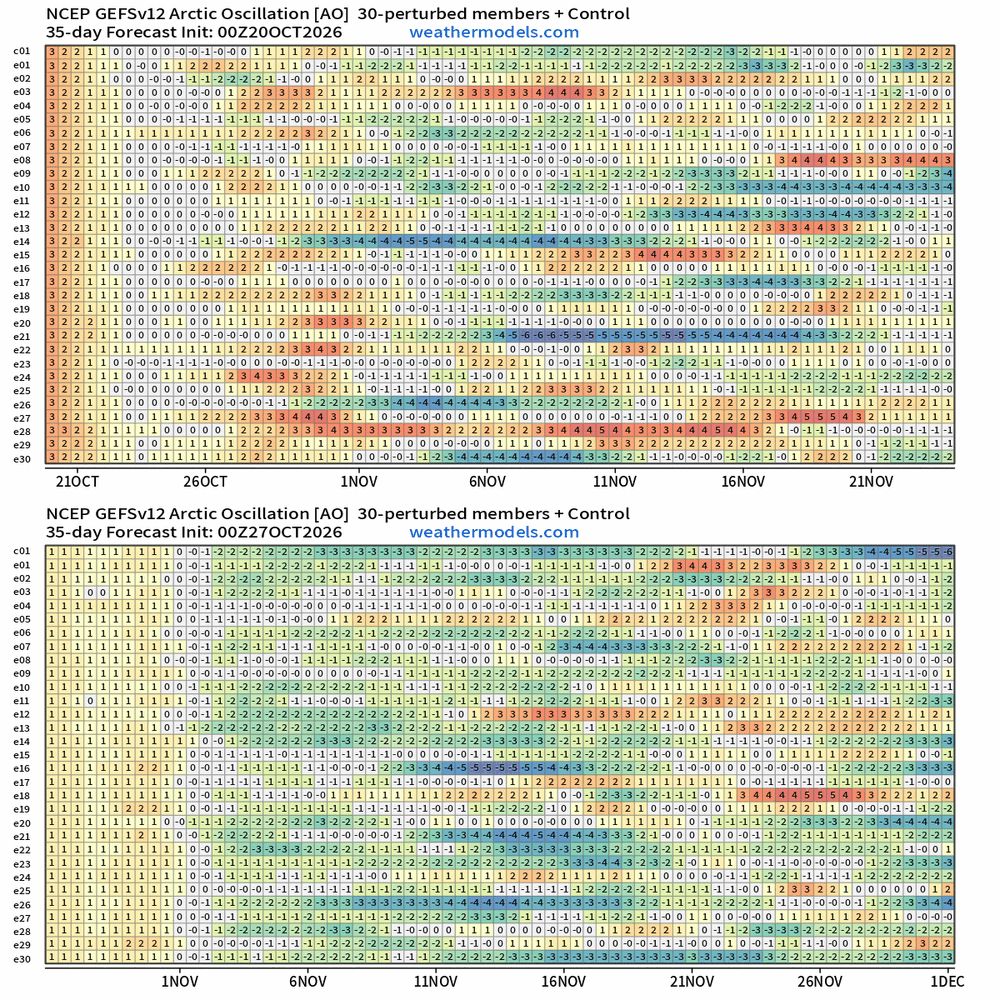
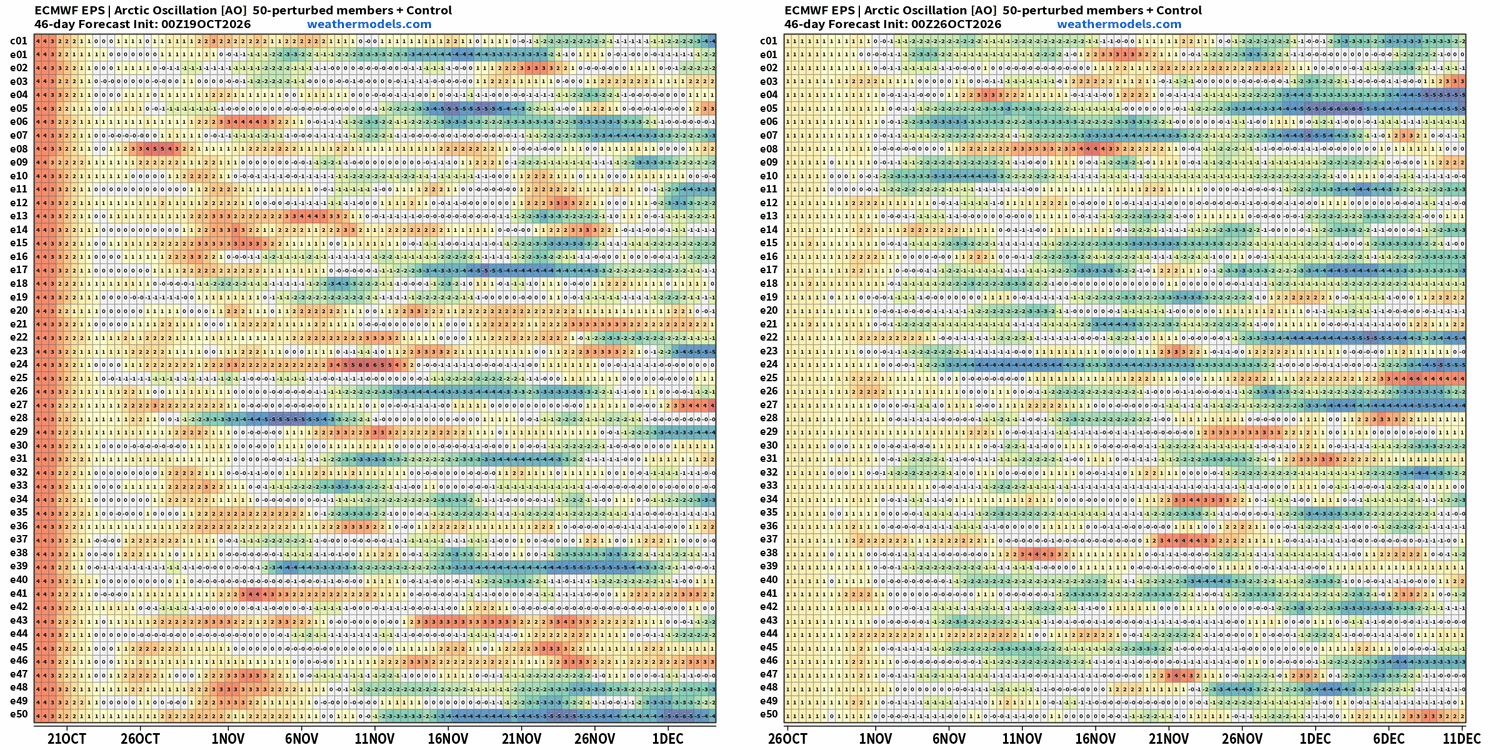
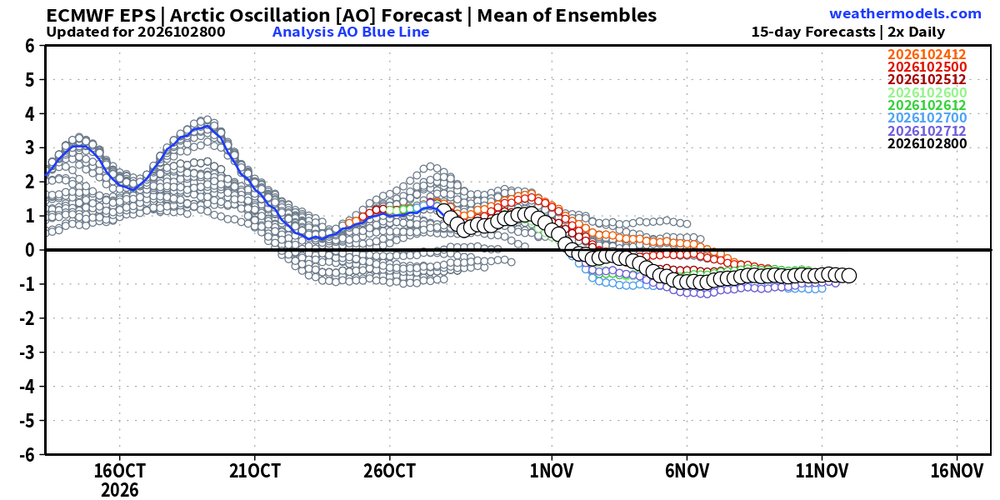
Very nice find, Larry! While the seasonal model support for a strong -AO is mostly lacking, the sub-seasonal support is growing. There is increasing support for a -AO in the last two-thirds of Nov. EPS and GEFS long range weather regime charts show an increasing proportion with Greenland High (GH) or Alaskan ridge (AR) vs. prior forecasts. This is also reflected in individual member AO forecast charts from the long range EPS and GEFS. Taking El Ninos of any strength, the four with a Nov AO below -1.0 saw that -AO persist overall through the winter and most of these were memorable winters with at least one KU event: 1957-58: -0.9 1965-66: -1.5 1968-69: -2.3 2002-03: -0.6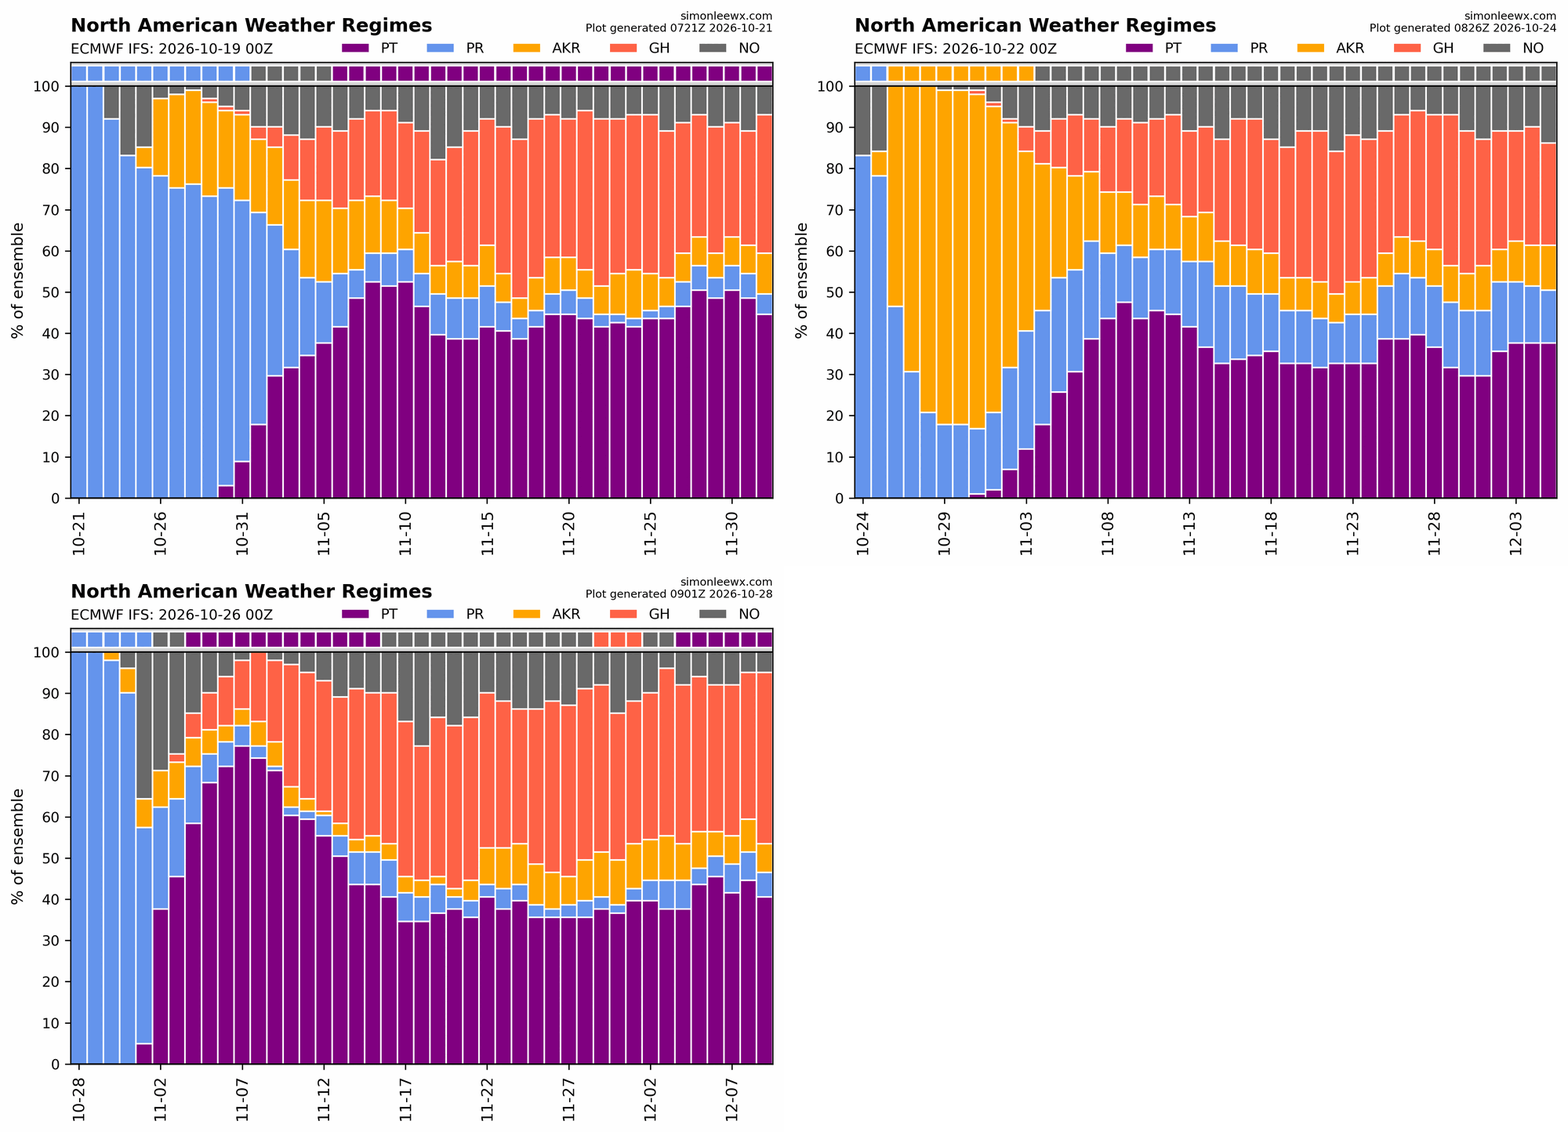
-
 canadian pharmacy official website and canadian pharmacies online canadian pharmacies online http://www.harikyu.in/mt4i/index.cgi?id=2&mode=redirect&no=12&ref_eid=8&url=http://canpointerx.com canada online pharmacyor http://bbs.51pinzhi.cn/home.php?mod=space&uid=8500073 canadian pharmacy price checker [url=https://maps.google.gp/url?q=https://canpointerx.com]canadian drugstore online[/url] canadian pharmacy official websiteand [url=http://www.sportchap.ru/user/tkjcfdayjz/]canadian pharmacy drugs online[/url] canadian online pharmacy
-
Rush was fantastic last night! Anika definitely deserves all her flowers for her drum work and keeping Neil Peart's spirit (of radio) alive.
-
2026-2027 Record-breaking El Nino
BlizzardWx replied to Stormchaserchuck1's topic in Weather Forecasting and Discussion
What a difference a year makes.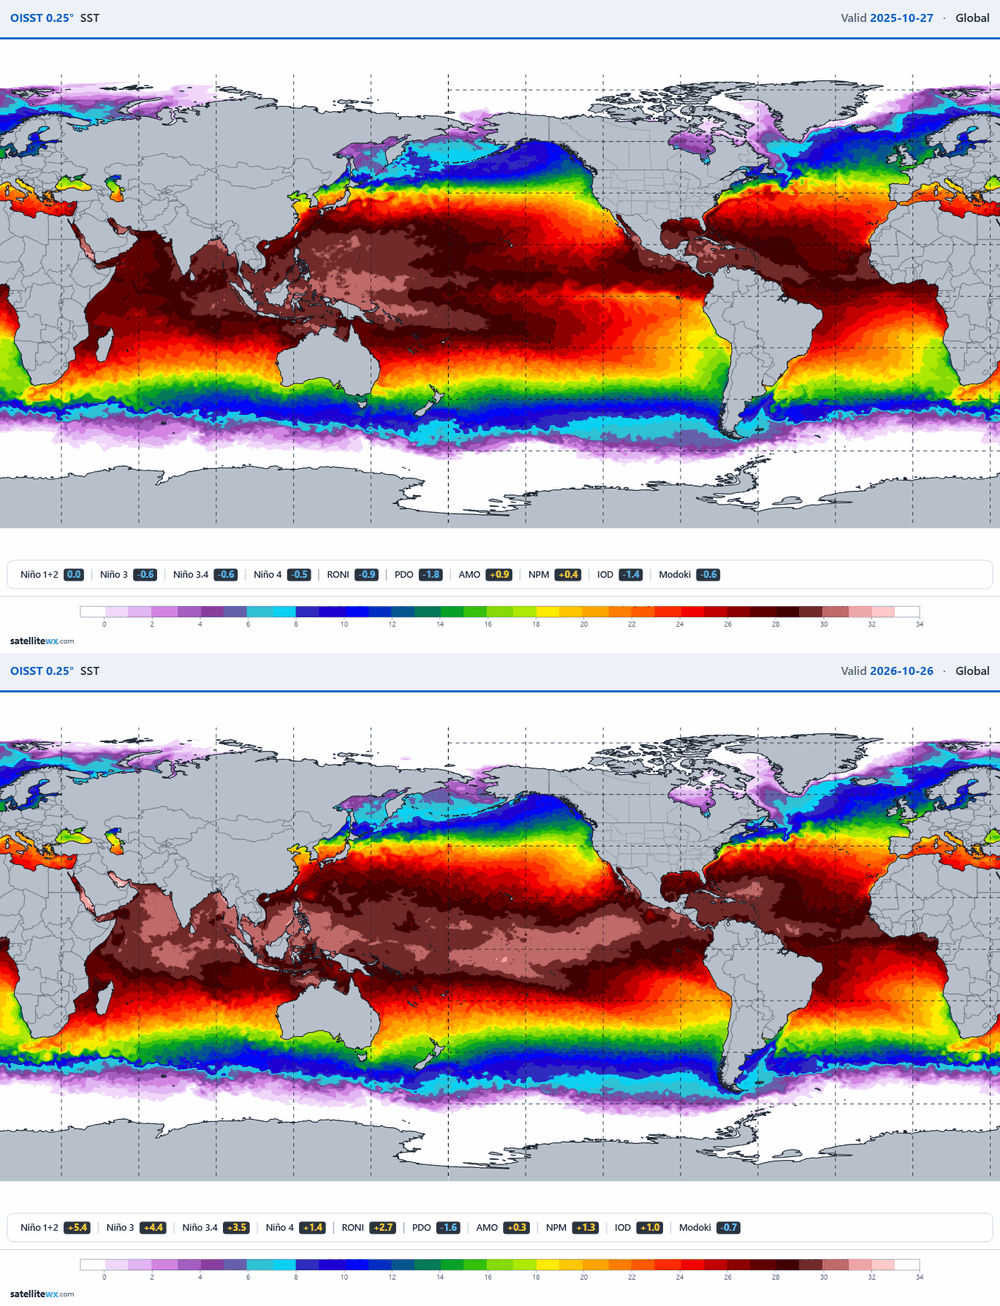
-
I would happily write off December 2026 if I knew it would transition into a solid January and February. Snow with no sun angle concerns is the best snow. March snow is fine, but it's like the last drink at a bar while everyone's cleaning up around you and the bar tender is staring you down.
-
2026-2027 Record-breaking El Nino
GaWx replied to Stormchaserchuck1's topic in Weather Forecasting and Discussion
More from Webb about the SSW: The wave pattern that forces stratospheric warming events varies from case to case. Displacement events (wave 1) require an Aleutian low and a Scandinavian-Kara Sea block, but splits of the polar vortex (wave 2) do not necessarily. This particular stratospheric warming event actually starts out as a split type (wave 2), and then morphs into a wave 1/displacement type event as the Aleutian low becomes established later. The tropospheric trigger for this event is clearly traceable to the Eastern Pacific w/ divergent wind anomalies from active convection propagating poleward into N America and then eastward into the North Atlantic jet stream, eventually forcing the Kara Sea/Scandinavian block that sets this entire stratospheric warming event into motion. Also, note that early in the model forecasts, wave 2 amplitude dominates the -NAM/AO changes, wave 1 comes later and is largely confined to the mid-upper stratosphere initially at least.