All Activity
- Past hour
-

July 2025 Discussion-OBS - seasonable summer variability
SACRUS replied to wdrag's topic in New York City Metro
Records: Highs: EWR: 103 (2010) NYC: 103 (2010) LGA: 103 (2010) JFK: 101 (2010) New Brnswck: 103 (1999) Lows: EWR: 54 (1979) NYC: 53 (1979) LGA: 56 (1979) JFK: 56 (1979) New Brnswck: 48 (1979) Historical: 1879: Boston, MA recorded its lowest temperature of 50 °F for the month of July. (Ref. NOAA Boston Weather Events) 1893 - A violent tornado killed 71 persons on its forty-mile track across northwestern Iowa. Forty-nine persons were killed around Pomeroy, where eighty percent of the buildings were destroyed, with most leveled to the ground. Photos showed most of the town without a wall or tree left standing. (The Weather Channel) 1928: A seven-inch hailstone weighing 1.5 pounds fell in Potter Nebraska. With a circumference of 17 inches, this appeared to be the largest hailstone in the world at that time. 1928 - A hailstorm at Potter, NE, produced a stone which was 5.5 inches in diameter, and seventeen inches in circumference, weighing a pound and a half. (David Ludlum) 1936: The temperature at Moorhead, MN, soared to 114 °F to establish a new state record and the temperature at Steel, ND, soared to 121 °F to establish a new state record (Ref. Lowest and Highest Temperatures for the 50 States) 1972: Unusually strong Canadian high pressure pushed a cold front into the central Gulf of Mexico bringing record chill to the central states. Richland Center, WI and St. Louis, MO set July record lows of 38° and 51° respectively. Other daily records: Lansing, MI: 39°, Detroit, MI: 42°, Columbus, OH: 43°, Toledo, OH: 43°, Dayton, OH: 44°, Springfield, MO: 44°, Peoria, IL: 48°, Springfield, IL: 48°,Lexington, KY: 49 °F. (Ref. Additional Temperatures Listed On This Link) 1977: RIC The Highest temperature ever recorded for July was 105 °F which has occurred on two other dates. (Ref. Richmond Weather Records - KRIC) 1978: Severe thunderstorms developed over eastern South Dakota during the afternoon and moved quickly to the northeast. Winds of up to 80 mph were reported and hail as big as baseballs pounded some areas. A tornado produced widespread damage to crops and personal property across Turner and Lincoln counties. Total property and crop damage from the storms was near $20 million dollars.(Ref. Wilson Wx. History) 1982: A severe thunderstorm which produced extremely high winds pummeled Sioux Falls, SD. The thunderstorm produced winds of 125 mph which swept across the city causing damage in a path ten blocks wide and three miles long. The National Weather Service office at the airport reported a gust of 82 mph. (Ref. Wilson Wx. History) 1983: Cool high pressure settled over the Great Lakes bringing record lows. The 41° at Grand Rapids, MI is the lowest ever recorded during the month of July. Chicago, IL set a daily record low with 46° and the low of 45° the next morning set the record low for July. Other daily record lows included: Ste. St. Marie, MI: 36°, Muskegon, MI: 41° and La Crosse, WI: 48°. (Ref. Wilson Wx. History) 1985 - Lightning struck a large transformer in Salt Lake County sending a 200 foot fireball into the air and blacking out almost the entire state for up to five hours. (The Weather Channel) 1986 - Thunderstorm rains during the mid morning hours, and again during the evening, produced major flash-flooding at Leavenworth, KS. The official rainfall total was 10.37 inches, but unofficial totals exceeded twelve inches. At nearby Kansas City, the rainfall total of 5.08 inches was a daily record for July. (Storm Data) 1987 - Thunderstorms produced severe weather in twenty-one states east of the Rockies, with severe weather reported in Kentucky and Indiana for the second day in a row. A thunderstorm produced more than five inches of rain in one hour near Reynolds, IL. Rochester, NY, was soaked with 3.25 inches, a record 24 hour total for the month of July. (The National Weather Summary) (Storm Data) 1988 - Thirty-six cities in the north central and northeastern U.S. reported record high temperatures for the date. Afternoon highs of 98 degrees at International Falls, MN, and 101 degrees at Flint, MI, equalled all-time records. Highs of 96 degrees at Muskegon, MI, and 97 degrees at Buffalo, NY, were records for July. (The National Weather Summary) 1989 - Unseasonably hot weather prevailed in the southwestern U.S. Ten cities reported record high temperatures for the date, including Las Vegas, NV, with a reading of 115 degrees. Hanksville, UT, reached 112 degrees, Bullhead City, AZ, hit 120 degrees, and Death Valley, CA, soared to 126 degrees. (The National Weather Summary) 1996: The hottest July temperature ever recorded in Oklahoma City, OK is 110°. (Ref. Wilson Wx. History) 1999 : Record heat occurred across the Mid-Atlantic and Northeast. Record highs for the date included: Washington, DC: 103°, Raleigh-Durham, NC: 102°, Newark, NJ: 102°, Harrisburg, PA: 102°, Baltimore, MD: 101°, NYC-Central Park, NY: 101°, NYC-LaGuardia, NY: 101°, Salisbury, MD: 100°, Roanoke, VA: 100°, Allentown, PA: 100°, Reading, PA: 100°, Trenton, NJ: 100°, Atlantic City, NJ: 99°, NYC-Kennedy, NY: 99°, Hartford, CT: 99°, Lynchburg, VA: 98°, Philadelphia, PA: 98 °F. (Ref. Additional Temperatures Listed On This Link) 2006: From June 22nd to July 6th a total of 15.52 inches of rain occurred averaging more than one inch a day over one-half of a summer month period, amazing! (Ref. Annandale Weather Records) 2007: Death Valley, California: Death Valley reaches 129°F the fourth time it has been so hot at this site since 1913. (Ref. WxDoctor) 2009: In Twisp, WA, a couple took shelter in a car due to a thunderstorm. Lightning struck the car and blew out 2 of its tires. After the incident, the engine would not start. The couple was unhurt. (Weather Guide Calendar with Phenomenal Weather Events 2011 Accord Pub. 2010, USA) 2010: On the 6th, BWI soared to 105 °F; 2nd hottest day ever in Baltimore (107 °F, 7/10/36); at or above 100 °F at BWI on 5 days, most on record. BWI recorded record high temperatures on 4 days: 6th (105 °F), 7th (101 °F), 24th (101 °F) and 25th (100 °F). DCA soared to a record 102 °F on the 7th and 101 °F on the 24th. Ref. July PRESTO Page 1 -
Might touch 90 again today. 89 yesterday, and supposed to be warmer today.
-
July 2025 Discussion-OBS - seasonable summer variability
SACRUS replied to wdrag's topic in New York City Metro
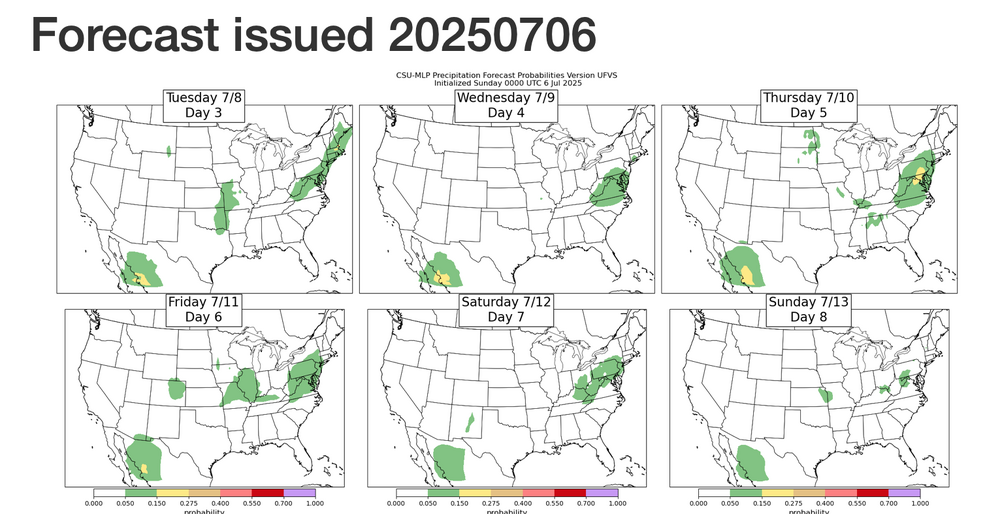
75 / 65 sunny and hot low - mid 90s in the hot areas today. Messy period overall warm - hot / humid and wetter starting tomorrow. Under the northern ridge, western ridge pushing out spurts of heat and the W atl ridge expanding west enough to pump heights the next 7 - 9 days. Clouds from Chantal may get here as early as Mon morning, otherwise more 80s - low 90s Monday. Rain / storm chance look to focus on Mon PM, / Tue AM , Thu- Sat. Clouds the caveat in pushing 90s, onshore along the coast keeps heat focused west. Hotter by mid month with ridge building height and heat expanding east. 7/7 - 7/15 : Warm - hot , humid, wetter / onshore at times heat focused inland, clouds /storms frequent 7/16 - beyond : Hotter -
While there hasn’t been any temps of 95 or higher, every day since June 21 has been above normal, with only 2 days below normal since June 4. That trend looks to continue for at least the next couple of weeks.
-
In all honesty taking any model seriously in July for Dec-Jan-Feb-Mar whether it shows whatever outcome (cold, warm…) you want or not is crazy. I don’t think anyone here is doing that though
-
The weather has been spectacular lately. Got some trail riding in at the ‘shed and Schaeffer in the last couple days. Fairly dry, but enough dry mud (and just plain mud) spots to remind you that we’re having a classic DMV summer.
-

July 2025 Discussion-OBS - seasonable summer variability
wdrag replied to wdrag's topic in New York City Metro
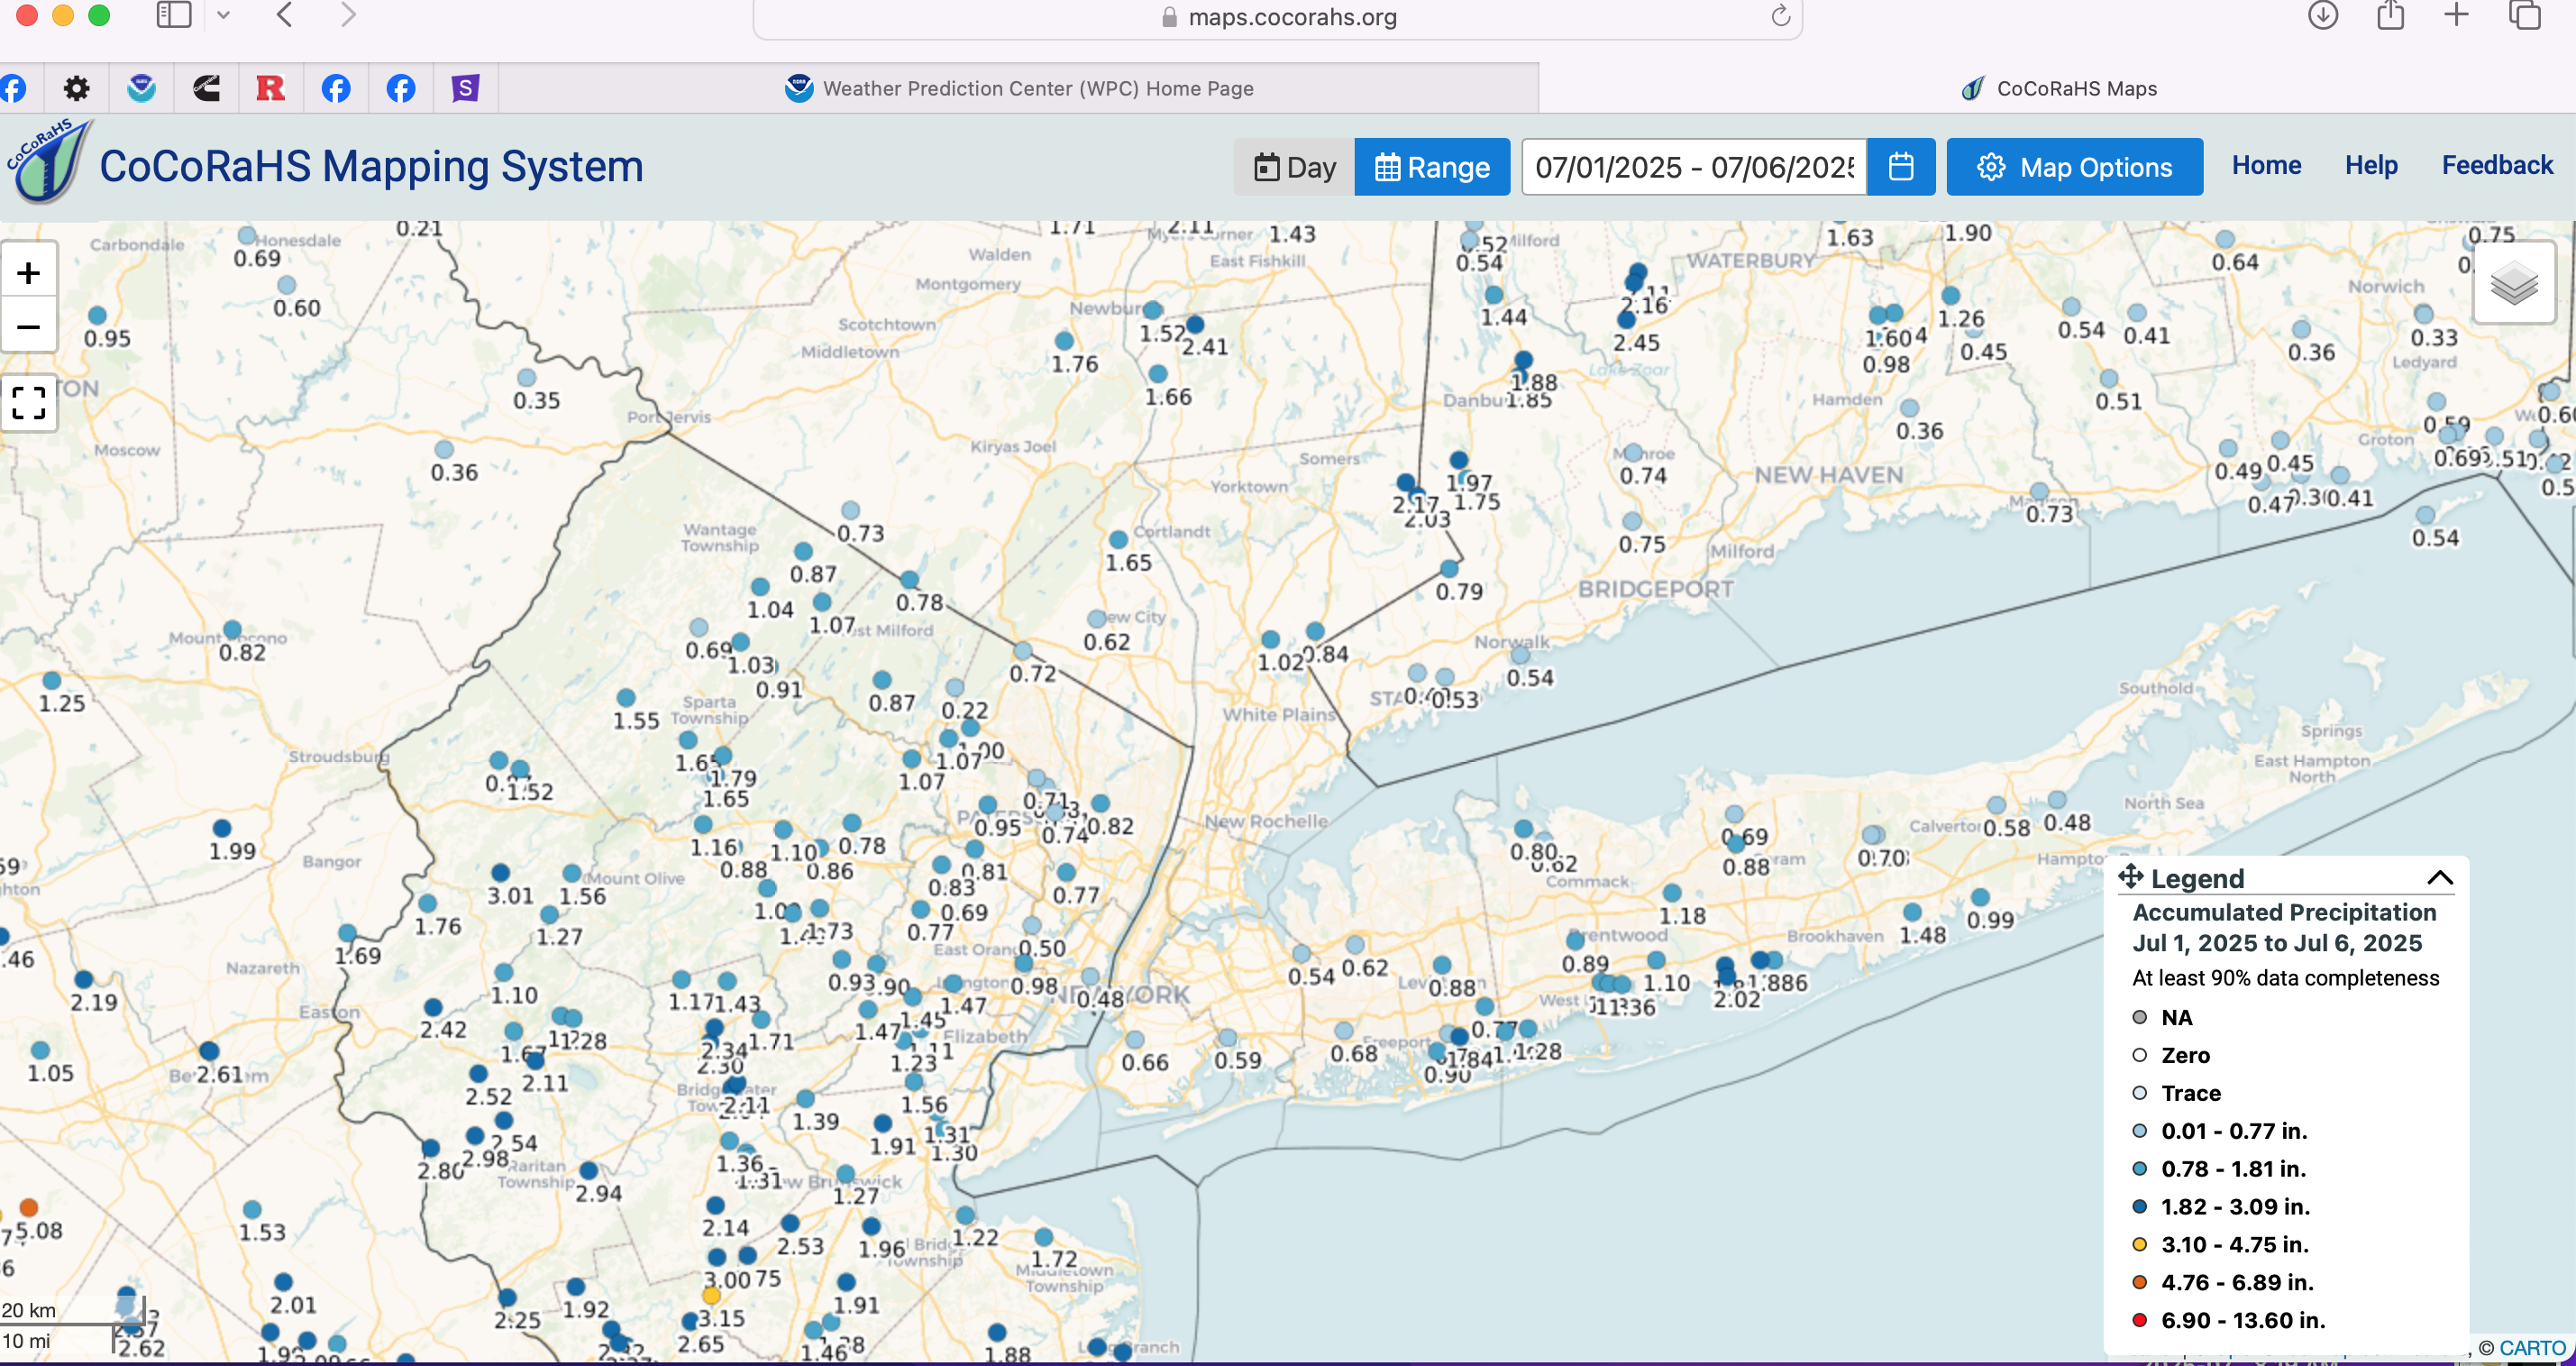
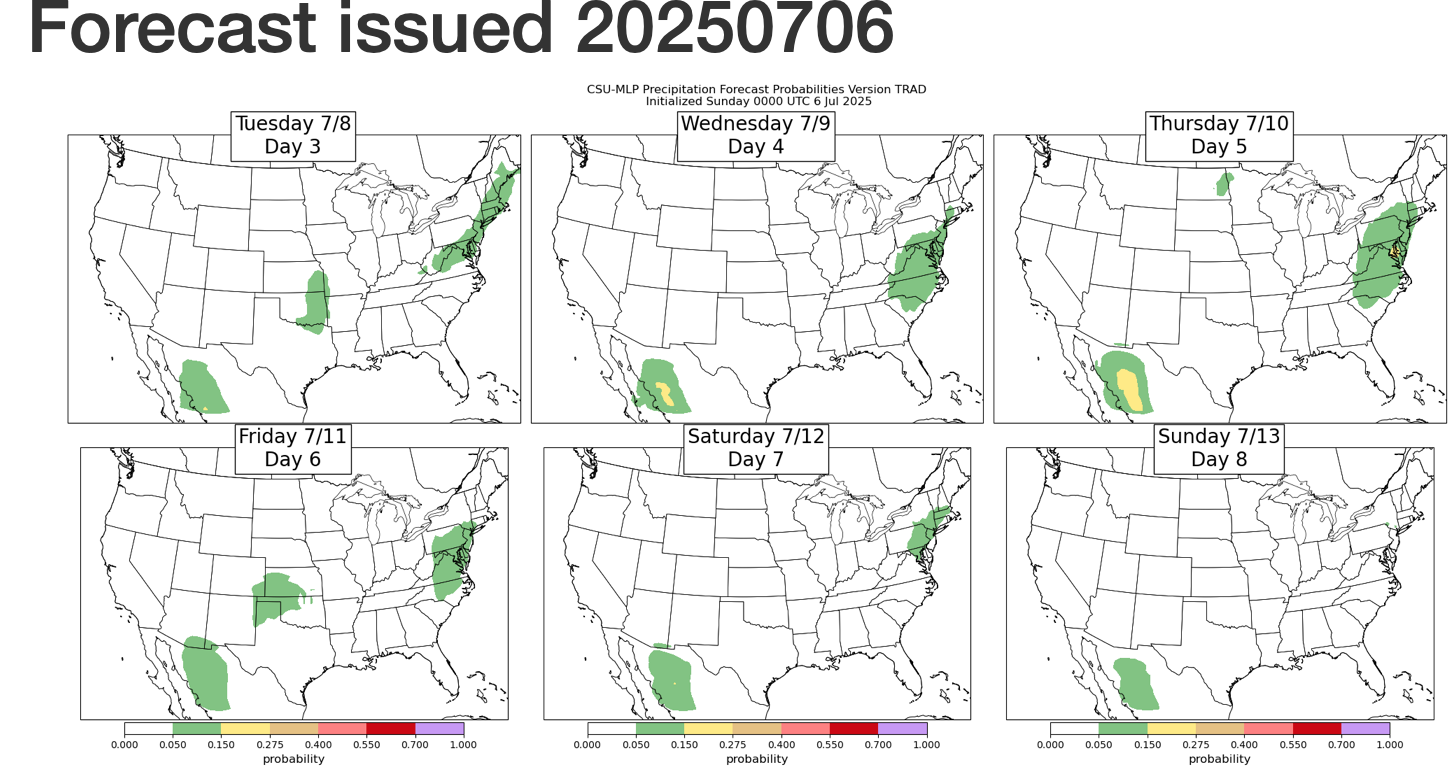
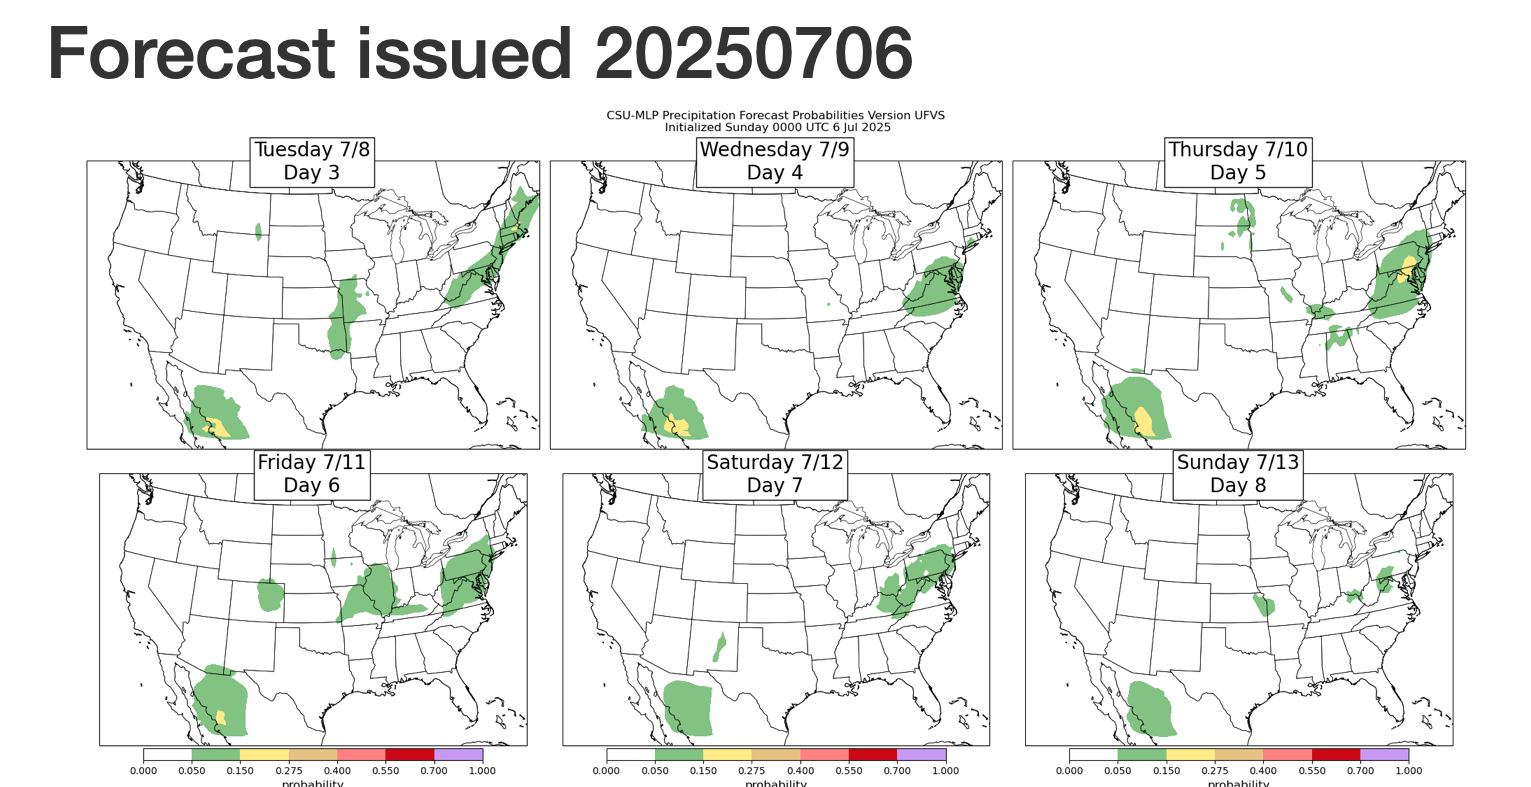
No thread, at least not yet... but the week ahead seems like opportunity for mesoscale excesses. Many models disagree with the EPS (and occasionally the CMC suite) ever increasing heavy rain threat for parts of our NNJ portion of the NYC subforum. For now will go with 3" max Mon afternoon-evening somewhere up here-probably near I95. (Chantel 850 flow-moisture advection combined with RRQ of th UL jet over New England) Looking ahead...the CF heavy convection in parts of the area Tue. Then Thu-Fri, maybe Sat... heavy rain potential with southern stream short wave and warm front returning. Some of the experimental modeling has us in small chance iso FF THU-Sat (spot 5"+ this 3 day period). Added July CoCoRaHs totals as a baseline. Click for clarity. Next potential 3 day (dry) haying period around 7/16-19? Cleaned up the FF potential graphics at 752AM

-
Sure looks like this week will bring ample opportunity for wetness.
- Today
-
Fortunately, one of the heavy bands set up over Cedar Rapids. Once again there was very little thunder, but I got a much-needed 2.21" of rain.
-

July 2025 Discussion-OBS - seasonable summer variability
steve392 replied to wdrag's topic in New York City Metro
69 degree's this morning! -
Beautiful morning.
-
But we can always pick out model errors with every model, short, medium, and/or long range. Cansips had a "relatively" decent forecast last winter and now the ever warm Cfs2 and arguably the latest Euro seasonal are looking similar to its forecast for this winter. They could all be right or wrong, but to pick out any one forecast from any one of them and say "it was wrong here, so I don't trust it" is tantamount to saying all modeling is useless. If that's the way you feel, that's fine because sometimes they are, but to cherry pick one forecast doesn't support your case one iota it's going to be wrong.
-
Ok JB lol [emoji23]
-
JB is just showing his lack of understanding of how the earth's climate works. Making a very simplistic argument that ignores the structure of the ocean. He needs to show that changes heat released at the bottom of the ocean made it all the way to the surface. The data is available from argo floats which get subsurface temperatures down to 2000m around the oceans. If seismic was driving our climate or having any significant impact at all we would know about it. I posted info previously which showed that the sun warms the ocean from the top down. Surface waters are less dense because they are warmer. In contrast the the waters at the bottom of the ocean where the vents are located are very cold and dense. That makes the ocean very stable. Ocean flow at the bottom of the ocean is horizontal in most locations. There is no way for changes in seismic activity to impact surface temperatures directly above the Atlantic vents. The only mixing between bottom and surface waters occurs in the arctic and antarctic where surface waters are cold enough to sink to the very bottom of the ocean. That's where the effect of any change in seismic heating would be felt at the surface. There is a much simpler explanation for the changes in the past year: changes in surface wind speed. Since warming is top down, The waters just below the surface are always cooler. Higher winds cool the surface waters by promoting mixing. Light winds allow surface waters to warm. Wind driven mixing usually extends to roughly 100m. I showed a chart upthread which showed that surface winds in the area that cooled are higher this year vs last.
-

July 2025 Obs/Disco ... possible historic month for heat
ineedsnow replied to Typhoon Tip's topic in New England
Thinking upper 80s the next couple days here.. should feel summery.. -

July 2025 Discussion-OBS - seasonable summer variability
bluewave replied to wdrag's topic in New York City Metro
Just look at all the new mesonet sites that have multiple elevation temperature observations. Temperatures most times decline with elevation from 2m to 10m and 30m to over 100m at some sites. The exceptions are during radiational cooling inversions and strong winter WAA when the higher levels warm more than the surface and we get fog. -

July 2025 Obs/Disco ... possible historic month for heat
dendrite replied to Typhoon Tip's topic in New England
Min 59.4° It’ll be a drastic turnaround today. 00z MAV for today and tomorrow
-

July 2025 Obs/Disco ... possible historic month for heat
kdxken replied to Typhoon Tip's topic in New England
Spending warm summer days indoors...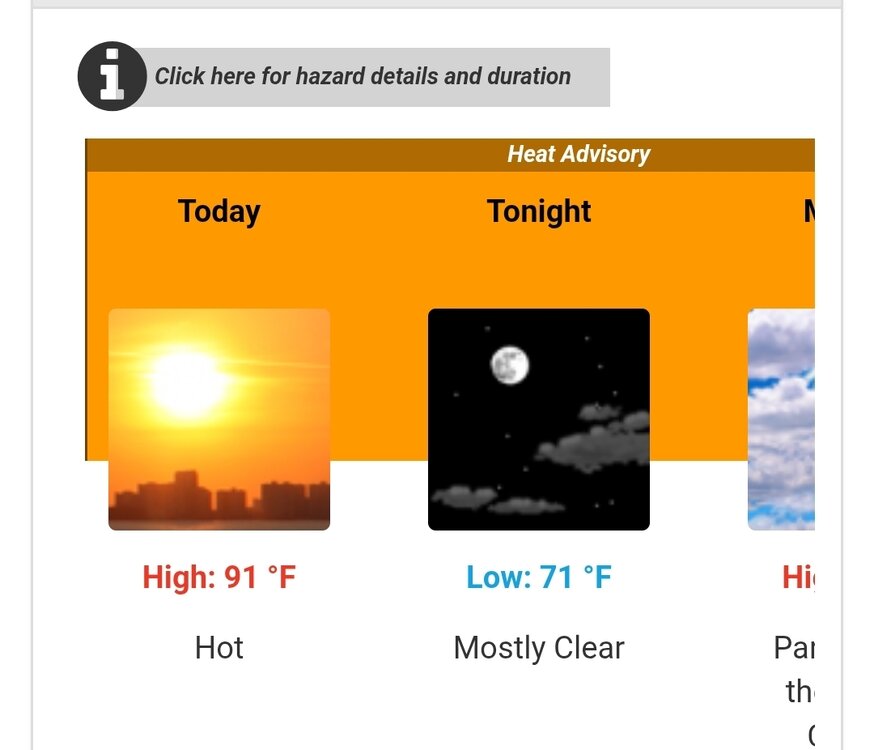
-

July 2025 Discussion-OBS - seasonable summer variability
LongBeachSurfFreak replied to wdrag's topic in New York City Metro
Allot of would depend on just how high of a rooftop. I would love to see obs from the top of the Nordstrom tower at 1550’. (Highest flat roof in nyc) Probably averages double the snowfall of the park. Not only a few degrees cooler due to height but also high enough to be out of the heat island near the ground. -
July 2025 Discussion-OBS - seasonable summer variability
bluewave replied to wdrag's topic in New York City Metro
Higher dew points and more clouds with onshore flow mean more rain chances. So your area usually sees at least 30-40 days reaching 90° each season. But the chances of going 20 straight days reaching 90° like in 1988 when it was much drier without interruption are very low. But the overall 90° day counts in NJ are much higher than the 1980s and 1990s. Just no really long extended heatwaves. So a bunch of shorter heatwaves giving you more total 90° days than you used to get. -
68 degrees with a high of 91 degrees today. Prayers for everyone in Texas.
-
No problem. We need some levity in here after what has happened since 2018-2019. My only comment on the CanSIPS is that temperatures never match the forecasted 500 mb pattern. Just look at the one month forecast for June to see what I am talking about. The 500mb forecast for June wasn’t bad. But the cold pool to the south was way overdone. So this has also been happening with the La Niña winters showing so much cold to the north around the Great Lakes, Northeast, and Canada. If that Southeast Ridge verifies like it’s showing for the winter, there will be much less cold to the north and the warmth to the south will be much more expansive. 500 mb pattern forecast not bad Cold pool to the south never verified


-
In Morehead city we just had a nasty squall move through with likely some 40 mph gusts. Wind is generally 20-25. Looks like ocean isle to Myrtle beach got a decent little blow from this storm overnight
-
A couple things. 1. This specific area has desperately needed rain as they've been dealing with a multi-year severe drought since at least 2022. It's just unfortunate that it came in the form of a historic flash food event. 2. There have been 56 confirmed deaths so far, and there's still 27 people missing. This is in part because the worst of the flooding occurred in the middle of the night.
-
BULLETIN Tropical Storm Chantal Intermediate Advisory Number 6A NWS National Hurricane Center Miami FL AL032025 200 AM EDT Sun Jul 06 2025 ...CHANTAL A LITTLE STRONGER AND CLOSE TO LANDFALL ALONG THE SOUTH CAROLINA COAST... ...FLASH FLOODING CONCERNS INCREASE AS RAINBANDS MOVES ONSHORE... SUMMARY OF 200 AM EDT...0600 UTC...INFORMATION ---------------------------------------------- LOCATION...33.2N 78.8W ABOUT 75 MI...115 KM ENE OF CHARLESTON SOUTH CAROLINA ABOUT 85 MI...140 KM SW OF WILMINGTON NORTH CAROLINA MAXIMUM SUSTAINED WINDS...60 MPH...95 KM/H PRESENT MOVEMENT...N OR 350 DEGREES AT 8 MPH...13 KM/H MINIMUM CENTRAL PRESSURE...1002 MB...29.59 INCHES Recent aircraft and land-based radar velocity data indicate that maximum sustained winds have increased to near 60 mph (95 km/h) with higher gusts. Little change in strength is expected before landfall, with rapid weakening forecast after landfall. Tropical-storm-force winds extend outward up to 140 miles (220 km) from the center. Within the past hour, Springmaid Pier in South Carolina reported a sustained wind of 47 mph (76 km/h) gusting to 56 mph (90 km/h). The estimated minimum central pressure based on Air Force dropsonde data is 1002 mb (29.59 inches).