All Activity
- Past hour
-
 Waiting for the Euro to cave
 -

The return of the elusive Nor'easter. Drought buster or bust?
wxdude64 replied to dailylurker's topic in Mid Atlantic
Never give up, never surrender! -

The return of the elusive Nor'easter. Drought buster or bust?
JenkinsJinkies replied to dailylurker's topic in Mid Atlantic
It's too late for a comeback. -
FINALLY broke out of the fog/haze about an hour ago. Temp up to 58.0/48.1 and up 10 degrees in past hour at 1:15 pm.
-

The return of the elusive Nor'easter. Drought buster or bust?
peribonca replied to dailylurker's topic in Mid Atlantic
Watch it trend back to a nice hit in the next few runs -
This current -IOD is the strongest in 17+ years
-
The return of the elusive Nor'easter. Drought buster or bust?
JenkinsJinkies replied to dailylurker's topic in Mid Atlantic
When is it going to be our turn? -

E PA/NJ/DE Autumn 2025 Obs/Discussion
Hurricane Agnes replied to PhiEaglesfan712's topic in Philadelphia Region
Bottomed out at 48 this morning at midnight before clouds must have rolled in to kill any radiational cooling. Ended up hitting 64 for a high just before noon and what are some intermittent bands of light rain that have passed overhead backing in from the SE. It's currently 61 with a little band that gave me 0.03" so far, and dp 59. Also saw that it appears La Nina is here through the rest of fall and into early winter - https://www.cpc.ncep.noaa.gov/products/analysis_monitoring/enso_advisory/ensodisc.shtml I think we sort of know the drill on that! -
 Highest low tide all week this morning. It's coming
 -
Some of what I’ve learned about IOD index history: - Tends to be strongest + during strong El Niño with peak a little earlier - Vast majority of months -IOD 1870-1960 with gradual decrease of -IOD domination since then, especially last 20 years - 1870-1913: 3 of the only 4 years with consecutive +IOD months were during strong El Niños of 1877, 1896, and 1902. The other (1884) was when it was borderline warm neutral/wk Nino preceding wk Nino. - Highest IOD month 1870-1960 was only +0.558 (1877)! - But since 1960, there have been ~34 months >+0.558! - Longest +IOD string of months 1870-1960 was only 5 months (Nino years 1877 and 1920) - 1961-present there were ~21 of the 5+ month +IOD streaks - 1961-2022: longest +IOD streak 23 mos 2018-20 followed by 21 mos 2023-4! - Record high IOD: +1.279 (Nov of 1997) - Thus for whatever reason, the IOD has been rising over the last 100+ years and especially the last 20 years. Is GW leading the W Indian Ocean to warm more quickly than the E Indian Ocean? If so, why? I’m using the table at the link below for IOD back to 1870: https://psl.noaa.gov/gcos_wgsp/Timeseries/Data/dmi.had.long.data @snowman19
-
more blocking too far south linking up with the SE ridge, rinse and repeat
-
 Going down the boat later to take down the canvas. A few gusts near 50 and it probably rips off…it’s old and already falling apart
- 273 replies
-
- 1
-

-
- heavy rain
- damaging wind
- (and 2 more)
- Today
-

The return of the elusive Nor'easter. Drought buster or bust?
TSSN+ replied to dailylurker's topic in Mid Atlantic
Rain will evaporate quicker than it can accumulate. -
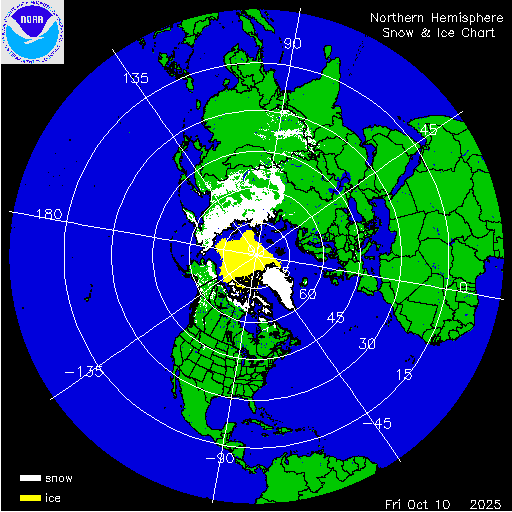
Saw another Met who put out a video about winter, he compared it to 2013-2014 as one his top analogs. That's two different people I've seen make the comparison. He noted current sea ice and snow cover were above the last couple of years and similar to 2013-14 and that the Pacific was similar.
-
Impressive contrast. Siberian snow cover extent nearing record highs for the date, while the Northern Hemisphere is nearing a record low. Both regions are expected deviate from their extreme anomalies in the next week or so.
-
 GFS looking a bit stronger, more organized System does look quite potent on satellite
 -

E PA/NJ/DE Autumn 2025 Obs/Discussion
Birds~69 replied to PhiEaglesfan712's topic in Philadelphia Region
Let's give him a chance, he has to hit once in a while. Cecily's should be coming up within a month. I think FOX has theirs within the same time frame. Did channel cbs3 and channel nbc10 gave up on the winter outlook forecast. Not sure? -
 Still a fairly nice day on the water. A little chop 15-20kt , but otherwise a beautiful fall morning. 20251011_104915.mp4
- 273 replies
-
- 2
-
-
- heavy rain
- damaging wind
- (and 2 more)
-
The Euro isn’t the only model to show multiple lows. I think I saw the NAM 3k and a few others with a similar look with their 6z runs.
-
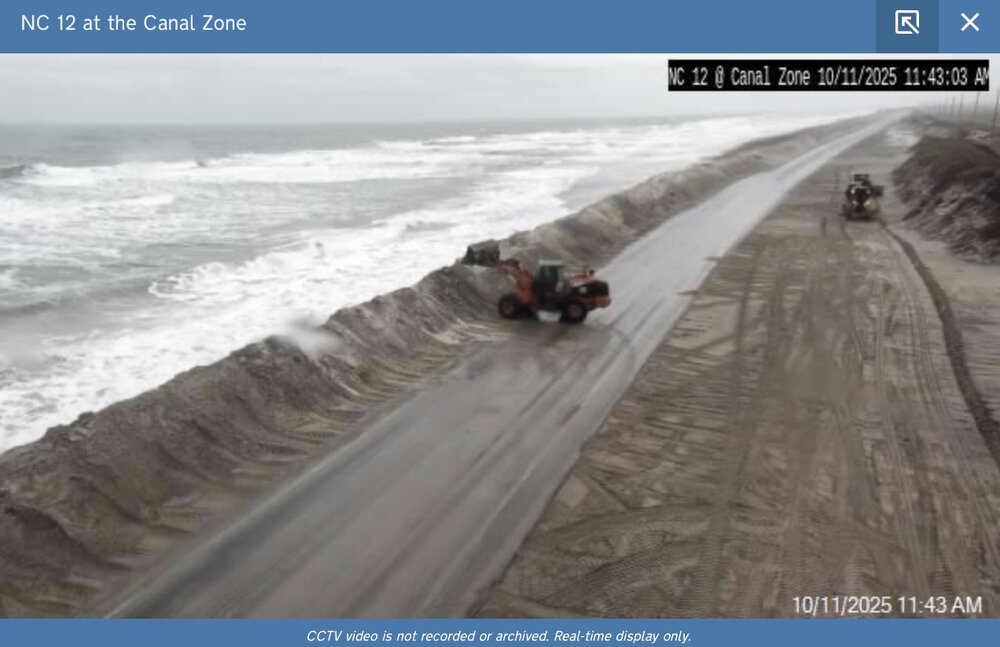
NC 12 as of 11:43. High tide around 2pm for this location.
-
The return of the elusive Nor'easter. Drought buster or bust?
JenkinsJinkies replied to dailylurker's topic in Mid Atlantic
55 and rain instead of 45 and rain -
 models may be worthless right up to go time for this one...just all over the place
 -

E PA/NJ/DE Autumn 2025 Obs/Discussion
PhiEaglesfan712 replied to PhiEaglesfan712's topic in Philadelphia Region
All I know is that when drought guy posts, I expect the exact opposite to happen in my area. Yes, he made this prediction on page 3 of thread on 9/19: 1. Being a neutral year, we are in for a real cold and snowy winter which will definitely help the groundwater tables. See lots of northeaster's and the potential freezing rain/sleet events early in December. (Yep, this winter is cooked. I expect a warm winter with very little snow.) -
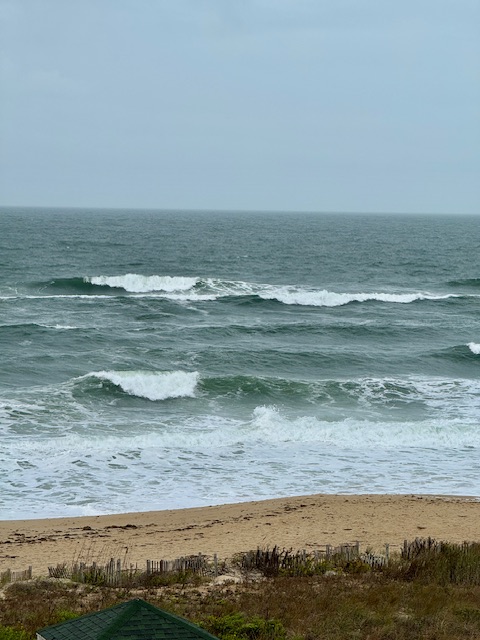
Models show about 40kts moving in tonight on OBX and hotel room is about 50 feet above the dunes facing east. Could be a little fun on the balcony as the low level jet moves through.
-

The return of the elusive Nor'easter. Drought buster or bust?
konksw replied to dailylurker's topic in Mid Atlantic
What effect do with think the sun angle will have?