All Activity
- Past hour
-
Low of 38, high of 62 and the rain has finally started.
-
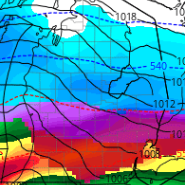
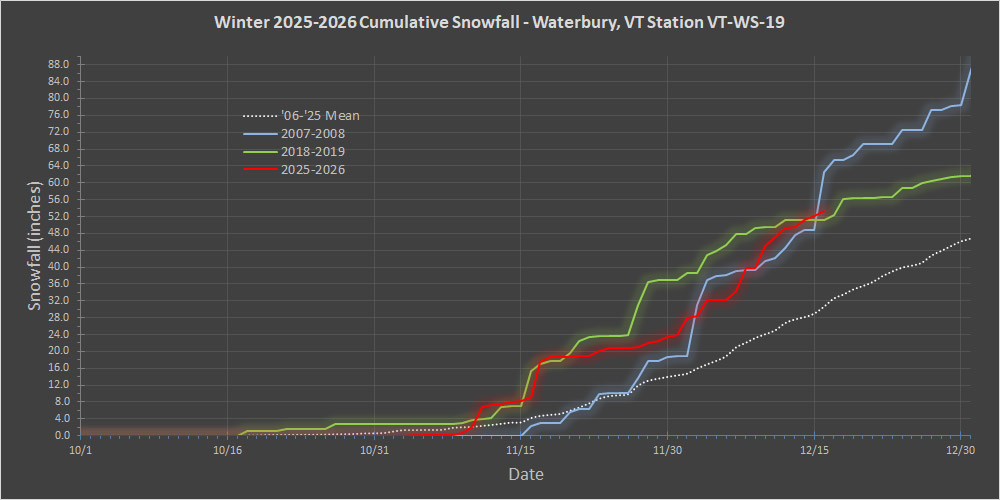
Since the snow depth for our VT-WS-19 CoCoRaHS site is reported each day, SDD for our site is actually something that can be obtained publicly. SDD isn’t something that CoCoRaHS reports directly though, so it would require some offline analysis (unless it’s available in one of the various CoCoRaHS analysis tools – I haven’t explored all the features in those tools exhaustively). You could even explore some of the data for a CoCoRaHS site closer to you if you wanted something that might be more relevant to compare to your location. It looks like southern Franklin County has relatively poor coverage on CoCoRaHS, but the one active site in that area is in Fairfax: VT-FR-21: Fairfax 4.9 WNW. Anyway, I have all my data in a spreadsheet, so it’s really quick for me to calculate SDD. If one is looking for relative snow retention/snow cover, SDD is certainly going to be helpful, but I could also envision the total number of days with snow cover being another important parameter. There could be a season with a solid number of SDD through mid-December, but it all happened to come from one notable storm that fell in the last week of November and hung around for several days, but the rest of November and the first half of December had bare ground. Or, there could be a few inches of snow cover right from the start of November that never melted and the ground was white the entire time. It’s hard to say which one of those is “snowier”, so I made plots for both of those parameters. There are three plots below covering data from the start of the snow season (Oct 1) through Dec 15: the first one plots SDD, the second is total days with snow cover, and the third is the sum of those two (sort of a way to blend those two parameters into a more comprehensive parameter for integrated snow depth & snow cover – the numbers are generally within an order of magnitude of each other, so a straight up sum seemed reasonable). As you can see from the data, this season is solid, but not really a standout that jumps from the pack of other decently performing seasons in either SDD, days with snow cover, or the combined parameter. I’ve never really explored these numbers until you inquired, so it’s interesting to see the season that does jump out here is 2018-2019. It’s actually the top season on all three plots, but boy does it absolutely soar above everything else with respect to SDD. It’s not surprising to see that 2018-2019 is one of the comparative seasons I’ve been tracking in my snowfall progression plots (I added that latest plot at the bottom here for reference). Coincidentally, there is currently a discussion on First Tracks!! Online Ski Magazine about the strong start to the ski season here in Northern Vermont, and in that discussion, Tony Crocker has a post showing that as impressive as this start has been with respect to open terrain – through December 8th, the 2018-2019 season was even better than this one.


-
Just posted this in another thread. Saw it on LinkedIn. Should have looked here first lol. That’s quite a speed increase re AIGFS.
-
Maybe posted already, but discusses the NOAA AI models… https://www.noaa.gov/news-release/noaa-deploys-new-generation-of-ai-driven-global-weather-models
-
Wasn't this the AI model that had us in the purple shade for days leading up to the storm that gave us 15 minutes of mix then a bunch of rain at the beginning of December? Or was that the GFS AI?
-
Stopped drizzling and temp climbed to 41.8/40.3.
-
December 2025 regional war/obs/disco thread
WxWatcher007 replied to Torch Tiger's topic in New England
-
Jan '99 prolly belongs on that list as well.
-

December 2025 regional war/obs/disco thread
weatherwiz replied to Torch Tiger's topic in New England
3km remains impressive looking. Really interested to see how we look in the AM, particularly with satellite -
It’s a competitive sport, though…and I want to be on the winning side.
-
Getting our typical .01" mist event. Missing all the precip, but will get all of the wind.
-
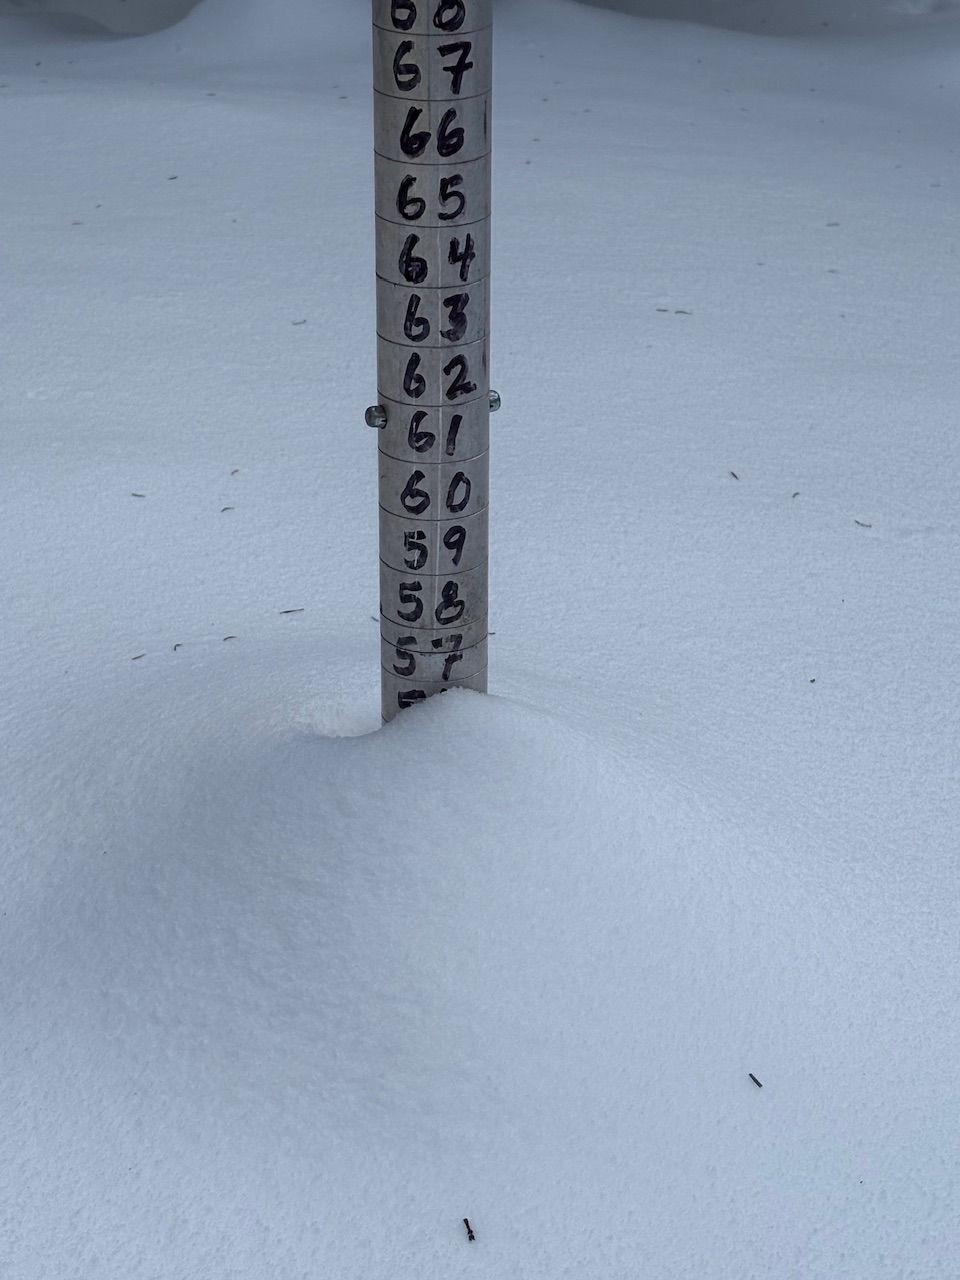
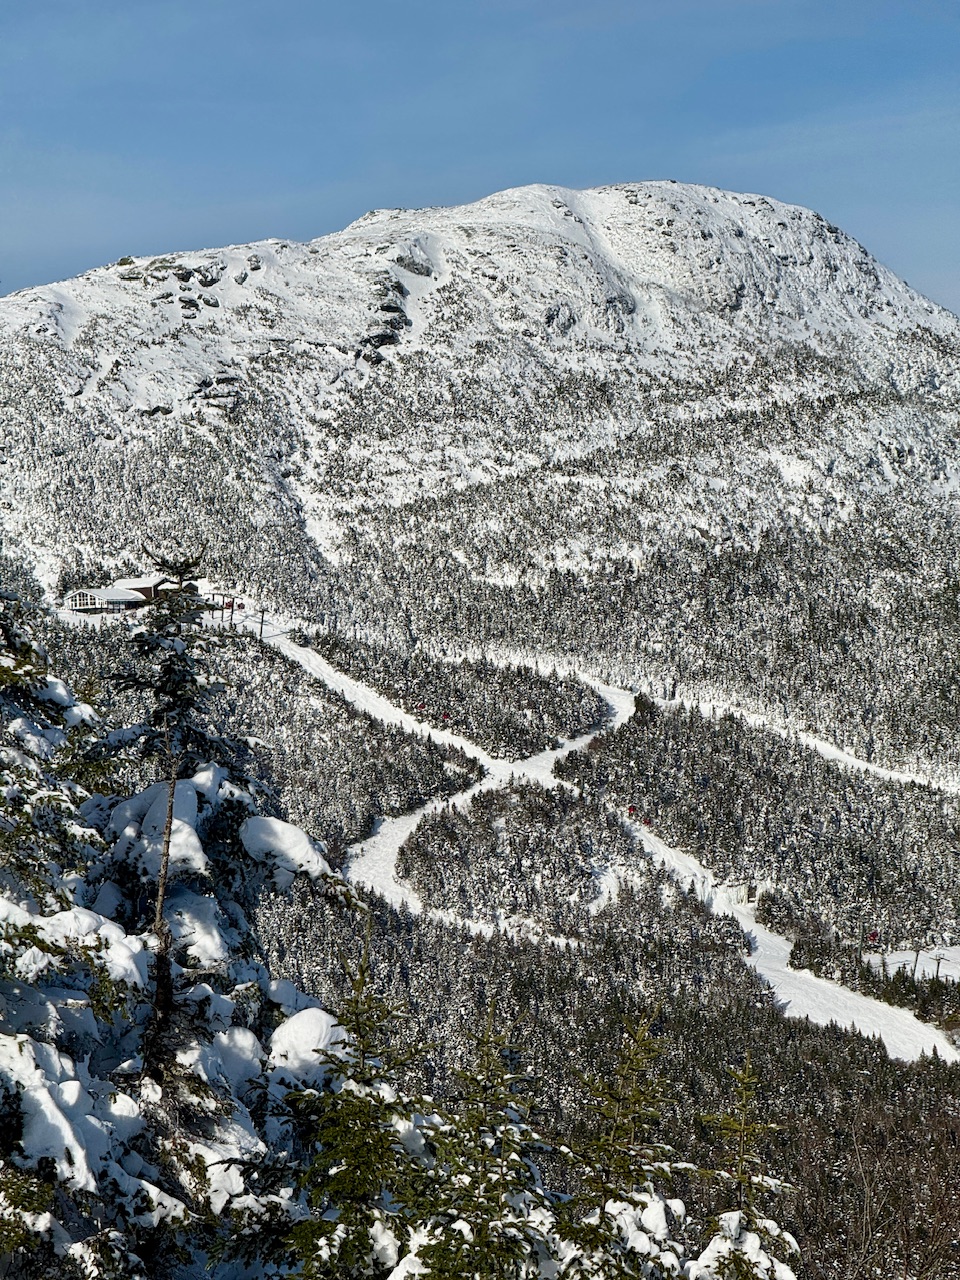
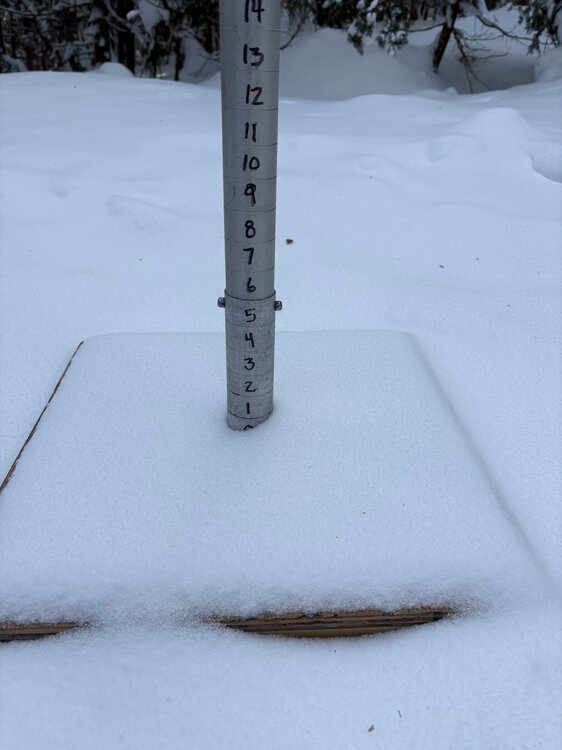
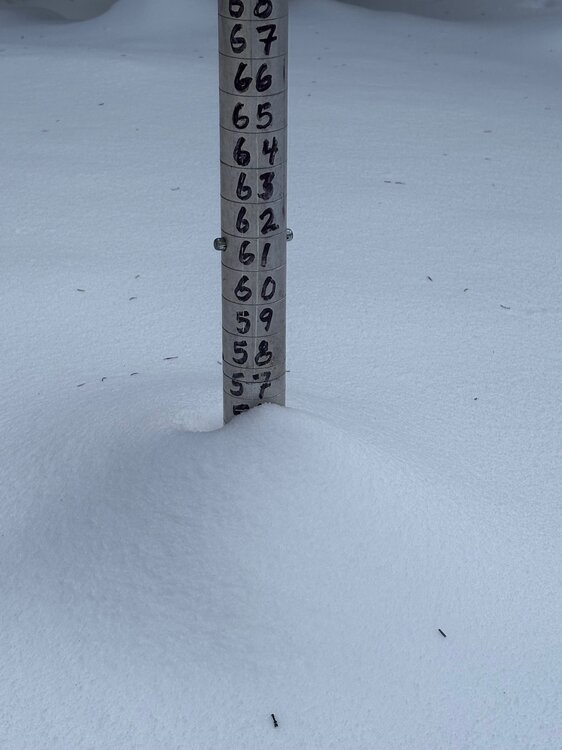
1” at the plot, plus some wind really filled in the turns above that elevation today. It was a dense inch, but not wet, and that leads to some smooth skiing. Its too bad this multi-week stretch has to end.
-
I am really sorry.
-

December 2025 regional war/obs/disco thread
Ginx snewx replied to Torch Tiger's topic in New England
Notice the dry slot. Always the dry slot -

December 2025 regional war/obs/disco thread
Torch Tiger replied to Torch Tiger's topic in New England
The first of last years December cutters (power cutter iirc) was very memorable and wild. Hoping for that -
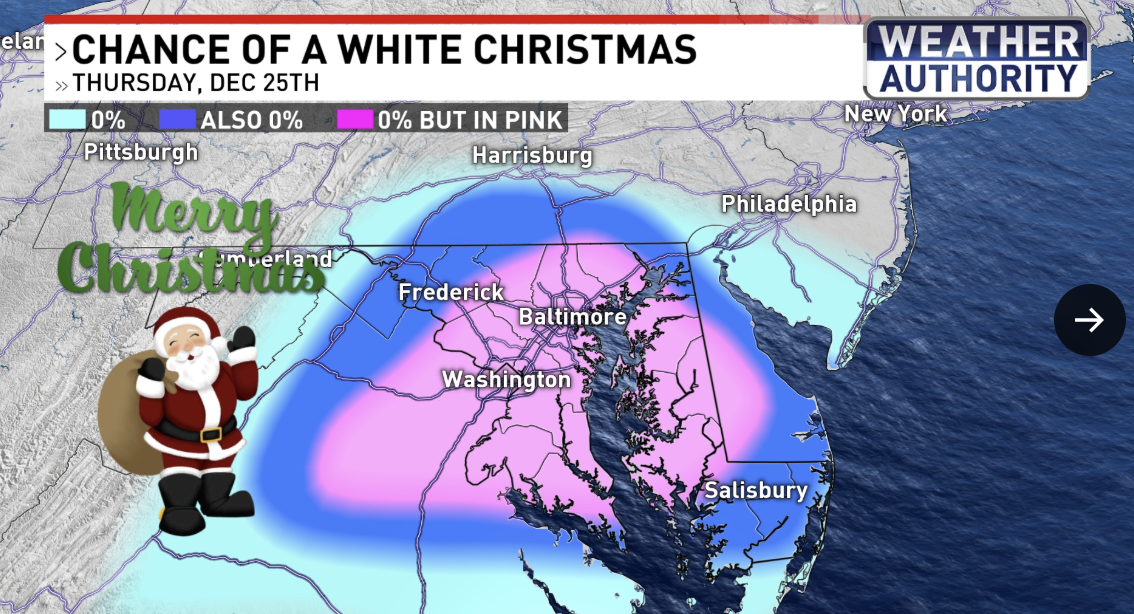
Historic warmth in a Nina December, it’s a climate emergency
-

Central PA Winter 25/26 Discussion and Obs
canderson replied to MAG5035's topic in Upstate New York/Pennsylvania
THV 46, LNS 52 Somerset with the highest - 63 CTP 59 -
This torch is very impressive and will result in many places in south where the anomalies have been ip to -8 so far to average near normal. The only place that will remain relatively average through end of the month is the northeast. Rest of US is in a big torch and the worst part is it doesn’t show signs of changing either. It will be impossible, mark my words, impossible, to get snow in this area with such warmth across CONUS. Any storm that comes into the west coast will be too warm like this past one, with snow confined to the far northern tier. And side from an occasional rain storm, most of the country will remain dry. Even reminiscent of Winter 2020 in that respect, where no one outside of the western 1/4th of country had much snow. And this season, even they don’t have any snow. This is also similar to mid December 2023 through early January 2024, where there was a coast to coast torch. One week into January 2024, that all changes though. However, this appears to be a very persistent pattern that will last into the forseeable future.
-

December 2025 regional war/obs/disco thread
WinterWolf replied to Torch Tiger's topic in New England
Maybe we lose power at school tomorrow morning…lol…we can only hope. -
Typical day for kdxken
-
December 2025 regional war/obs/disco thread
WinterWolf replied to Torch Tiger's topic in New England
Lol…Kevin having an orgasm right now. -
8 to 2 pm
-

December 2025 regional war/obs/disco thread
metagraphica replied to Torch Tiger's topic in New England
What time are we thinking for the worst winds tomorrow?