All Activity
- Past hour
-
Maybe cuz it's not there? He's in for some trolling next week.
-
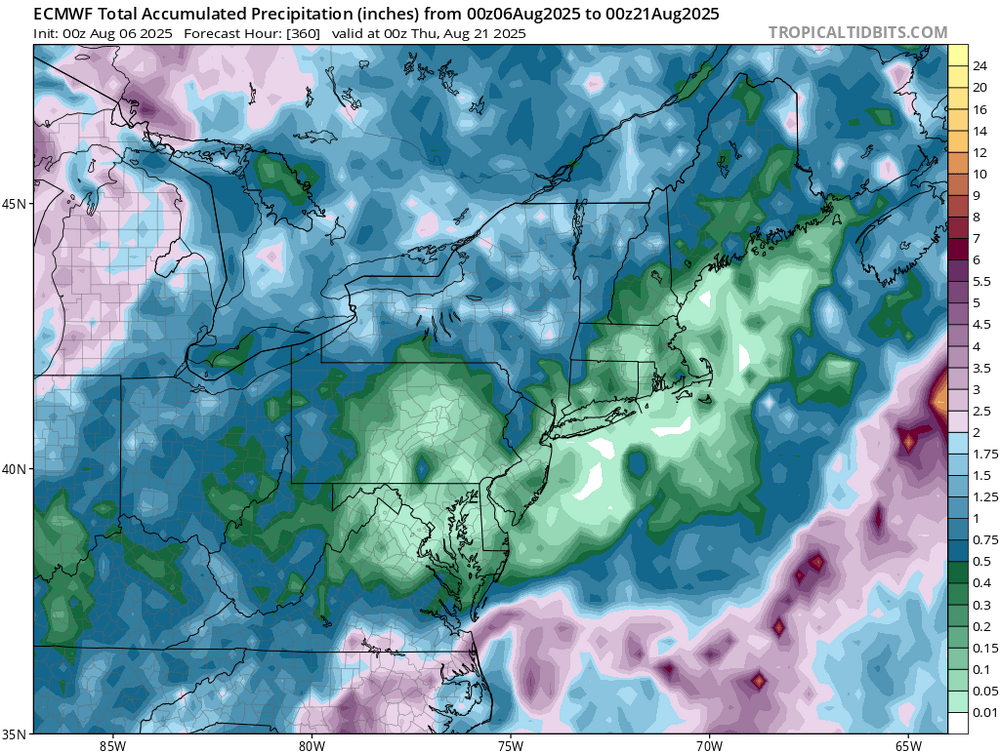
Not going to get better anytime soon. If you missed the last rain it's going to be quite a stretch.
-

Central PA Summer 2025
Mount Joy Snowman replied to Voyager's topic in Upstate New York/Pennsylvania
67/65 when I left the house. Smoke haze was much worse in Harrisburg yesterday, barely noticeable at home. -
Lawns are hurting Sent from my SM-S921U using Tapatalk
-
Longest heat wave of the summer next week? Looks possible.
-

Chester County PA - Analytical Battle of Actual vs. Altered Climate Data
chubbs replied to ChescoWx's topic in Climate Change
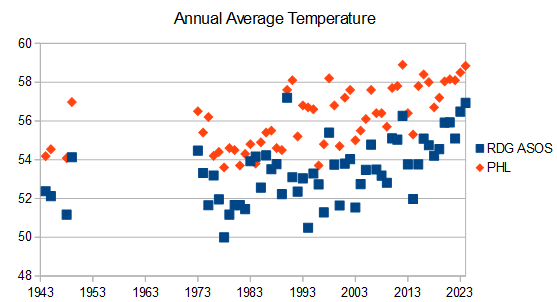
PHL isn't pulling away though. You are looking at the regression line, not the data itself. Reading (and Chesco) are warming as fast as the airport at the end of your chart., Note also that there are several years when Reading (and Chesco) is warmer than the Philadelphia Airport. That's a red flag for a data issue of some kind. Those years could have a big effect on the regression line. So what's going on here. I found two sets of data. COOP data from Xmacis starting in 1999, with the first year of full coverage in 2000; and, ASOS data from IEM which starting in 1943, but with many missing or incomplete years before 1973. Note that I was only able to find info on missing data at IEM with a one month resolution, So there may be some periods with missing data included in this analysis. The COOP data starting in 2000 shows a close match between RDG and PHL, with RDG warming faster than PHL, 1.3F/Decade vs 1.0F/Decade The ASOS data also shows a close match between RDG and PHL, but there is more scatter in the pre-2000 period, perhaps due to missing data. The difference between Reading and Philly is roughly the same in 1943 and 2024. You are beating a dead horse. There is plenty of high quality data that shows that the Airport is warming at the same rate as Chesco and the entire region. Sure you can find incomplete/inconsistent data or conduct a faulty analysis that says otherwise, but that doesn't negate the findings from the high quality data. You have to look at all the evidence. A piece of evidence that disagrees with consistent results from high quality data is inevitably flawed in some way.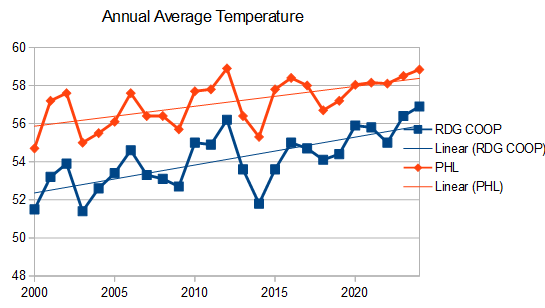
-

2025-2026 ENSO
PhiEaglesfan712 replied to 40/70 Benchmark's topic in Weather Forecasting and Discussion
It could probably be that Nino 1+2 has been in an el nino state, even after the 2023-24 el nino ended. My guess that will stick at least through the next official el nino. If we get a strong or super el nino in the coming years, Nino 1+2 will really go off the charts (like in 82-83 and 97-98). -
This strongly supports the development of a Niña:
-
What a week ago on the GFS looked like it might finally be a sustained, active severe weather pattern for us this coming weekend into early next week now looks to once again focus well west of the Mississippi River and stay there until it fizzles out.
-
- Today
-
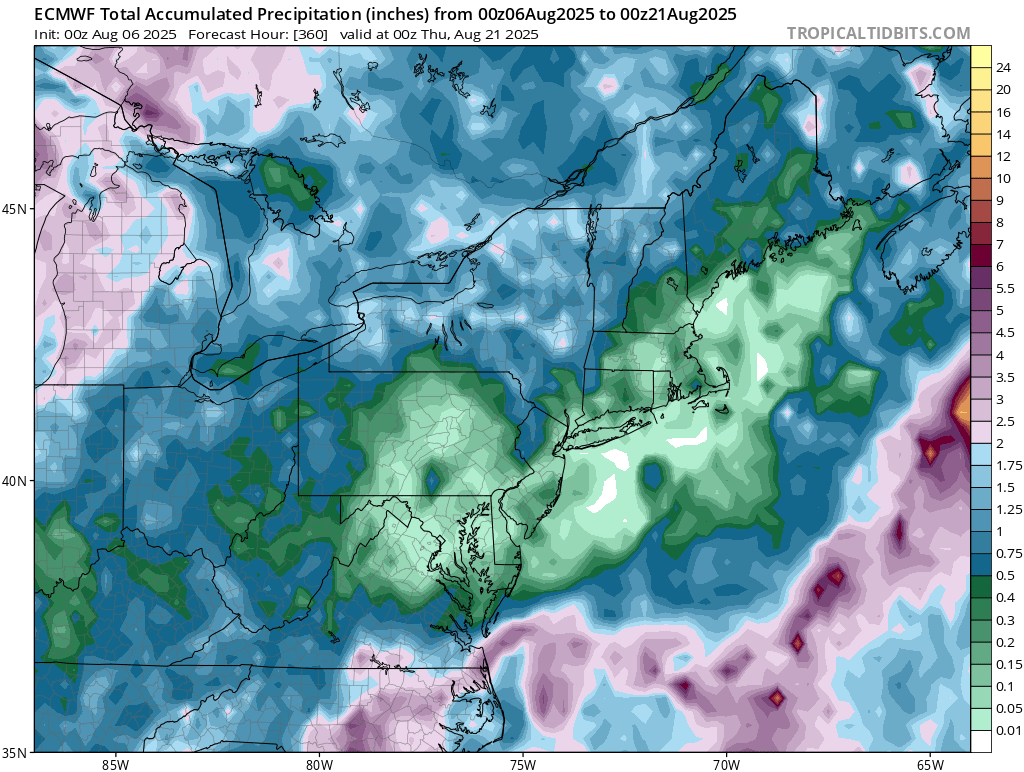
Euro thru the next two weeks….
-
US National Weather Service Philadelphia/Mount Holly · Follow estpndrooS53tmlhm11gl53uf347ccugl06c72205faul0h18197823819h9 · Solar summer 2025 ends today. What are we talking about, you may ask? Well, today marks the midpoint between the summer solstice and the autumnal equinox. The 3 months with the longest days are now over, and day length will steadily decrease from here.
-
-

2025 Atlantic Hurricane Season
Floydbuster replied to BarryStantonGBP's topic in Tropical Headquarters
I think we see a major hurricane in the Atlantic sometime later this month, and likely a threat to land masses of the Caribbean or Western Atlantic. The MJO pattern looks set to give us a good burst just in time for late August. -
I remember Carol. Where I was (71 summers ago, age 7) in NNJ. Carol passed east of us. The Beech tree in our front yard toppled-it was quite a big blow and got me hooked on hurricanes. We were rewarded with 2 more hits that season!
-
A very good luck with that…
-
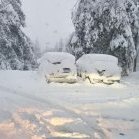
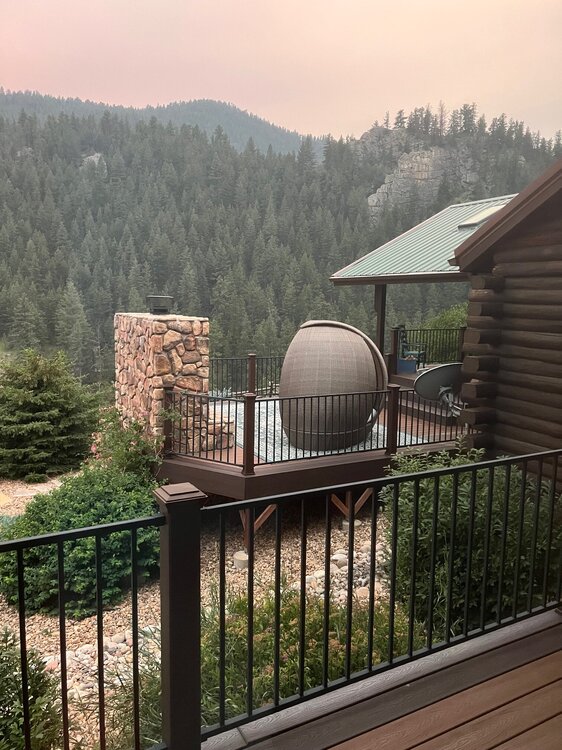
I had a feeling this post would put a voodoo curse on us. The view from here this afternoon.
-
 Yeah it definitely wasn't one of those winters with lots of days in the 50s. Average to slightly below average temps and frequent light snowfalls with a good amount of snowcover days. At least it felt and seemed like winter even though we missed the big snowstorms.
 -
This. There's nothing worth tracking, but anything that pops could quickly become worthy
-
the eye broke up and strongest sfc winds went way east. mid-lower cape had the strongest winds BID aside. yeah it was a big'un, no power for two weeks in East Falmouth, MA. Remnant eye went overhead. Yore
-
 Yes a dud as far as snow goes but at least it was colder than normal (although not by much), rare in recent years.
 -
Moon had an orange tint to it here tonight. Nothing like that.
-
I believe I've mentioned this in another Bob post/thread, but Bob's eye went right over Bristol. We went outside and did some quick cleanup as the eye came through. Pretty surreal - lots of tree damage in East Bay of RI with that storm! No power for 3 days or so, at least at my apartment on 114.
-
That makes sense given the QBO as well. As of now, there's an obvious disconnect with the SST'S and Atmosphere. So, the NATL SST'S may not factor in too much if that were to continue into Winter. On to the reason of such a disconnect, that probably has something to do with Solar/ tropospheric imo. Mountain Torque could be at play some but, not to the disconnect Magnitude there is I don't think. Jeff may have a better or a more detailed explanation on the Subject.
-
Yeah for fantasy range it’s slightly interesting. Less the storm than the overall steering pattern, which has looked pretty consistent (thus far) for an EC threat if there’s a wave that can ride into the SW Atlantic.