All Activity
- Past hour
-
Been saying that for years. In fact, my daughter came over yesterday to cut my hair, and I mentioned that very thing. When the world goes tits up, at least we have lots of water here. I'm not not moving from here.
-
In that solution/depiction? No, CT definitely porked too. Matter of how many inches haha.
-
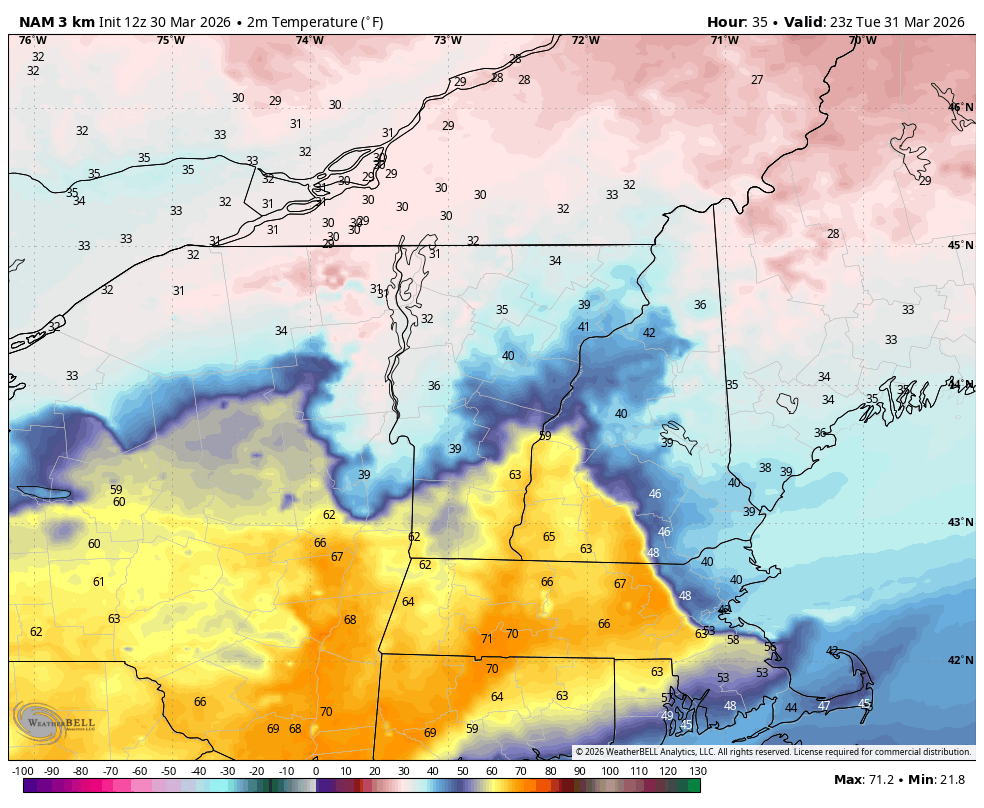
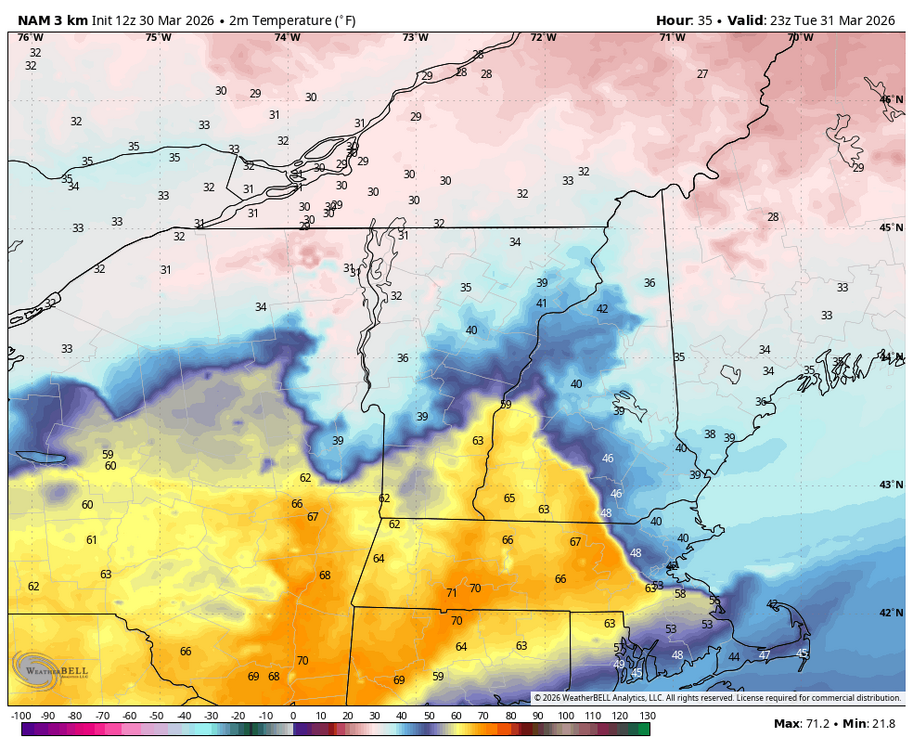
This is a wild 2M Temp map tomorrow evening... Freezing rain in the Champlain Valley while it's near 70F at ALB and CEF.
-
 In any event, this is going to be the hottest March on record at Death Valley National Park by a HUGE margin (pop: zero, wilderness station).
 -
Some striking differences though on the mesos with the HRRR and (to some degree) RRFS the more aggressive of the guidance.
-
My area is likely porked......maybe CT is okay.
-
Not a very good example. FOK was more of a microclimate, if it's even a legit measurement. It was lower than any other location, regardless of rural/urban location, for hundreds of miles. Nothing lower until deep into New England. It was like 5F colder than even the coldest personal weather stations on Long Island.
-
Could be some interesting storms late tomorrow afternoon and early evening right along the boundary. Might even see a decent line make its way into western Mass/CT during the evening. Its pretty unstable with steep lapse rates south of the boundary with strong shear
-
12z NAM has a vicious W-E aligned frontal boundary on Wednesday ... It tries to get the region damn close to even freezing rain metro west of Boston. The FOUS grid has 0,0,+3 over Logan, which academically means 0C at the SFC. It's probably more like 32.9 It's all coming down to where to place this stationary boundary. The cold side is prooobably being over assessed ( NAM) in this case, but... in principle, we're still looking easily at 40+ deg F of variance across 100 miles or less with this set up -
-
The NAM 3k sees the current rain........................ The NAM 12 K is blind to the rain.
-
Unfortunately understanding how a rural small remote college which had DIV2 level athletes ,turned into the most successful basketball teams in history, captivating an entire state, is unexplainable. We love our Huskies. The fact both men's and women's teams are so successful brings in the entire family in. Its unique and amazing
-
That mid-March storm was remarkable both for the amounts in NNE and the relatively modest barometer. We'd had a very strong HP in the 2 days prior to the snow, and the pressure was still about 30.40" when flakes arrived at 9 PM on 3/13. We had 22" from 6A-8P on the 14th as pressure slowly lowered to 30.05". Rates peaked at 3"/hr 11A-1P, right when Fort Kent school admin decided to close schools at noon. All students got home safely, even those from Winterville, 25 miles and 2 major hills south from FK. My records for that storm (obs time 9 PM so nothing on the 13th): 3/13 10 -18 0 0 46 (Allagash had -32) 3/14 12 2 2.08 25.0 65 3/15 28 10 0.10 1.5 64 We had to retrieve a disabled snowmobile a couple miles south from Estcourt Station on the 15th. I found the depth was 80" there, presumably several inches less than when accumulation had stopped.
- Today
-
00z guidance attempting to lure warm enthusiast into a set up ... muah hahaha I grew up in the ... antiquities of modeling yester-lore ( eh hm), and recall a day and times when if there were ever a BD on the chart near Maine... the verification snows in Atlanta Georgia. No not literally ..but if figuratively/sarcastically. Point being, the models were just inadequate in handling them, particularly because the physics for the lower BL was still being evolved, as well ... the modeling tech was intrinsically having very low resolution/grid point evaluation density when processing. Those limitations meant that BDs, being almost entirely in the lowest 250 mb of troposphere, were only quasi detectable. like hinted at ? Now, huge improvements in the wholesale modeling, from input density/grid resolution, to improvements in various BL assumptions in the baseline physical equations means that the models at least know that there is a BD on the map with far better coherence. They're even improving on the position of them, per interval. Having said that... those ancient early life abuses don't set me up very well for mature adult relationships with models - I tend to still be relationship avoidant/fear of intimacy when it comes to dating prospects that include actually holding off BDs. It doesn't help that BDs are by nature a 'rough sex' experience and I'm not into that sort of thing
-
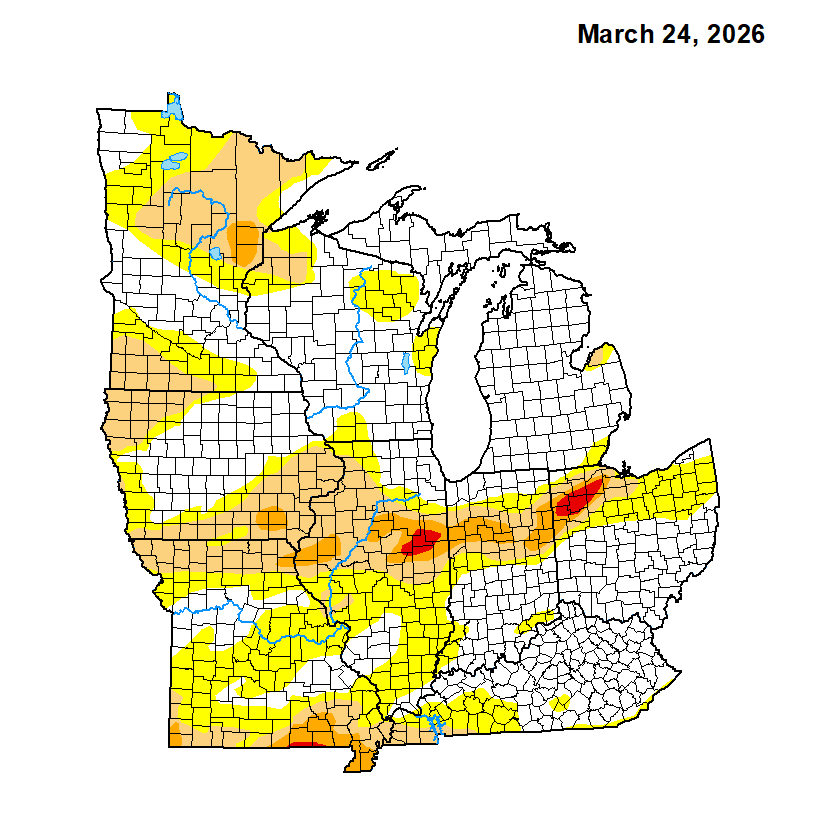
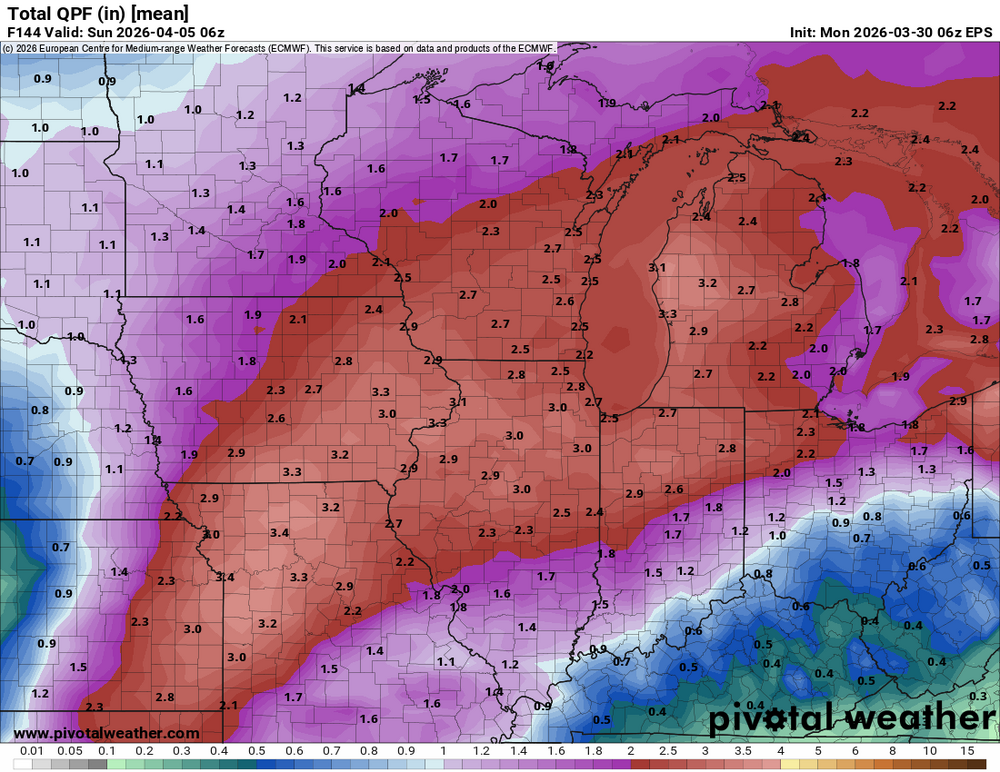
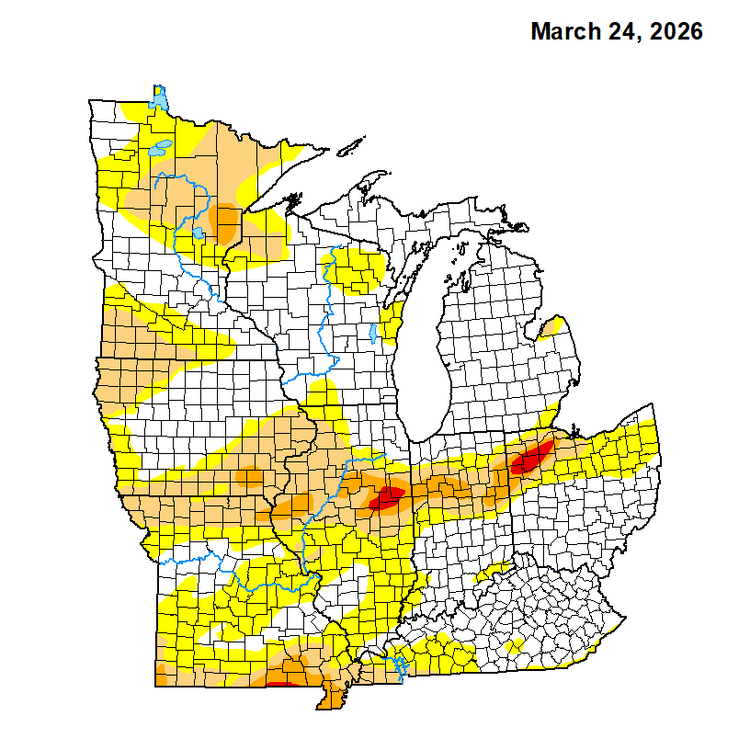
As temps and sun angle increase through spring, so does evaporation. Also, vegetation coming out of dormancy increases water uptake from soil. So 1/2” in winter goes a lot further than 1/2” in summer. Couple this with increasing water usage for lawns, In other words, we’re in trouble with a rapidly worsening drought. This is when we will see lake levels start to plummet. We need repeated widespread 1-3” rains to make a serious dent at this point
-
Rainy, dark and dreary.
-
A much-needed widespread soaker over the next week.
-
I've been saying May 2015 is a good analog for April. Second month after the end of a cold and snowy winter, and a possible budding strong el nino.
-
If we have westerly winds sure. When you see the low heights to our NE this time of year though we all know what that means.
-
Very true. Refuse to Lose was an awesome time. I knew the entire starting lineup as a 13 year old, and I can't remember anything like it since in this area.
-
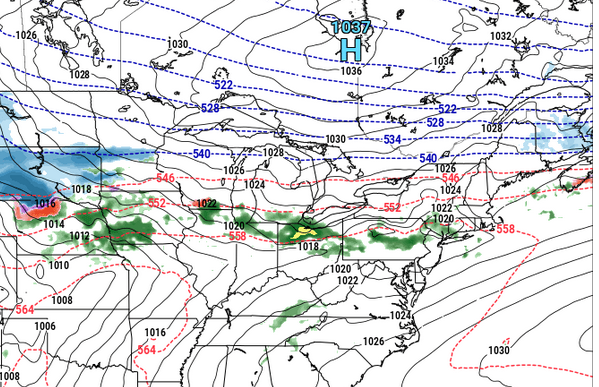
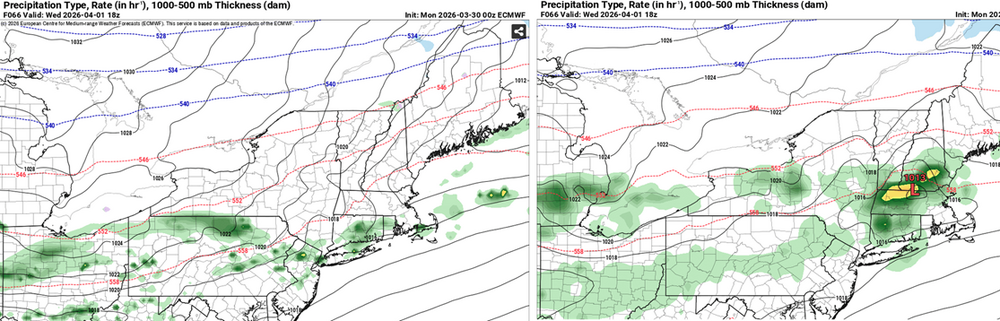
Weird to see the Euro 60 hours ( 00z ) be so differently designed than the GFS. I did notice that the last 6 consecutive cycles of the the guidance have en mass/average been raising heights a tick or two...Now 582 dm over Logan ..versus 573 for this mid week's period from just a day or so ago. The Euro appears to be conceding to that with a frontal wave in NNE and Wed am warm sector ...front comes thru noon-ish but weak backside CAA in intense April sun, d-slope under lingering 850s in the +6 or 7 range... that's a decidedly different implication than the GFS. The Euro might actually be a better fit for that tendency to raise heights with the ridging/582. I guess in the strict Meteorological techy shit it's not that hugely different, but the sensible weather implication is really where the differences lie - and "lie" may be the best fit. Ha. Verbatim, this GFS (right) is orange lightning slow growl rumbler rains with chilly air undercutting into NE zones. Wet where mild so capped temperatures SW and basically ... blegh. The Euro on the other hand is probably 75 F with partliy sunny. Over all, there was less cold undercutting total synoptic implications across all guidance... Slightly but perhaps crucially less aggressive in that regard. I think I speak for the majority at this point, we hope so.
-
alot of it will miss to our NW however-SE ridge flexing
-

It's time to grade Winter 2025-26(now that it's actually over)
GramaxRefugee replied to CAPE's topic in Mid Atlantic
(Enjoyed reading everyone's grading and explanations) A- The criteria, (In chronological order. Not all items are equally weighted): 1. White Christmas: Fail; but significant December snow and BN cold softens this greatly 2. AN snowfall: Success; but not by a whole lot. 3. at least one MECS: Fail; but with a major snowfall in Jan which was close. Tough call here. 4. Just plain cold: Success. BN for each month of DJF. Don't have a thermometer? Just observe the tidewater and freshwater both. Fast ice for a month +/-. I have made a crude chart below of DJF Temp Avg at BWI since 1950, and this year was 14th coldest out of the 75 years. Anomaly not listed, but roughly -3f for each month. Sorted by Average; the usual suspects are on top. (Apologies for my XL skills) YEAR JAN FEB Previous DEC DJF AVG 1963 28.7 27.7 30.9 29.1 1977 22.9 36.5 32.6 30.7 1978 29.2 27.3 35.6 30.7 2003 28.3 30.2 34.3 30.9 1961 27.6 37.0 28.4 31.0 1964 33.8 33.2 28.7 31.9 1982 25.5 35.8 34.5 31.9 2015 30.8 25.3 39.9 32.0 1994 27.0 34.0 36.2 32.4 1959 32.0 35.7 29.9 32.5 1962 32.4 32.3 33.4 32.7 1970 27.8 35.4 35.2 32.8 2010 32.7 30.9 34.8 32.8 2026 30.5 33.7 M M M M M M M M 34.2 32.8 1966 29.8 30.5 38.3 32.9 1968 29.2 32.1 37.3 32.9 1979 33.1 25.5 40.1 32.9 2004 27.6 34.8 36.4 32.9 1986 33.1 32.9 33.7 33.2 2014 27.4 32.9 39.6 33.3 1958 32.4 28.9 39.1 33.5 2011 30.2 38.5 32.4 33.7 1969 31.7 34.9 34.6 33.7 1996 31.7 35.7 33.9 33.8 2001 33.0 38.5 30.0 33.8 1955 32.3 34.4 35.0 33.9 1981 27.9 38.8 35.5 34.1 1956 32.6 38.7 31.3 34.2 1984 28.5 41.7 33.2 34.5 1967 37.4 30.7 35.6 34.6 1988 28.6 35.8 39.8 34.7 1965 30.7 34.9 39.0 34.9 1987 32.4 34.3 38.1 34.9 2009 29.3 37.4 38.5 35.1 1980 33.8 31.4 40.3 35.2 1971 30.0 37.4 38.2 35.2 2025 30.3 37.6 38.6 35.5 1951 36.9 36.5 33.3 35.6 1993 37.9 31.4 38.9 36.1 2005 34.1 36.7 37.5 36.1 1974 37.9 33.8 37.3 36.3 1973 34.6 34.3 40.3 36.4 2018 32.0 41.8 35.5 36.4 1990 42.0 42.2 25.3 36.5 2000 32.5 38.0 39.1 36.5 2007 38.7 29.1 42.4 36.7 1992 34.5 37.1 38.7 36.8 2008 35.4 37.1 37.8 36.8 1989 37.9 36.4 36.3 36.9 2019 33.5 37.8 39.7 37.0 1960 36.0 36.2 39.0 37.1 1983 34.6 34.7 42.0 37.1 2006 41.5 36.1 34.0 37.2 2021 36.7 35.8 39.4 37.3 1976 30.8 44.0 37.2 37.3 1985 29.2 38.7 44.1 37.3 1957 30.3 39.0 43.5 37.6 1954 33.0 40.9 39.0 37.6 1997 32.7 40.9 39.6 37.7 1999 35.1 37.6 41.0 37.9 2013 36.9 35.0 42.7 38.2 1995 39.0 33.1 42.6 38.2 1972 37.6 34.3 43.7 38.5 1952 38.5 39.3 38.3 38.7 1953 39.0 40.0 37.8 38.9 1975 38.5 39.0 40.3 39.3 2022 32.3 40.0 45.5 39.3 2016 31.9 37.4 49.0 39.4 1991 35.5 40.7 42.2 39.5 2002 39.1 39.3 42.1 40.2 1998 40.9 41.7 38.4 40.3 2017 39.0 44.2 38.3 40.5 2020 40.2 42.0 39.9 40.7 2012 38.3 41.6 42.2 40.7 2024 37.6 41.1 43.7 40.8 2023 43.9 44.7 37.5 42.0 -
forecast backed off this week’s heat a little and has in and out showers all week
-
Couple legit snow chances over the next week here. Typical spring whiplash doing its thing after hitting 70 yesterday and today. I’ll take the precip in any form it comes.
-

2026-2027 El Nino
40/70 Benchmark replied to Stormchaserchuck1's topic in Weather Forecasting and Discussion
Well, anything is theoretically possible when ENSO isn't overwhelming....because other factors dictate the hemispheric pattern...too early to say just yet.