All Activity
- Past hour
-
I don't understand the value in using a single season as an analog. Wouldn't the entire earth have to be exactly the same for the season to play out in the same way? Why don't these ppl just use an average?
-

September 2025 OBS-Discussion centered NYC subforum
psv88 replied to wdrag's topic in New York City Metro
50.8. New spot on this hill doesn’t radiate as well as the old house which was in a lower lying area. -
Canaan hit 22.6 at some point early this morning.
-
46° for the low
-
38 last night. About to set up my new weather station and put my current one at the lowest point on the property. I’m sure it was a few degrees colder.
-
NWS official forecast is still mostly dry for tomorrow. Low pressure off the coast will provide more clouds and possibly a shower near and east of I-95 on Wednesday.
-
friend's camp in Eustis was 30F.
-

2025-2026 ENSO
donsutherland1 replied to 40/70 Benchmark's topic in Weather Forecasting and Discussion
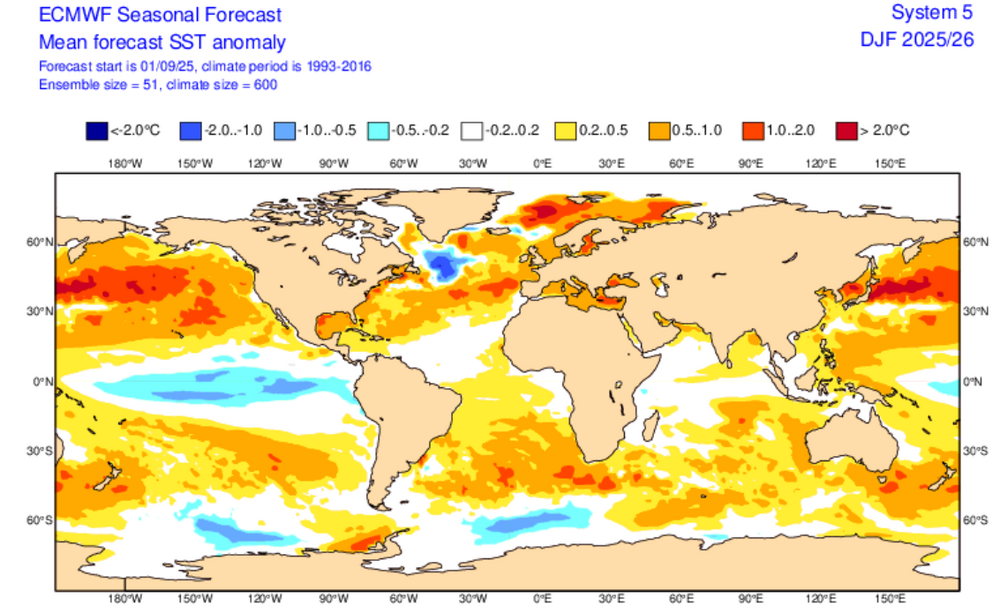
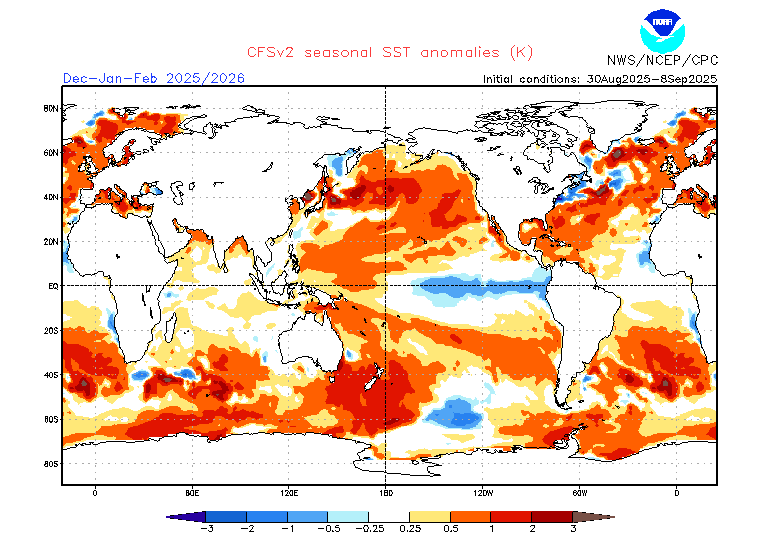
Assuming that the SSTs will drive the pattern, he would need big changes from what is forecast for Winter 2025-26 to be similar to that for Winter 2013-14. The core of the warm anomalies would need to shift much farther east. 2013-14 Current Forecast (ECMWF): Current Forecast (CFSv2):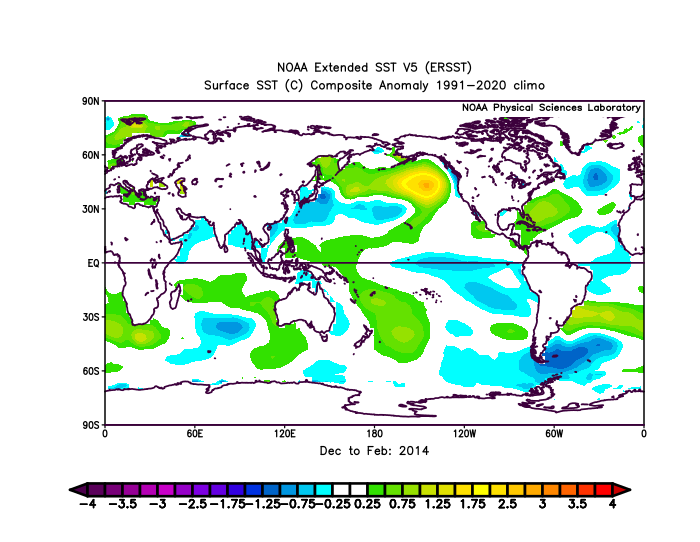
-
34 this morning, close but the garden still lives (though growth/ripening has slowed considerably).
-
HIE…Whitefield
-
September 2025 OBS-Discussion centered NYC subforum
donsutherland1 replied to wdrag's topic in New York City Metro
White Plains recorded a low of 53° this morning, its second consecutive day with a low of 53° or below. 2025 has now seen two stretches of at least two consecutive lows of 53° or below through September 9th (August 30-31 and September 8-9). The last time that happened was in 2017 (September 1-2 and September 8-9). Since August 1, White Plains has had 20 days with lows of 59° or below. That is the most since 1994 and tied with 1962 and 1987 for the fourth most. Most Days with Lows < 60° (August 1-September 9): 1. 22, 1964 and 1994 3. 21, 1957 4. 20, 1962, 1987, 2025 7. 19, 1982 8. 18, 1986 9. 17, 1972, 1988, 1997 - Today
-
Whos the 31?
-
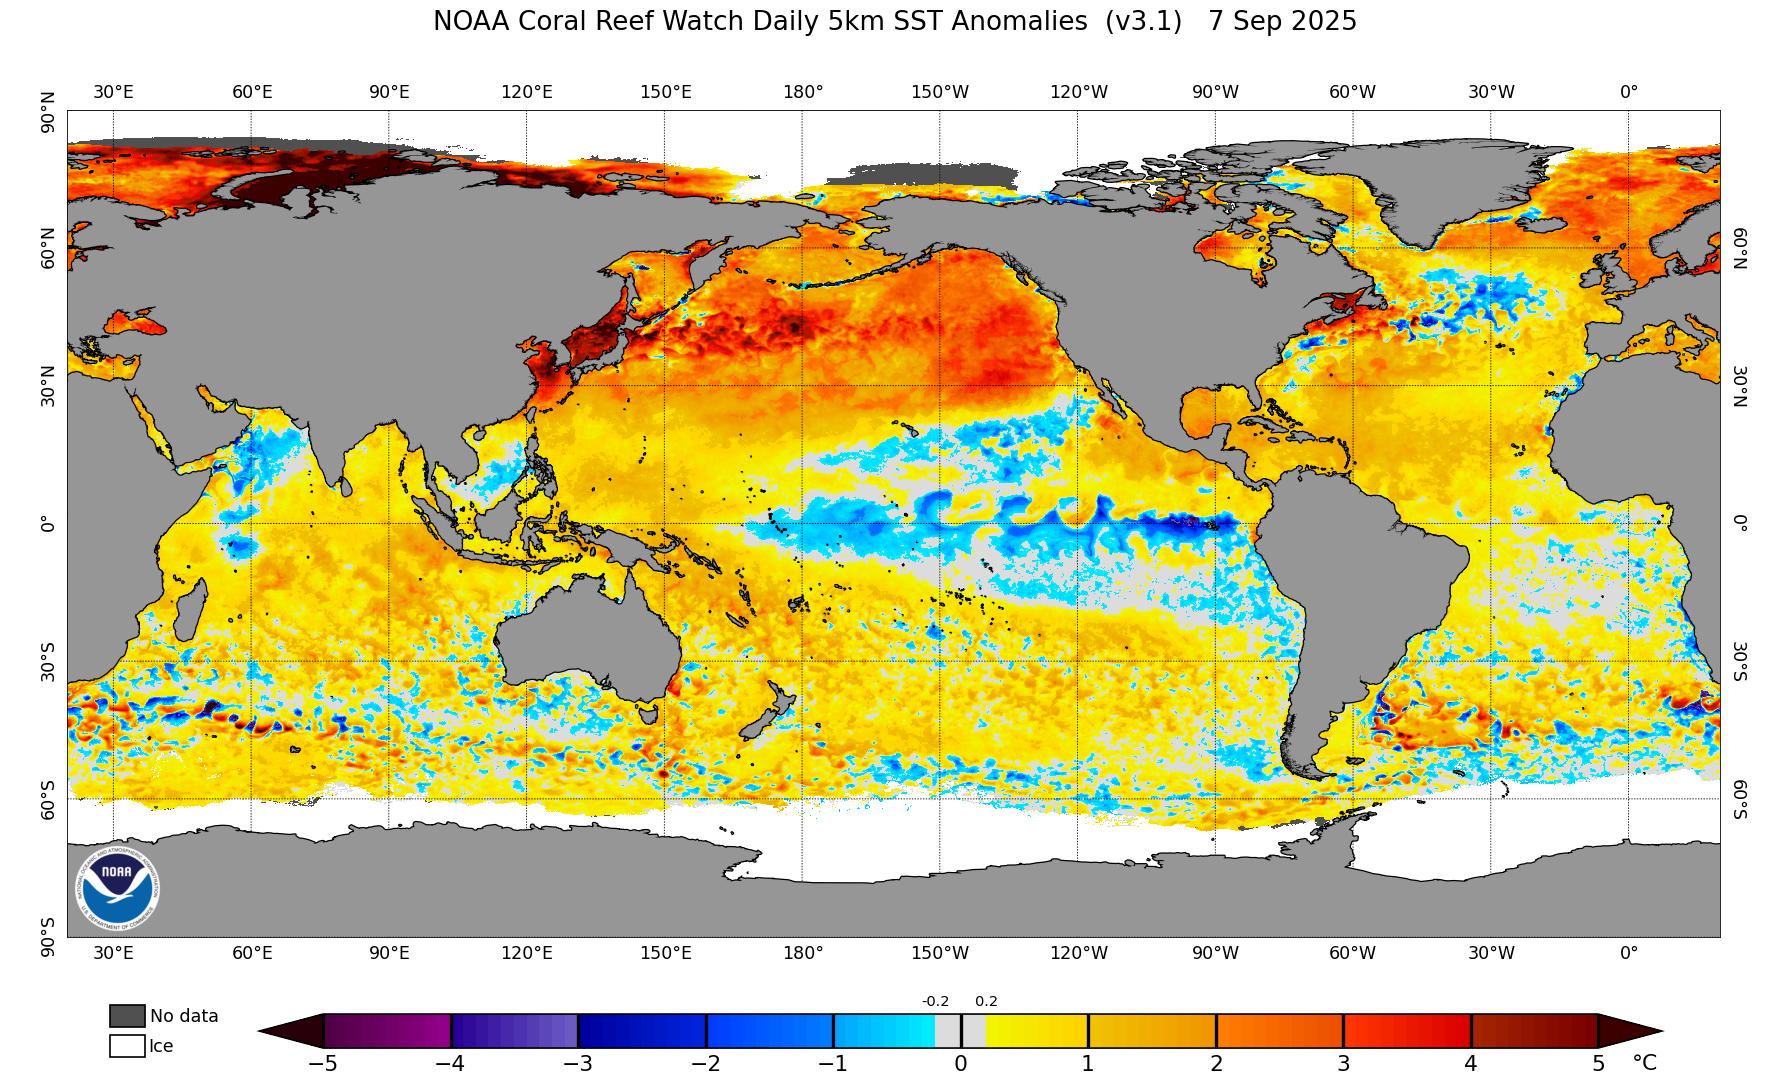
Chris, What are your thoughts about what met. Travis Roberts said about the E US winter potential for cold/trough similar to Jan of 2014 in the video (linked by Anthony above) due to the very warm water in the NE Pacific that’s similar to 2014? My concern is that 2014 didn’t also have that very warm water going back to Japan thus meaning it isn’t an apples to apples comparison. I thought that the 2014 warm water was heavily concentrated in the NE Pacific and thus was the primary cause for that Jan 2014 cold E US. But in contrast now, the warm water isn’t just concentrated in the NE Pacific. Related to this, the August 2013 PDO wasn’t nearly as negative with it at -1.56 vs August 2025’s -3.23:
-

September 2025 OBS-Discussion centered NYC subforum
SACRUS replied to wdrag's topic in New York City Metro
Ridge building down by mid month and beyond should even out a cooler first half of the month with a much warmer second half, still a tendency of onshore but flow should come around to N/S W over time progressing between the 15 - 18 -
50 here. Will be sad when lows get below 50.
-
September 2025 OBS-Discussion centered NYC subforum
SACRUS replied to wdrag's topic in New York City Metro
Highs: EWR: 94 (1964) NYC: 94 (1915) LGA: 93 (2016) JFK: 93 (1959) Lows: EWR: 48 (1938) NYC: 48 (1883) LGA: 53 (1956) JFK: 51 (1986) Historical: 1775: The Independence Hurricane slammed into Halifax, Nova Scotia, Canada. Many ships were sunk and buildings demolished. 4,000 people died in what is considered to be Canada's deadliest hurricane disaster. 1821: A tornadic outbreak affected the New England states of Massachusetts, New Hampshire, and Vermont on this day. Five tornadoes reportedly touched down from this event. One storm in New Hampshire had a path width of a half mile and tracked an estimated 23 miles. This tornado killed at least six individuals, which could be the deadliest tornado in New Hampshire history. 1881: For the first time in 33 days, rain fell at Washington, DC. (Ref. for 33 day drought in 1881 ) 1889: A hurricane that formed east of the Antilles moved north and then northward toward New Jersey. The storm came within 150 miles of Atlantic City, NJ before becoming nearly stationary for 4 days. The storm, one of the greatest storms to affect the shore and ocean, then turned to the southwest toward Norfolk, VA, and dissipated. Atlantic City measured a gust to 100 mph on the 10th. At Philadelphia, PA, rain began on the 10th. This began a period of 12 consecutive days of measurable rain, with a final total of 3.70 inches. Another sudden and damaging storm surge hit Long Island, NY and the Jersey shore during the evening on the 10th, following the 1st surge that hit on the 8th. The storm was located south of Cape Cod and east of Norfolk, VA, when the surge moved in. 29 ships were sunk in the Delaware Bay, killing at least 31 sailors. Officially, 40 lives were lost attributed to this hurricane. (Ref. Wilson Wx. History) 1919: 300 lives were lost mostly in ships near Key West, where winds were reported at 110 mph as a violent hurricane caused considerable damage. Brick structures had walls blown out and large vessels were torn from their moorings and blown on banks. A tornado destroyed six buildings and damaged 19, injuring six people at Goulds in Dade County. This hurricane killed hundreds more on its track to south Texas. The final death toll of over 600 was mostly in ships at seas. (Ref. Wilson Wx. History) 1921 - A dying tropical depression unloaded 38.2 inches of rain upon the town of Thrall in southeastern Texas killing 224 persons. 36.4 inches fell in 18 hours. (David Ludlum) (The Weather Channel) 1944 - The ""Great Atlantic Hurricane"" ravaged the east coast. The storm killed 22 persons and caused 63 million dollars damage in the Chesapeake Bay area, then besieged New England killing 390 persons and causing another 100 million dollars damage. (The Weather Channel) 1960: Extremely dangerous Category 4 Hurricane Donna was taking aim on the Florida Keys for the first of her four U.S. landfalls. On this date, Donnas’ winds peaked at 150 mph with a minimum central pressure of 934 millibars or 27.58 inches of mercury. (Ref. Wilson Wx. History) 1964: Hurricane Dora, the first storm of hurricane intensity to cross into northeast Florida from the Atlantic in 80 years of record keeping, moved inland over St. Augustine early on the 10th. St. Augustine was in the eye of the storm and recorded a sea level pressure of 966 millibars or 28.52 inches of mercury. Dora produced sustained winds of around 100 mph, and abnormally high tides to almost all coastal points north of Daytona Beach. Highest sustained winds, from the southwest, and estimated at 125 mph were reported at St. Augustine. Sustained winds of 82 mph were recorded in Jacksonville, and this was the first time in Weather Bureau history that winds of full hurricane force have been observed in Jacksonville. Storm tides reached 12 feet at St. Augustine and ranged between 5 and l0 feet above normal north of Daytona Beach. High winds in the Jacksonville area caused a massive utilities failure. One death and 8 injuries were reported from Dora. (Ref. AccWeather Weather History) 1965: Hurricane Betsy slammed into New Orleans on the evening of September 9, 1965. 110 mph winds and power failures were reported in New Orleans. The eye of the storm passed to the southwest of New Orleans on a northwesterly track. The northern and western eyewalls covered Southeast Louisiana and the New Orleans area from about 8 PM until 4 AM the next morning. In Thibodaux, winds of 130 mph to 140 mph were reported. The Baton Rouge weather bureau operated under auxiliary power, without telephone communication. 1971 - Hurricane Ginger formed, and remained a hurricane until the 5th of October. The 27 day life span was the longest of record for any hurricane in the North Atlantic Ocean. (The Weather Channel) 1976: Record rains that started on this day and ended on the 12th came from Tropical Storm Kathleen (called a 160+ year event by Meteorologists). 14.76 inches fell on south slopes of Mt. San Gorgonio, 10.13 inches at Mt. Laguna, 8 inches at Mt. San Jacinto, Over 4 inches in the Little San Bernardino Mountains, and 1.8 to 2.8 inches in the Coachella Valley. Deep Canyon (above La Quinta) recorded 2.96 inches in three hours on the 10th. Rainfall in the Santa Rosa Mountains above the Coachella Valley was called the “heaviest in recorded history.” Six were buried and killed in sand in Ocotillo. (Ref. Wilson Wx. History) 1983: On this date through the 10th, strong winds blasted through east central South Dakota, leaving in its wake damaged crops, hundreds of downed trees, broken windows, damaged roofs and buildings, downed power poles, and damaged vehicles. Gusts of up to 75 mph in Huron moved a semi trailer one-half block into a truck. Standing crops of corn, beans, and sunflowers suffered extensive damage in many areas with losses up to 50% reported. (Ref. Wilson Wx. History) 1986: An F-16 fighter jet had its windshield cracked by hail on its return to the Eagle Range Training Grounds near UT’s Great Salt Lake. A lightning bolt caused a hole 6 inches deep and 6 inches wide on a runway at the Salt Lake Int’l Airport. (Ref. Weather Guide Calendar with Phenomenal Weather Events 2011 Accord Pub. 2010, USA) 1987 - Thunderstorms produced severe weather in the central U.S. Thunderstorms in West Texas spawned four tornadoes in the vicinity of Lubbock, and produced baseball size hail and wind gusts to 81 mph at Ropesville. Thunderstorms produced hail two inches in diameter at Downs KS and Harvard NE, breaking car windows at Harvard. (The National Weather Summary) (Storm Data) 1988 - Florence became a hurricane and headed for the Central Gulf Coast Region. Florence made landfall early the next morning, passing over New Orleans LA. Winds gusts to 80 mph were recorded at an oil rig south of the Chandeleur Islands. Wind gusts around New Orleans reached 61 mph. Total property damage from Florence was estimated at 2.5 million dollars. (Storm Data) (The National Weather Summary) 1989 - The first snow of the season began to whiten the mountains of Wyoming early in the morning, as for two days a moist and unusually cold storm system affected the state. By the morning of the 11th, a foot of snow covered the ground at Burgess Junction. Thunderstorms developing along a cold front crossing the Ohio Valley produced severe weather in Indiana during the late afternoon and early evening hours. Strong thunderstorm winds blew down a tent at Palestine injuring seven persons, and frequent lightning interrupted the Purdue and Miami of Ohio football game, clearing the stands. (The National Weather Summary) (Storm Data) 1994: Glasgow, Montana: Temperature rises from 67°F at 5:02 AM to 97°F by 5:17 am. Heat burst is short-lived as temperature drops to 68°F by 5:40 AM the next morning. (Ref. WxDoctor) Hurricane John became extratropical in the north central Pacific Ocean, ending its 31-day life span as a tropical cyclone, the longest lived storm on record. (Ref. Wilson Wx. History) 2004: Western and central New York was inundated by drenching rains as the remnants of hurricane Frances drifted north. Area-wide rainfall totaled 3 to 5 inches with the bulk of it falling in a 6 to 9 hour period from very late on this date into the next day. At least one person was killed. Across the border, heavy rains of close to 4 inches over southern Quebec Canada. (Ref. Wilson Wx. History) 2008: Nome, AK reached a high temperature of 62°, which tied the high temperature record for the date and represented the third day during the month that a high temperature record was either tied or broken. (Ref. Wilson Wx. History) 2011: The remnants of Lee that was a very slow moving low pressure over Ohio has now been absorbed into the circulation a low over illinois and is expected to weaken through Saturday morning. The heavy rains over the Mid-Atlantic have diminished in coverage and are now limited to central and eastern Pennsylvania. Rainfall totals for VA- Colonial Beach 1.2 SSE 20.96, Woodbridge 0.5 SSW 16.20, Lorton 1.2 NE 15.09, Fort Belvoir/Davison AFB 13.77, Reston 2 N 11.45, Chantilly 2 ESE 10.18, Quantico MCAF 9.01, Copper Hill 6.2 S 8.89, Washington National 6.90, Richmond Byrd Field 6.06 Inches. (Ref. Rainfall Totals for 20 Other States - NWS Hydrometeorological Prediction Center Camp Springs, MD) Rich Hanauer lives in Furlong PA, between Philadelphia and Trenton NJ. Buckingham, PA (In this article) is just north of Philadelphia that had 24.71 inches of rain from Aug. 1st to today. (Ref. Newspaper Article from PA on flooding ) (Ref. Map of Rainfall Totals for VA from Sep. 5th to 9th) 2013: Historical rainfall occurred in northern Colorado from September 9 to September 16 and resulted in severe flash flooding along the northern Front Range of Colorado and subsequent river flooding downstream along the S 2017: Hurricane Irma was downgraded to a Category 3 storm shortly before noon Saturday after its maximum sustained winds weakened to 125 mph, but it was expected to strengthen before moving toward southwest Florida on Sunday. The National Hurricane Center said Irma was continuing to slam the north coast of Cuba Saturday but had weakened slightly. As of 2:00 p.m. EDT, the storm was located about 145 miles southeast of Key West, Fla. -
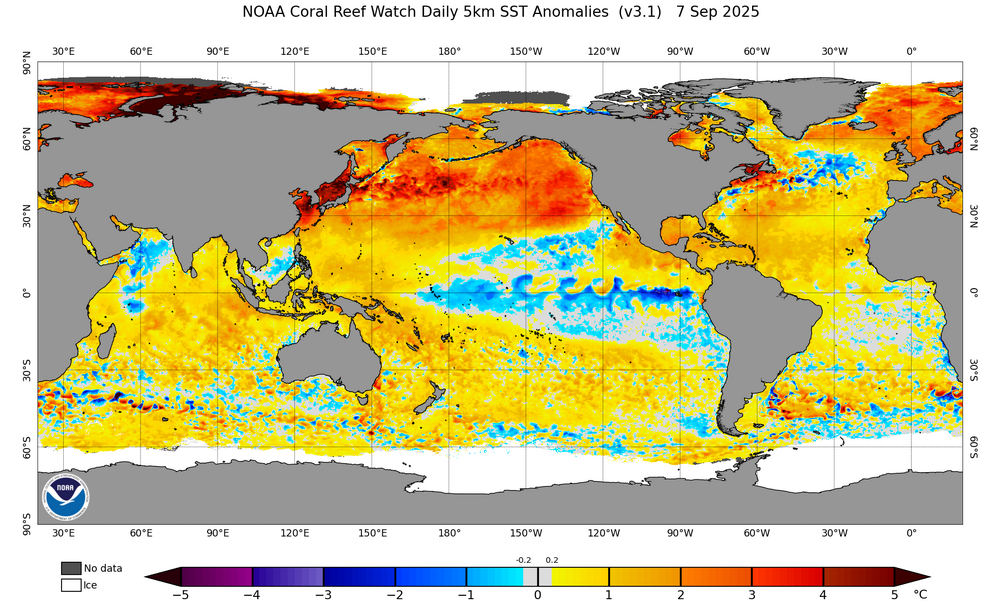
The record warm SST pattern from Japan to California and across the entire Atlantic mid-latitudes is a function of the continuous 500mb ridge which has been in place this summer. So it’s just a reflection of the higher pressures and lighter winds creating record SSTs below. My guess is that this mid-latitude warmth has created the current lull in tropical activity in the Atlantic with cooler tropical departures relative to further north. The thing to watch for later in the season is the potential for close in development with the record Gulf SSTs. While we are on track to finish with less ACE than last season, it only takes one with hurricanes. Hoping the Gulf can catch a break from the record run recent years. But we always have wait and see what happens since late September and October have been so active in recent years.
-
September 2025 OBS-Discussion centered NYC subforum
SACRUS replied to wdrag's topic in New York City Metro
61 / 53 clear. Clouds offshore inching NW over the day into tomorrow otherwise partly cloudy - sunny with NE flow keeping highs in the low - mid 70s. Some of the offshore rains may penetrate tomorrow with the euro the wettest. Clears out and warm up Thu to the upper 70s to low 80s. Overall drier / near normal through the 14th with an overall ridging warmer by the 15th and beyond. -
Yes, the tonight/tomorrow rain chances are sneaking up on us fast.
-
Jealous of the weather back home!
-
The overall tenor for a big winter we're currently dancing to from the social media speakers is emerging out of the CPM: "crowd physics model" For me anywho, it can't be geo-physical. There are certain aspects that are not refutable. The recent 10 or so year's worth of winters have rattled the out-of-classical-box teleconnector scaffolding: air and seas. These winters are showing a consistent shear stressed, mid and upper level velocity saturated hemisphere, regardless of the aforementioned states. Also, a time span in which I've read a lot of peer reviewed material elucidating these behavioral changes as both directly observed, and CC-attributable. That is not going away. Certainly not because crowd noise is resonating to some emerged popularity tempo. You're not asking me... but, I've mentioned recently that I do feel low confident for an early loaded either winter, or perhaps pattern that's quasi winter oriented... latter November through Dec. Emphasis on low confidence. The primary logic behind that is the science of increasing frequency of transient blocking during shoulder seasons. These are creating early and late "cold meanders"/vortex displacements. This happens in winter ( DJF ), but I'm seeing this as kicking in during Octobers and as late as May, if perhaps subtly but enough to distribute cool anomalies and cryo-supportive air mass events into mid latitudes. Articles are out there being dropped occasionally... https://www.science.org/doi/10.1126/sciadv.adq9557 Otherwise, I've seen other articles about the increased jet wind speeds, too - bit of separate consequence conjecture/science. It's an aspect you and I have discussed anecdotally in the past, and then the conjecture emerges in peer reviewal ..so - tfwiw. It's real, and the increased speed is causing resonate instability at all wave scales - teleconnectors are more unstable. We can certainly set up a 2015/Feb resonate look still, but there may be a reason why it's taken 10 years and we haven't really seen much more stable set ins. The knee jerk argument is that 2015 is a rare outlier, but the evades the point of time. This is different than the 1980s ( for example). The 1980s was longer lasting resonance that was not good much of the time. We're now getting screwed more and more in recent years because of behavioral aberrance. It's different. This is the other side of the same large variance coin that's been noted all over the world. Regions can be -20C, and then +20C, in the same month in 1955... but less frequently. And the beat goes on... Thus, I wouldn't guess (if) an early winter-like regime ( or perhaps a couple of them) characterized the Thanks Giggedy to Jan 10 span occurring, would characterize the whole way. Still, a 2013-2014 analog may be incidental. I noted in that SST comparison - though likely missed... - that the SST anomaly distribution up there in the NE Pac is not driving the weather pattern base-state. It is in fact the weather pattern's quasi coupling ( via sea surface wind stress distribution) that eventually accumulates or dissipates those cool/warm periods. It just so happens to be, that coincides/correlates with NW cold loading through Canada, around a planetary wave signature - more obvious in winter ... but, August being cooler? worth the consideration. If that persists, the early winter would also fit that. So these are some "modestly" compelling leading circumstances. As an aside, I also like the fact that the nadir of the sea-ice loss in the arctic shallowed considerably over recent years: https://climatereanalyzer.org/clim/seaice_daily/?nhsh=nh
-
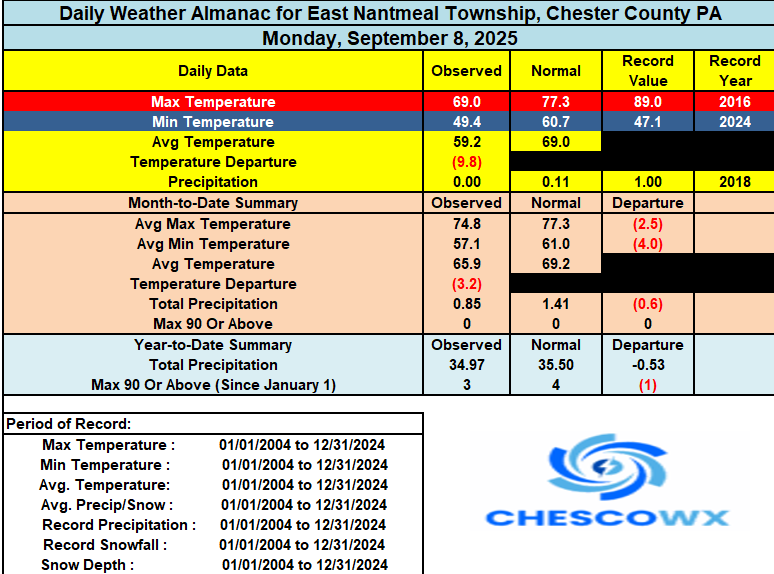
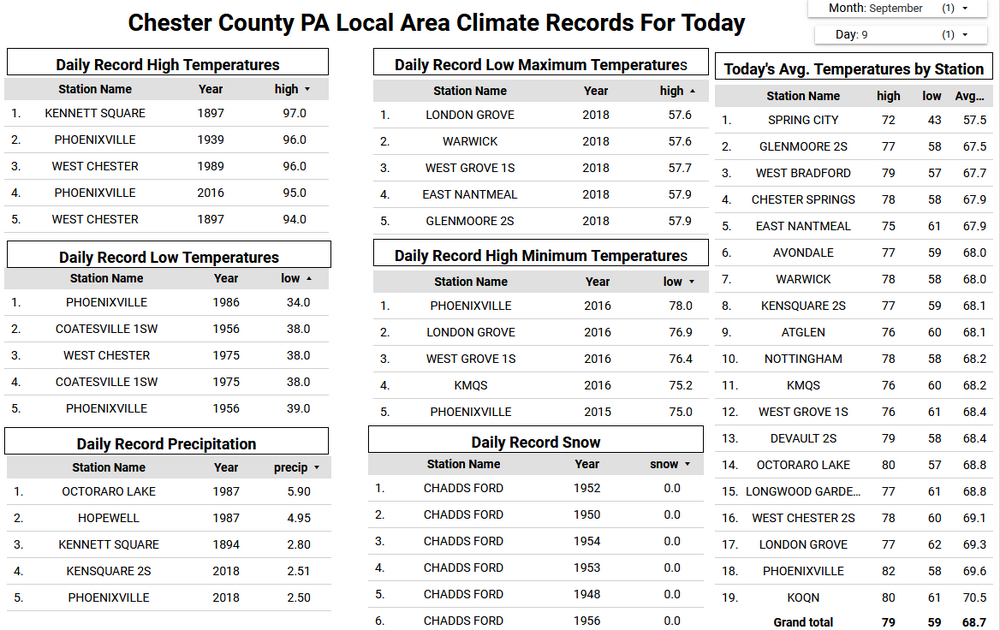
Widespread low temperatures again in the 40’s across much of the county. The lowest was our normal cold spot at Warwick Township at 42.7 degrees . If you think we have been experiencing a chilly stretch you are correct. Yesterday here in East Nantmeal was our 20th below normal temperature day over the last 22 days. We continue this below normal trend for the next couple of days before we may see near to slightly above normal temperatures by this weekend before slipping back to a little below normal by next week. No rain at all in the forecast for the next week.
-
(002).thumb.png.6e3d9d46bca5fe41aab7a74871dd8af8.png)
E PA/NJ/DE Autumn 2025 Obs/Discussion
ChescoWx replied to PhiEaglesfan712's topic in Philadelphia Region
Widespread low temperatures again in the 40’s across much of the county. The lowest was our normal cold spot at Warwick Township at 42.7 degrees . If you think we have been experiencing a chilly stretch you are correct. Yesterday here in East Nantmeal was our 20th below normal temperature day over the last 22 days. We continue this below normal trend for the next couple of days before we may see near to slightly above normal temperatures by this weekend before slipping back to a little below normal by next week. No rain at all in the forecast for the next week.
-
Not a Bears fan but read somewhere this morning that when he is pressured and starts to run, he doesn't look like he has control of his arms and legs. Just complete panic and I kinda laughed thinking back at watching it, lol. Commanders are so lucky JD5 was there at 2.
-
Autumn* we don’t have winter anymore
.thumb.jpeg.406ecda2eec9e267302c22b9f128fe3c.jpeg)