All Activity
- Past hour
-

Central PA Fall Discussions and Obs
Jns2183 replied to ChescoWx's topic in Upstate New York/Pennsylvania
The kraken awakes!!! Sent from my SM-X210 using Tapatalk -
Spooky Season (October Disco Thread)
CT Valley Snowman replied to Prismshine Productions's topic in New England
Low of 39.4. Looks like 4 days of low 80's around this neck of the woods Saturday-Tuesday. -
Not sure. Thurmont and Westminster are wide open and mix well. I'm excited to see what data we get from there!
-

Spooky Season (October Disco Thread)
HoarfrostHubb replied to Prismshine Productions's topic in New England
I saw frost on some rooftops. -
That Clarksville site is a really good radiator. Wonder if the new Lisbon location will be similar.
-
 We are pleased to share with you the Seasonal Maryland Climate Bulletin for summer 2025, which includes sea surface temperatures for the Chesapeake Bay and the state's coastal waters. You can access it from the following link: https://mdsco.umd.edu/Bulletin/bulletin_mdsco_sum25.pdf Points to highlight are: 1) Summer 2025 was warmer and drier than normal (i.e., 1991-2020 averages) in Maryland, with colder and drier-than-normal conditions in August, warmer and wetter-than-normal conditions in July, and warmer and drier-than-normal conditions in June. 2) The mean temperature was warmer than normal throughout the state, especially in Garrett County (2.0−2.8°F), Somerset and Worcester counties (1.0‒1.4°F), and Washington County (1.0°F); minimum temperatures were also warmer than normal everywhere in the state, with maximum values in the previously cited counties, but maximum temperatures were split between warmer (central Piedmont to the west) and colder (Eastern Shore) anomalies. Precipitation was below normal over almost the entire state, particularly in Frederick, Carroll, and Montgomery counties (3.2−4.0 inches deficit), which received 20 to 32% less precipitation than their climatological seasonal precipitation. 3) The partial water year 2025 (October 2024 − August 2025), except for northwestern Garrett County, was below normal everywhere else in the state, notably over Frederick, Carroll, and Montgomery counties (7−10 inches deficit) and parts of Harford, Kent, and Queen Anne’s counties (7−9 inches deficit). The region over Frederick received 18−27% less than its climatological water amount, while the region over Harford received 18% less. 4) Statewide, mean temperature showed that summer 2025 was the seventeenth warmest summer since 1895, while the maximum temperature indicated that this was the thirty-eighth warmest summer. On the other hand, the statewide minimum temperature revealed that this was the seventh warmest summer on record. Seventeen counties reached minimum temperatures within the ten warmest on record, and three of them within the five warmest; among these, Garrett County set a record, Somerset had its fourth warmest summer, and Worcester had its fifth warmest. 5) Statewide precipitation indicated that summer 2025 was the fiftieth driest summer on record. No counties were closer to any record, but Frederick had its twenty-eighth driest summer, while Washington got its thirty-sixth driest summer on record. 6) Sea surface temperatures in the Chesapeake Bay in summer 2025 were below their 2007-2020 mean over the majority of the Bay from the Upper Basin (1.2°F below) and the Middle Basin (0.6°F), where the anomalies largely occupied the main steam of the Bay and rivers on the Eastern Shore, to the Lower Basin where the extent of anomalies on the main steam diminished from north to south until they were confined to the waters along the Eastern Shore and rivers reaching the waters of the Tangier and Pocomoke Sounds (0.2‒0.4°F below). The waters off Worcester County’s Chincoteague Bay were also colder than the mean (0.2‒0.4°F below). On the other hand, warmer anomalies than the 2007-2020 mean appeared along the western shore waters from the Back and Patapsco Rivers (0.8-1.2°F above) to the southern Calvert County coast, where they expanded to reach the Taylor and Hoopers Islands (0.2−0.4°F above). The current all-basin mean temperature of 79.2°F was slightly below the 19-year mean of the dataset (79.4°F) and far from the coldest summer temperature of 77.5°F, set in 2014, within the 19-year record (2007−2025). Please refer to the bulletin for more details, including the century-long trends and links of interest. The bulletins are issued to monitor the state's recent surface conditions in a simple format, allowing Marylanders to better understand regional climate variations. This bulletin is possible thanks to the hard work and data made available by our friends at NOAA National Centers for Environmental Information and the CoastWatch East Coast Node. Please help disseminate this bulletin. Thanks, Alfredo -- ............................................. Alfredo Ruiz-Barradas, PhD Associate Research Professor Maryland State ClimatologistDepartment of Atmospheric and Oceanic Science 3437 Atlantic Building, 4254 Stadium Dr.University of Maryland College Park, MD 20742-2425, USA Email: [email protected]
 -
The 72 is wrong. No model has temps that low for the weekend for NJ.
-
Still says 72 this morning with the update from the national weather service. 80 here though. Maybe a lake day.
-
Any thoughts?
-
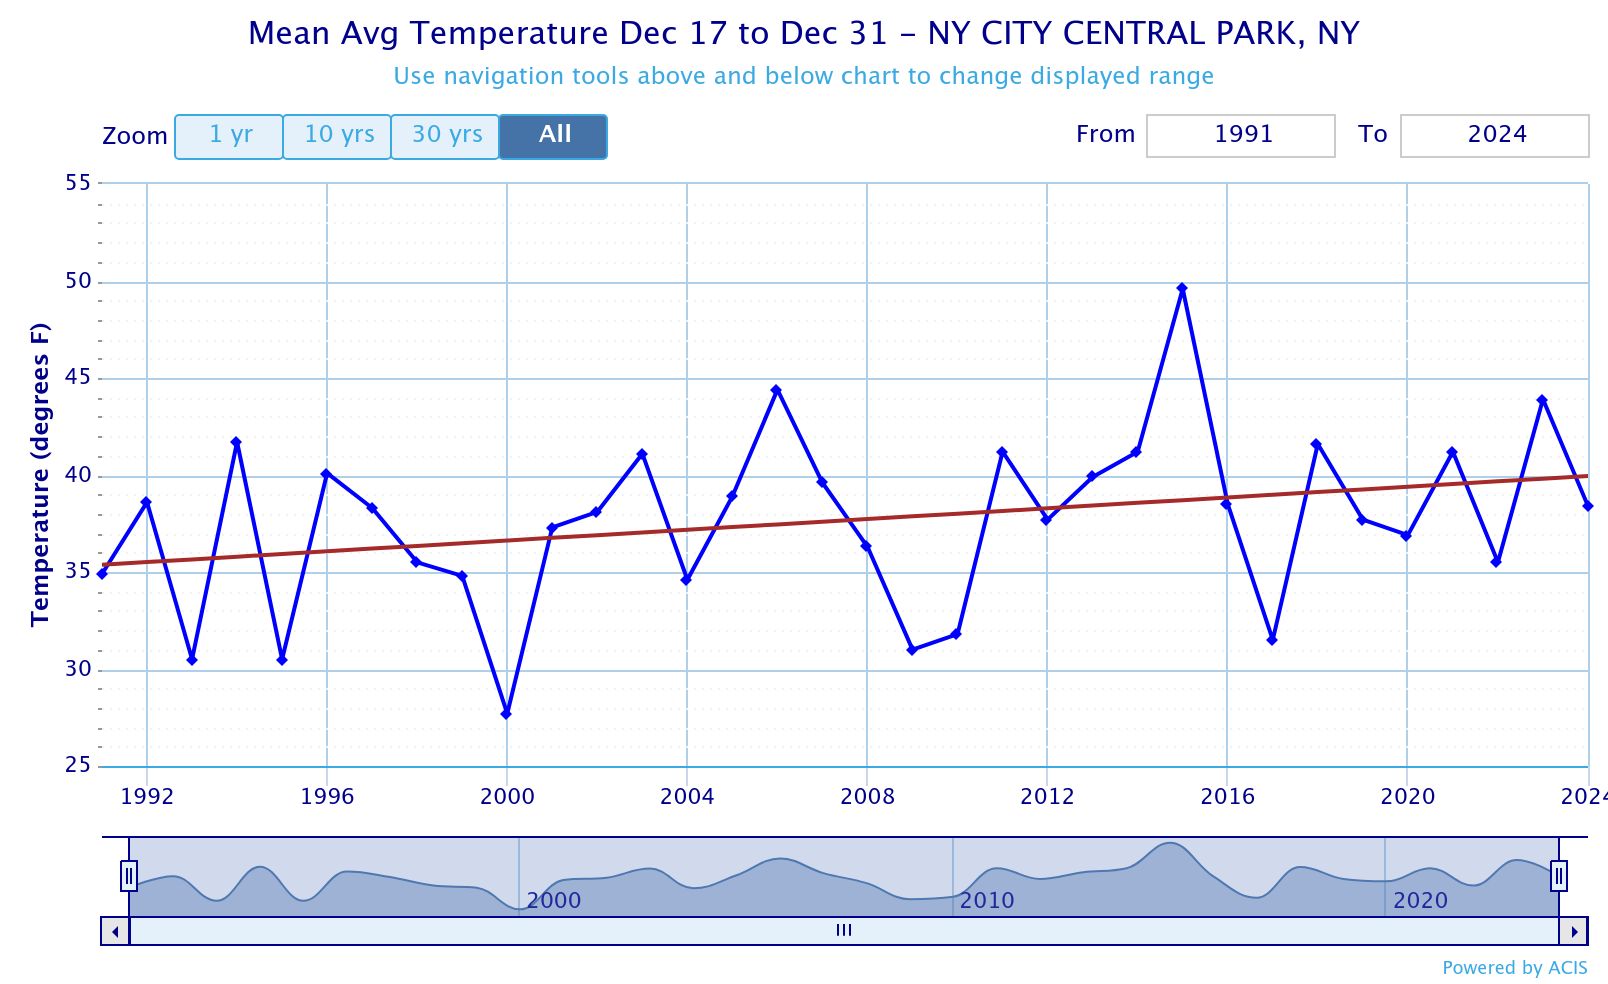
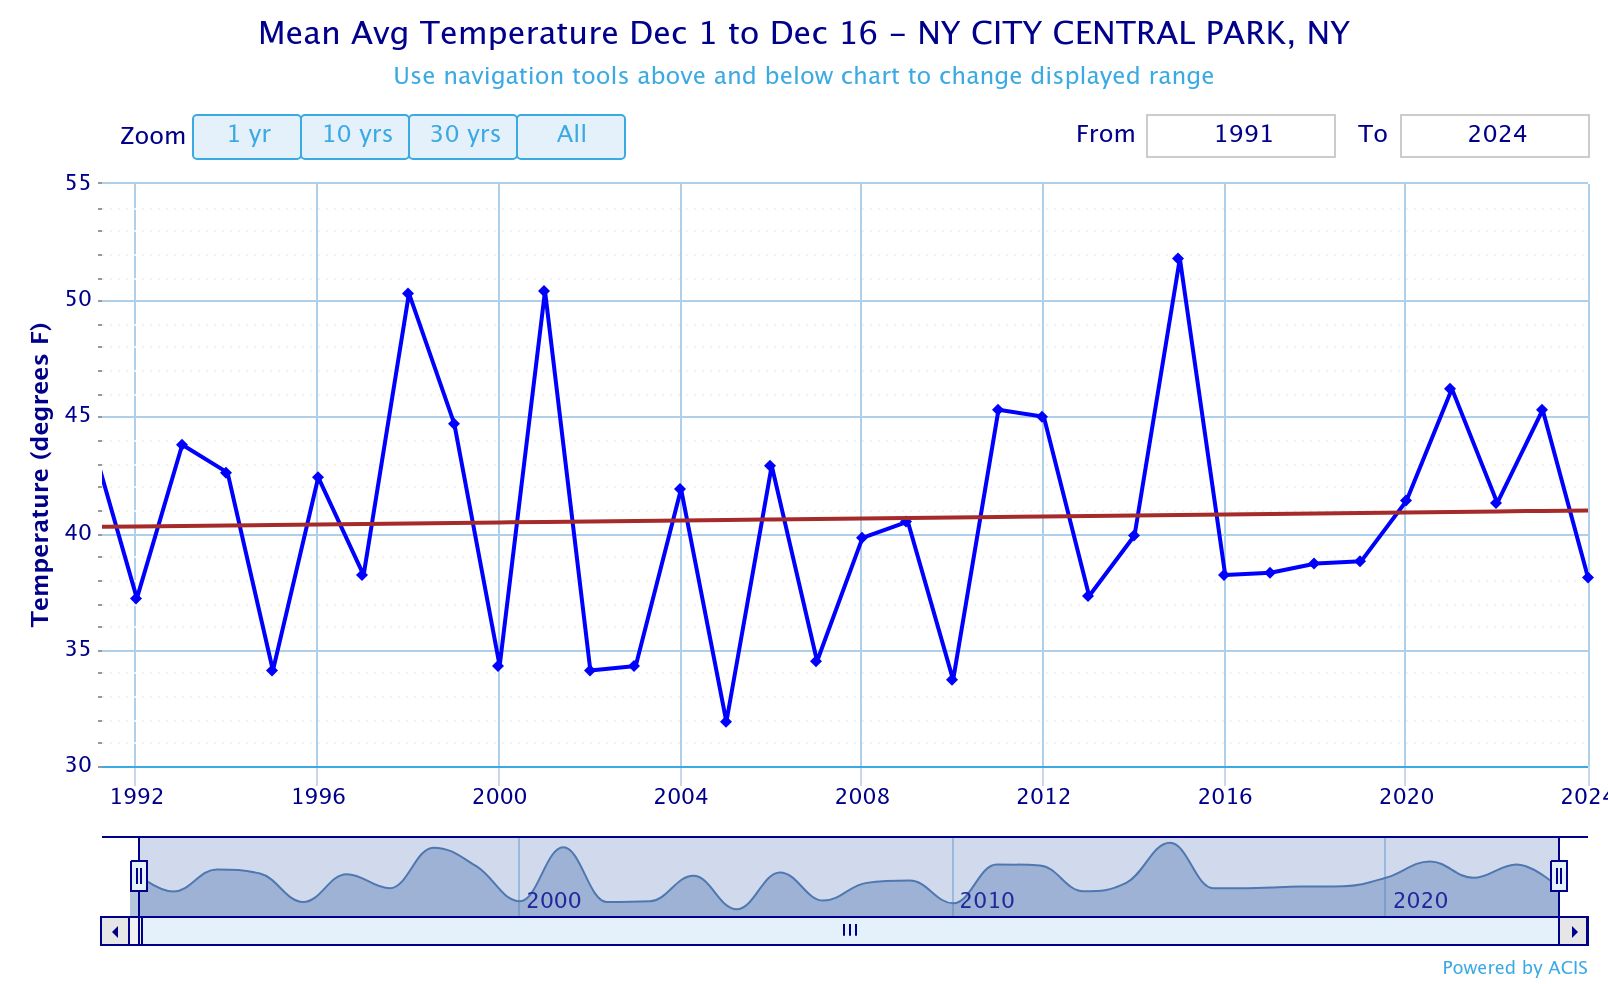
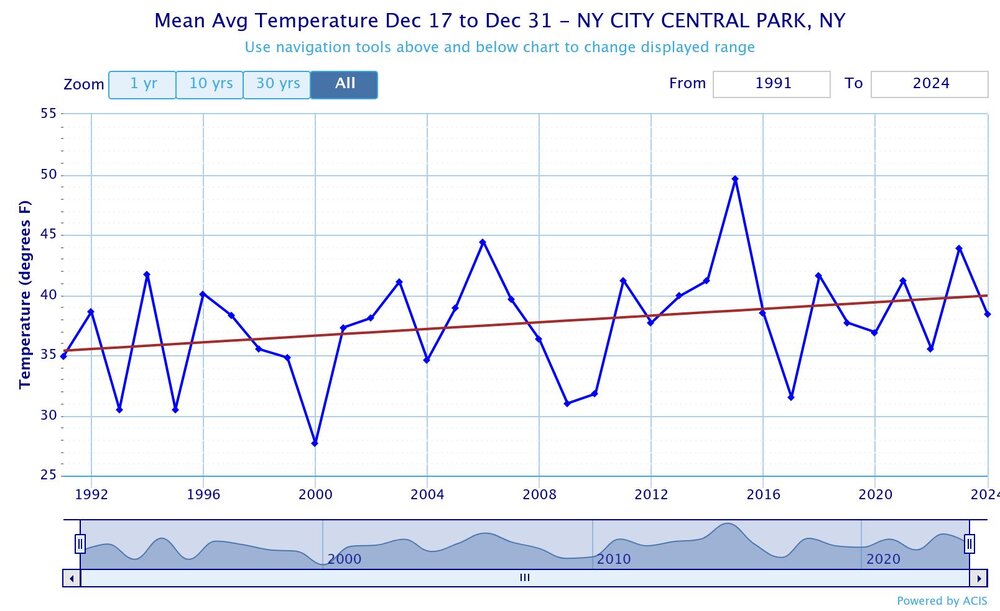
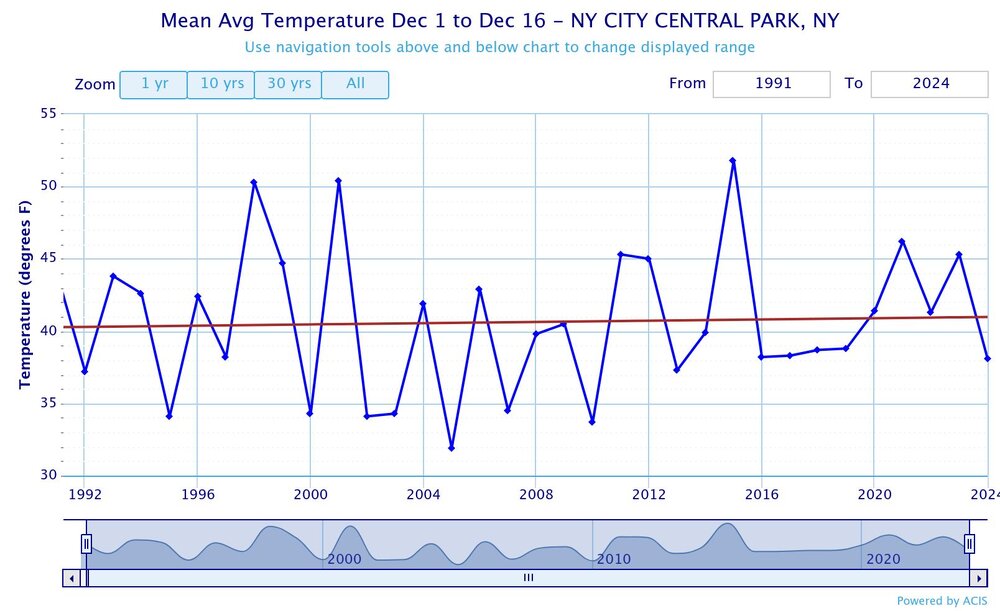
The change has been dramatic. During 1961-1990, the second half of December was 4.3 degrees colder than the first half in NYC. During 1991-2020, it was 3.0 degrees colder and since 2000, it is just 1.9 degrees colder during the second half of December.
-

Spooky Season (October Disco Thread)
Typhoon Tip replied to Prismshine Productions's topic in New England
yeah, this description ^ is more so here. I called it frost, but it wasn't the direct crystal condensation variety. The dew on the car tops froze aoa 36. No evidence of grass/ground coverage. Very marginal. So I guess this was the nadir, now we go hugely the other way. If the high really does anchor right on top like the guidance pin then the nights may decouple and favor cold in New England at nights relative to the total synoptics of the GL/OV/NE region. Big diurnals, with some weighting down of afternoon readings. -

2025-2026 ENSO
PhiEaglesfan712 replied to 40/70 Benchmark's topic in Weather Forecasting and Discussion
That is one that didn't really follow the early season la nina rule. We got the snowstorm on Dec 5, which would have normally meant a great snow year, but the season fell apart instead. The rest of the winter had very little snow, aside from the Feb 22 event, with January-April slightly above average temperature. -

Spooky Season (October Disco Thread)
dendrite replied to Prismshine Productions's topic in New England
37.0° with some frozen dew -
It has become one of our most persistent annual climate patterns. For some reason the late December temperatures have been warming faster than during early December. So even if the models early in December aren’t showing a big warm up closer to the Solstice, they always play catch up as the period gets closer.
-

Spooky Season (October Disco Thread)
Damage In Tolland replied to Prismshine Productions's topic in New England
All joking aside . I wonder who will hit 90? BDL, Norwood, MHT maybe? Someone will -

Central PA Fall Discussions and Obs
Mount Joy Snowman replied to ChescoWx's topic in Upstate New York/Pennsylvania
Low of 44. Love it. -
Spooky Season (October Disco Thread)
Typhoon Tip replied to Prismshine Productions's topic in New England
Oh, I see what's going on. It's the same modeling phenomenon I've been noticing happening during JJA/summers lately for that matter. Guidance et al have this tendency to anchor and stall the surface high pressure right on top of us. Meanwhile +2 or more sigma 500 mb ridges roll over the top... Getting a Bermuda surface ridging actually S of our latitude seems to be a difficult feat by modeling nowadays - at that charm to the climate change till I guess... But the idiosyncratic limitation on heat then kicks in because high right on top, stops proficient mixing. The models don't seem to like doing it from just diurnal overturning alone - they like to have some sort of WSW gradient actively doing the mixing for them. That's probably why we see all the current 80+F prognostic 2-meter temperatures stuck back in the Great Lakes. -
Records: Highs: EWR: 96 (2019) NYC: 93 (2019) LGA: 95 (2019) JFK: 95 (2019) Lows: EWR: 39 (1997) NYC: 39 *1886) LGA: 42 (2003) JFK: 43 (2009) Historical: 1858 A hurricane with category 1 winds hit San Diego, CA, the only documented hurricane to strike California in history. This occurred before official weather observations began. Winds of at least 75 mph were estimated based on damage and journalistic accounts. Extensive wind damage to property neared F2 tornado scale damage. Streets were swept clean by heavy rains. (Ref. Wilson Wx. History) 1867: A hurricane struck Galveston, TX with a storm surge that produced $1 million dollars damage. (Ref. AccWeather Weather History) 1882 - An early season windstorm over Oregon and northern California blew down thousands of trees and caused great crop damage in the Sacramento Valley. (David Ludlum) 1882:Louisiana was struck by major hurricane with winds reaching 100 mph and a 12-foot storm surge affecting the coast and bayous. 1,500 people were killed. (Ref. AccWeather Weather History) 1899: Earliest frost @ WBO 33° and 4 consecutive dates rec. 1st - 4th. (Ref. Washington Weather Records - KDCA) 1899: Boston, Massachusetts had a trace of snow today for the earliest recorded snow for the city. (Ref. NOAA Boston Weather Events) 1951: The center of a Tropical Storm crossed Florida from near Fort Myers to Vero Beach. Rainfall totals ranged from 8 to 13 inches along the track, but no strong winds occurred near the center. The strong winds of 50 to 60 mph were all in squalls along the lower east coast and Keys, causing minor property damage. The greatest damage was from rains that flooded farms and pasture lands over a broad belt extending from Naples, Fort Myers, and Punta Gorda on the west coast to Stuart, Fort Pierce, and Vero Beach on the east. Roadways damaged and several bridges washed out. (Ref. Wilson Wx. History) 1953: An unseasonable heat ridge brought record heat from the Plains to the Appalachians. Several locations reported their warmest October temperatures on record including: Evansville, IN: 94°, St. Louis, MO: 94° (later tied), Springfield, IL: 93° (later tied), Louisville, KY: 92° (later tied then broken), Platteville, WI: 91°, Mondovi, WI: 90° and Duluth, MN: 86°. (Ref. Additional Temperatures Listed On This Link) 1959 - A tornado struck the town of Ivy, VA (located near Charlottesville). Eleven persons were killed, including ten from one family. (The Weather Channel) 1963: Hurricane Flora moved across the south coast of Haiti and then meandered across eastern Cuba for the next 5 days, lashing the island with winds of 100 mph or more for at least 100 hours. Astronomical rainfall amounts as much as 90 inches were reported near Velasco. More rain was reported at Guantanamo Bay from Flora than was reported during the entire year of 1962. Flora remains the 2nd deadliest hurricane ever in the Atlantic, with over 7,000 deaths. (Ref. Wilson Wx. History) 1980: Several locations reported all-time October high temperature records including Palm Springs, CA: 116°, Borrego Springs, CA: 113 °F (This record was tied the next day), Yuma, AZ: 112°, Medford, OR: 99°, Eugene, OR: 94°, Blue Canyon, CA: 88° and Astoria, OR: 85°- since tied. (The Weather Channel) 1980 - The temperature at Blue Canyon, CA, soared to 88 degrees, an October record for that location. (The Weather Channel) 1981 - Severe thunderstorms raked Phoenix, AZ, with heavy rain, high winds, and hail up to an inch and a half in diameter, for the second day in a row. Thunderstorms on the 1st deluged Phoenix with .68 inch of rain in five minutes, equalling their all-time record. (The Weather Channel) 1987 - A fast moving cold front produced snow flurries from Minnesota to the Appalachian Mountains, and gale force winds behind the front ushered cold air into the Great Lakes Region. Valentine NE reported a record low of 25 degrees. Temperatures recovered rapidly in the Northern High Plains Region, reaching the lower 80s by afternoon. Jackson, WY, warmed from a morning low of 21 degrees to an afternoon high of 76 degrees. (The National Weather Summary) 1988 - Early morning thunderstorms in Georgia produced three inches of rain at Canton and Woodstock. (The National Weather Summary) 1989 - Flooding due to thunderstorm rains in the southeastern U.S. on the last day of September and the first day of October caused the Etowah River to rise seven feet above flood stage at Canton GA. Thunderstorms produced up to ten inches of rain in northeastern Georgia, with six inches reported at Athens GA in 24 hours. One man was killed, and another man was injured, when sucked by floodwaters into drainage lines. (The National Weather Summary) (Storm Data) 2000: Tremendous rains fell across South Florida due to a developing sub-tropical storm. Miami picked up 12.24 inches of rain in 24 hours and 15 inches in 2 days. The storm would go on to become Tropical Storm Leslie. 2003: Alaska: Temperatures around 70 °F in many Alaska communities set many all-time October maximum records by as much as 17 °F. In Chalkytsik, the high of 75 °F broke the old record by 16 F degrees. Other daily record highs included: Fort Yukon: 70°, Fairbanks: 70°, Homer: 60° and Bettles: 57 °F. (Ref. WxDoctor)
-
43f here
-

Central PA Fall Discussions and Obs
mahantango#1 replied to ChescoWx's topic in Upstate New York/Pennsylvania
um, Blizz has been mostly silent for a few months is revived with these cooler temps. This can only mean one thing. He sees opportunities for frozen precipitation in the near future, maybe another late October snowfall? -

Fall 2025 Medium/Long Range Discussion
WestMichigan replied to Chicago Storm's topic in Lakes/Ohio Valley
I can confirm it has been very dry. The rain last week helped a little and the pictures aren't quite that bad now, but it is heading back that direction as we get farther away from the rain last week. Looking forward to a change in the weather next week and hopefully some rain. -
What is up with the persistent torching during Christmas week? It's like the planet knows to mess with us during the worst possible time.
-
47 here, first 40s of the season
-
Berlin was 61° for a low. The lone station in the 60s. Clarksville was just one degree warmer than Bittinger.
-
We have been getting these consistent patterns of June into early August record heat. Then a cooldown later in August and sometimes in early September. Then record warmth from late September into sometimes early November like last year. This is why we haven’t had 100° heat after early August in 20 years and early September in over 30 years. The record early October mid 90s heat in 2019 was too late to reach 100°. But a month earlier we probably would have reached 100° if it was closer to Labor Day . Almost like the pattern every year now of 55+ warmth from December 17th to the 25th. These patterns have been very persistent.