All Activity
- Past hour
-

2025-2026 ENSO
40/70 Benchmark replied to 40/70 Benchmark's topic in Weather Forecasting and Discussion
Yea, I wanted to use it in my blog update last week....sucks. -

Texas 2025 Discussion/Observations
Stx_Thunder replied to Stx_Thunder's topic in Central/Western States
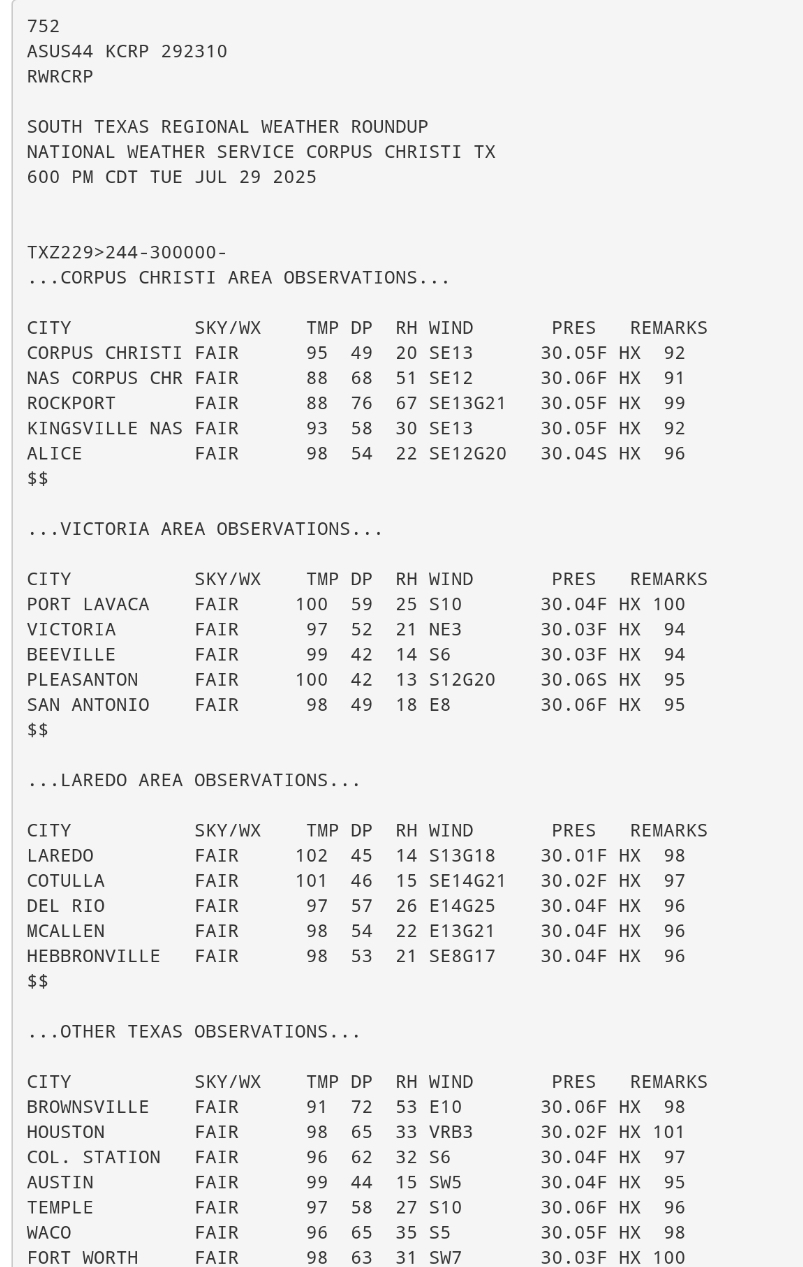
On another note, sfc dew points and humidity values were majorly below normal this time of year in the coastal bend, early evening Tuesday. CRP dew point bottomed out at 49 F with just 20% humidity value in the early evening. Well below the normal 70+ F dew point throughout the entire summer (day & night).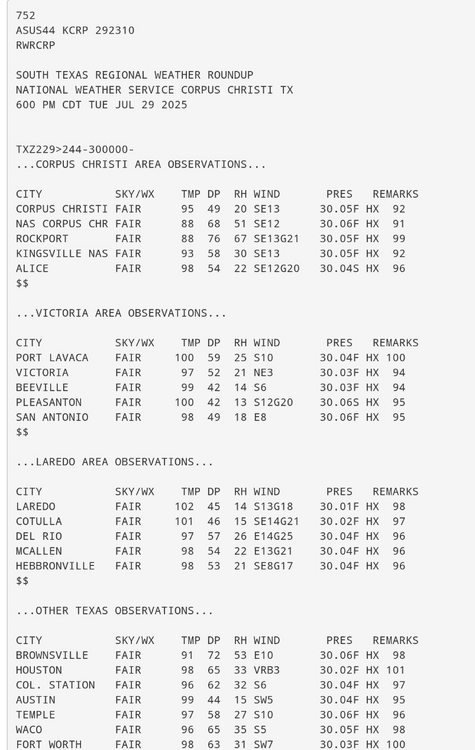
-

July 2025 Obs/Disco ... possible historic month for heat
Modfan2 replied to Typhoon Tip's topic in New England
Some models showing heaviest precip west of CRV towards NYS; let’s see how that plays out -
July 2025 Obs/Disco ... possible historic month for heat
jbenedet replied to Typhoon Tip's topic in New England
Moderate+ Drought is again a real problem for a chunk of us. Really hoping Thursday drying trend on guidance flips today. Could really use an 1”+ from that here -

July 2025 Obs/Disco ... possible historic month for heat
BrianW replied to Typhoon Tip's topic in New England
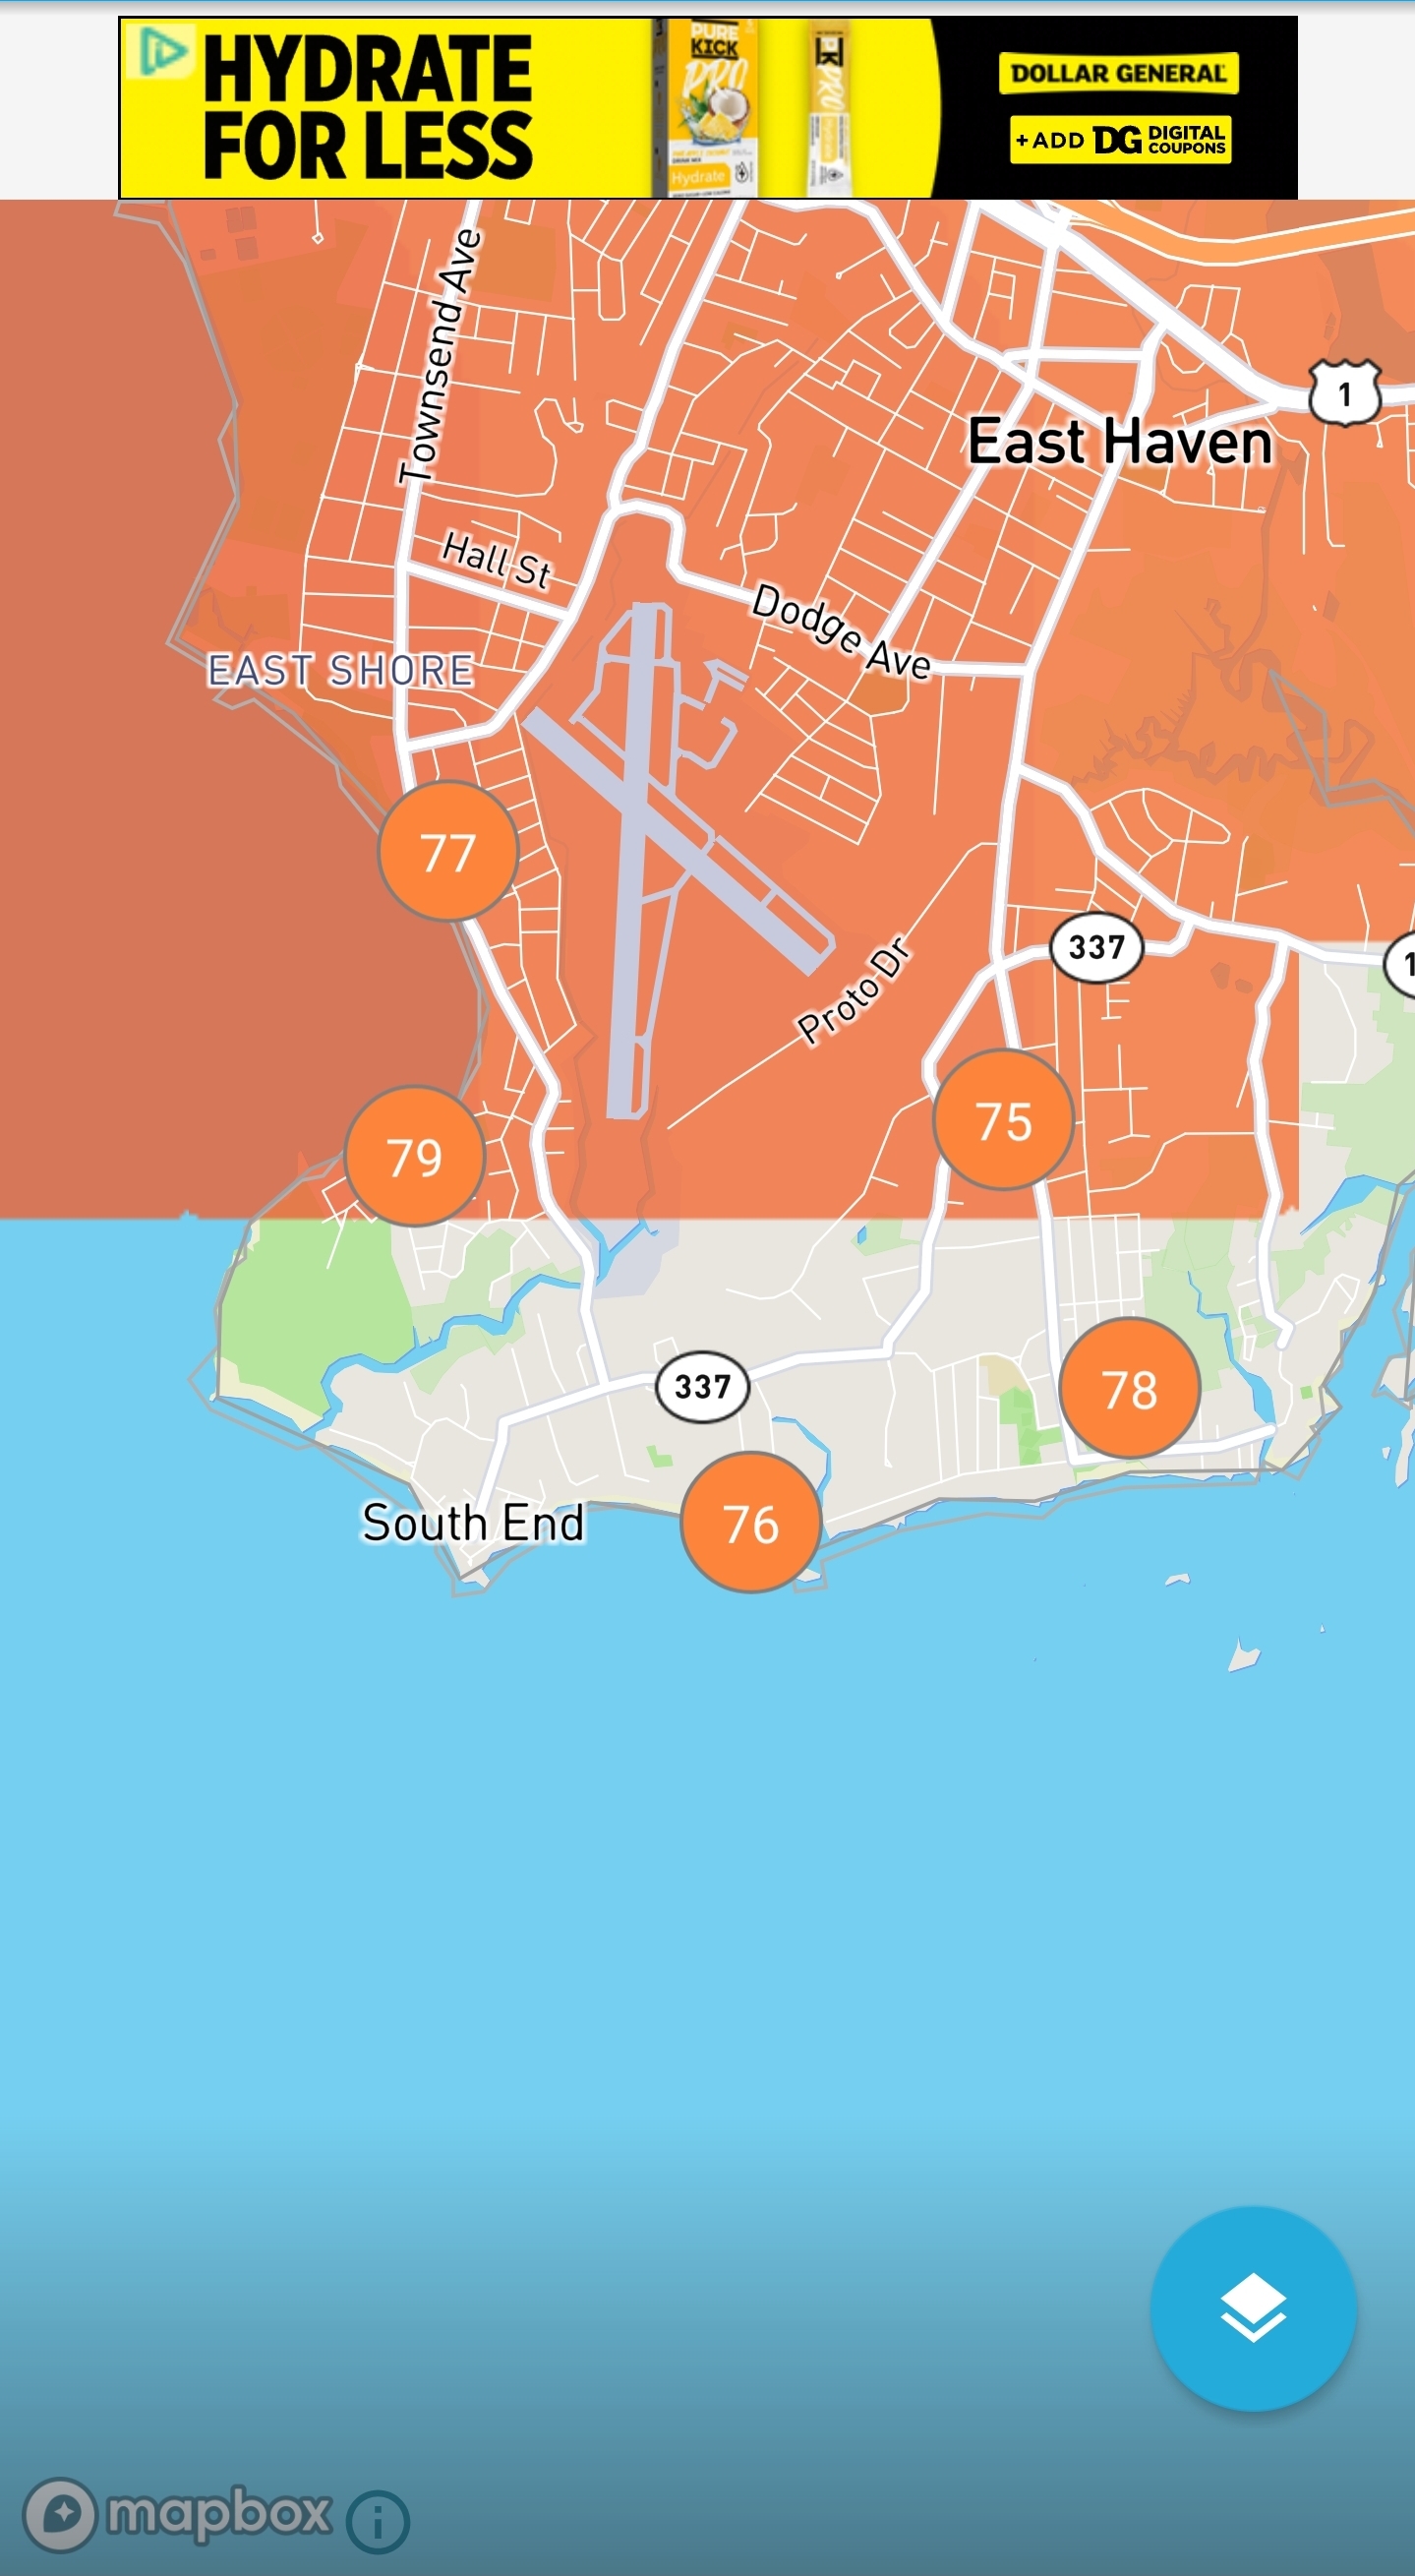
76 BDR and HVN for lows. Already up to 79 at HVN.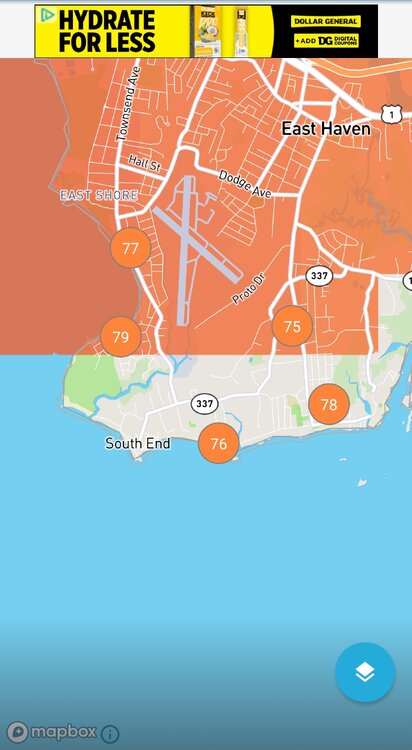
-
.thumb.png.4150b06c63a21f61052e47a612bf1818.png)
July 2025 Obs/Disco ... possible historic month for heat
HIPPYVALLEY replied to Typhoon Tip's topic in New England
Low of 65° here. The clear nights have helped us radiate a little. Clear skies and I only saw two meteors last night so that was disappointing. -

Central PA Summer 2025
Mount Joy Snowman replied to Voyager's topic in Upstate New York/Pennsylvania
So it appears the Hawaii warnings were downgraded and minimal damage reported. Good news. Tomorrow’s dew points look like they could be the worst of the week, with relief not arriving until the overnight hours. We’ll see what tricks the storms pull. -

July 2025 Discussion-OBS - seasonable summer variability
bluewave replied to wdrag's topic in New York City Metro
Corona and Brownsville maxed out at 103°. 13th St./16th / Alphabet City 100 82 90 104 88 78 33 0.00 14 3:00pm 6 3:55pm 24.6 160 Ave. / Howard Beach 92 76 84 105 76 95 55 0.00 28th St. / Chelsea 100 81 89 104 86 82 34 0.00 13 4:05pm 6 4:05pm 23.9 Astoria 100 79 90 105 79 85 32 0.00 10 6:30pm 3 6:40pm 20.7 Bensonhurst / Mapleton 97 79 88 106 79 87 42 0.00 23.9 Bronx Mesonet 99 77 88 101 77 84 32 0.00 15 2:35pm 8 12:00am 23.7 Brooklyn Mesonet 95 78 86 100 78 86 39 0.00 23 6:30pm 16 6:30pm 26.2 Brownsville 103 80 89 105 80 82 31 0.00 Corona 103 80 90 109 80 83 30 0.00 E 40th St. / Murray Hill 99 80 90 103 85 82 35 0.00 East River at Alphabet City Fresh Kills 11:10am 11:10am 6.7 Glendale / Maspeth 100 80 90 105 80 82 34 0.00 Gold Street / Navy Yard 99 80 89 104 80 83 34 0.00 16 5:30pm 6 3:15pm 25.4 Lefferts / South Ozone Park 96 77 86 107 77 89 47 0.00 Manhattan Mesonet 96 79 88 100 79 80 36 0.00 15 2:00pm 9 2:00pm 26.2 Newtown / Long Island City 100 82 90 104 87 77 32 0.00 14 5:45pm 8 4:55pm 25.2 Queens Mesonet 96 78 86 101 78 84 38 0.00 24 5:25pm 17 6:00pm 24.1 Queensbridge / Dutch Kills 102 82 91 105 88 77 32 0.00 22.8 Staten Island Mesonet 98 74 87 101 74 95 33 0.00 16 2:15pm 10 -

July 2025 Obs/Disco ... possible historic month for heat
dendrite replied to Typhoon Tip's topic in New England
62.8° Another comfy morning sandwiched around big daytime heat. Like the days of yore. -

July 2025 Obs/Disco ... possible historic month for heat
kdxken replied to Typhoon Tip's topic in New England
70° / 66° -

Chester County PA - Analytical Battle of Actual vs. Altered Climate Data
chubbs replied to ChescoWx's topic in Climate Change
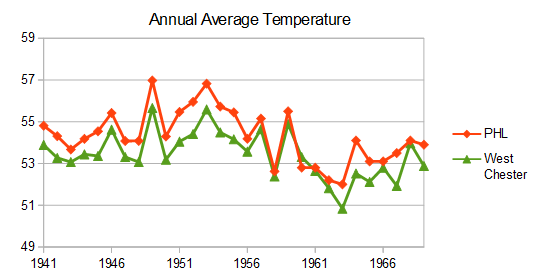
The big difference between the Phila Airport and the Chesco station average occurred in the 1945-1970 period. That's when the Chesco station average cooled significantly relative to other regional stations. Before 1945, Chesco COOPs were as warm as the Philly Airport or the Newark DE Ag station. By 1970, Chesco COOPS were as cool as Allentown. The cooling was mainly due to station moves: Coatesville 1946/47, Phoenixville 1948 and West Chester 1970. A reverse heat island effect for Coatesville and West Chester. Meanwhile the Phila Airport tracked other regional stations and West Chester before the 1970 West Chester move. The raw data is very clear. The Phila Airport is a much more consistent source of climate data than the Chesco COOPs. PHL's consistency advantage grows when non-COOP data is added making the Chesco data even more inconsistent.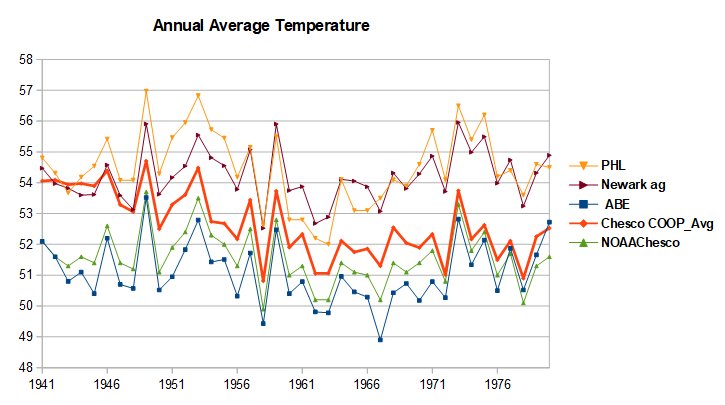
-
Another note on the warmth: today will be the 22nd day with a low of 70 or above. That is the most ever through the end of July, 12th most in an entire summer, and the most in an entire summer at the airport site with still the entirety of August to go. All of the other years with this many 70+ lows occurred with observations taken downtown.
-

July 2025 Discussion-OBS - seasonable summer variability
wdrag replied to wdrag's topic in New York City Metro
IF NWS issues a flood watch, will start a thread. Its marginal right now but I expect more or less what WPC has posted this morning with isolated max rainfall of 6". No thread at this time. - Today
-
July 2025 Obs/Disco ... possible historic month for heat
kdxken replied to Typhoon Tip's topic in New England
. QPF box-and-whisker diagrams from the 00z LREF, which utilize the coarser-res ensembles (EPS/GEPS/GEFS) and not the finer- scale guidance which we`re not yet in the forecast horizon to see their output as yet, shows QPF values around 1-1.5" in the 50th percentile at sites like Hartford and at Providence, but show values potentially reaching up to 3". Pretty good signal for steadier soaking rains, supported by the ECMWF EFI/Shift-of-Tails guidance which also offers potential for an anomalous rain The ol' box-and-whisper and Shift-of-Tails. I check them every morning... -
Texas 2025 Discussion/Observations
Stx_Thunder replied to Stx_Thunder's topic in Central/Western States
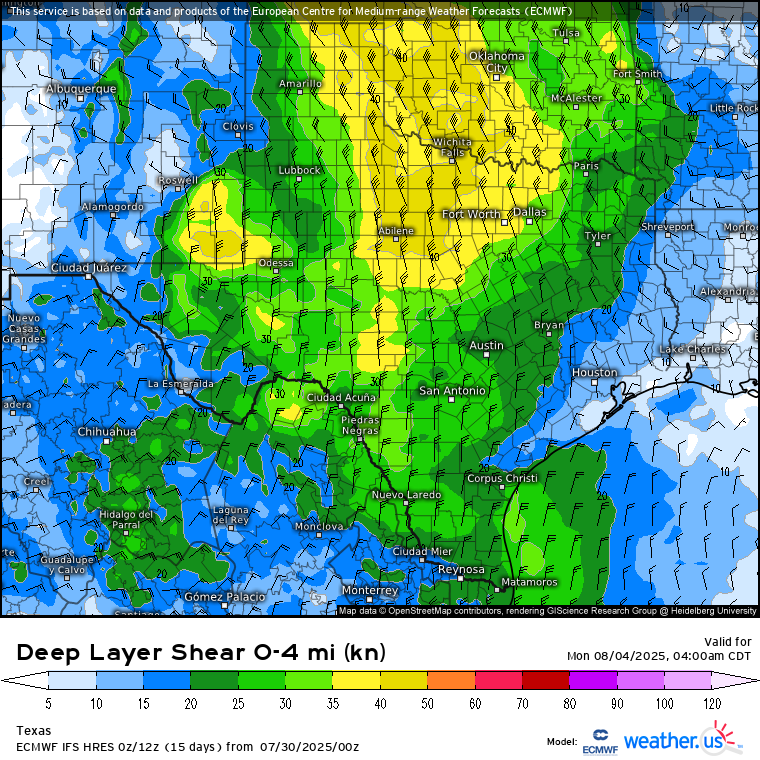
'Rest of Summer 2025 is looking good for less TX insane heat, and more convective action. Ensembles have been pretty consistent in forecasting fleeting (rather than dominant) subtropical ridging since the season began. And I don't see any reason this will change much, or to disagree with CPC's monthly outlook for August with equal chances on temps and precip in the state (instead of just outright throwing in above normal probability temp shades as usual). This weekend, and possibly even later next week or weekend is looking a bit convectively interesting with a non-tropical mid-upper level pattern developing as the flow turns North across most, if not all the central and eastern half of state due to the typical mid-upper High moving off to the west. And troughing digging further south through the Plains than usual this time of year. Which will likely push a front into the state this weekend. The AO edging into the negative phase in the coming days also supports this (as I've seen in past years). Both Euro & GFS are even starting to hone in on modest DL shear getting deeper into the state as well in more recent runs. So stronger storms are not out of the question. Especially with a +PNA phase already in place. Only real caveat this weekend looks to be mostly meager mid-level lapse rates around 6 (except maybe NTX). Next weekend is looking steeper further south.
-
July 2025 Obs/Disco ... possible historic month for heat
dendrite replied to Typhoon Tip's topic in New England
Looks like we got our usual tsunameh -

July 2025 Discussion-OBS - seasonable summer variability
dmillz25 replied to wdrag's topic in New York City Metro
Wasn’t expecting yesterday to be the third 100 degree day of the year for me. Crazy -
Greensboro's all time record max min is likely to be set for a single month, the lowest it has dropped was 68 degrees which would beat the old record of 67 set in 2016 and 2015 (July as well). We are only +2 on the month, I think that the lack of a break from the heat/humidity is what has made this July feel worse than the last few.
-
 I am a little surprised the tsunami waves are so small given the size of the quake and the shallow depth.
 -
81/76 at 3am at DCA... heat index near 90. The cool down cannot come fast enough.
-
If you were fat like me you wouldn't be excited about it
-
0Z UKMET fwiw has TCG/a TD at 168 in the far NW Bahamas: NEW TROPICAL CYCLONE FORECAST TO DEVELOP AFTER 168 HOURS FORECAST POSITION AT T+168 : 26.9N 78.3W LEAD CENTRAL MAXIMUM WIND VERIFYING TIME TIME POSITION PRESSURE (MB) SPEED (KNOTS) -------------- ---- -------- ------------- ------------- 0000UTC 06.08.2025 168 26.9N 78.3W 1014 27 ———— I’m getting slightly concerned with this as it’s coming from a currently active AEW that’s now in the E ATL based on what I’m seeing on the 0Z and earlier runs of the UKMET. The 0Z has this AEW move to the N Leewards vicinity at 96 and then form the TD at 168 in the far NW Bahamas. It is then recurving NNW around a strengthening Bermuda high and threatening the SE US mid to late next week with no sharp upper trough to allow a sharp enough recurve to protect the coast. I looked back and found a WNW moving distinct disturbance from this same E ATL AEW as far back as the 0Z 7/27 UKMET run.
-

July 2025 Obs/Disco ... possible historic month for heat
Snowedin replied to Typhoon Tip's topic in New England
Took this quick little shot driving through 3d cliff earlier. Talk about an intense surge of heat all around today, absolutely cranking! Love the sounds of all the crickets, frogs and little chippies scurrying about at this time. It’s like a mini tropical oasis out there, ya love to see it!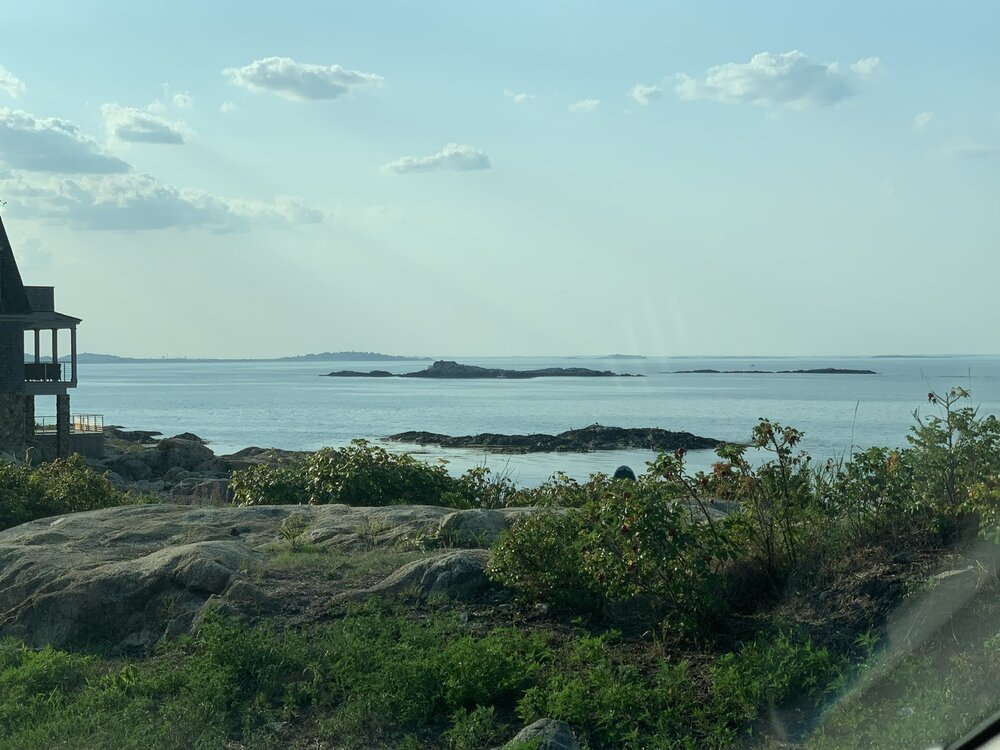
-
 Parts of CA coast added to warning area WEAK51 PAAQ 300327 TSUAK1 BULLETIN Public Tsunami Message Number 5 NWS National Tsunami Warning Center Palmer AK 827 PM PDT Tue Jul 29 2025 UPDATES ------- * Revised alert areas ...THE TSUNAMI WARNING REMAINS IN EFFECT... ...THE TSUNAMI ADVISORY REMAINS IN EFFECT... Tsunami Warning in Effect for; * CALIFORNIA, The coast from Cape Mendocino, California to The Oregon/Cal. Border * ALEUTIAN ISLANDS, Samalga Pass, Alaska (30 miles SW of Nikolski) to Attu, Alaska including the Pribilof Islands Tsunami Advisory in Effect for; * CALIFORNIA, The coast from The Cal./Mexico Border to Cape Mendocino, California including San Francisco Bay * OREGON, The coast from The Oregon/Cal. Border to The Oregon/Wash. Border including the Columbia River estuary coast * WASHINGTON, Outer coast from the Oregon/Washington border to Slip Point, Columbia River estuary coast, and the Juan de Fuca Strait coast * BRITISH COLUMBIA, The north coast and Haida Gwaii, the central coast and northeast Vancouver Island, the outer west coast of Vancouver Island, the Juan de Fuca Strait coast * SOUTH ALASKA AND THE ALASKA PENINSULA, Pacific coasts from Chignik Bay, Alaska to Unimak Pass, Alaska (80 miles NE of Unalaska) * ALEUTIAN ISLANDS, Unimak Pass, Alaska (80 miles NE of Unalaska) to Samalga Pass, Alaska (30 miles SW of Nikolski) For other US and Canadian Pacific coasts in North America, there is no tsunami threat. FORECASTS OF TSUNAMI ACTIVITY ----------------------------- * A tsunami has been generated. The first waves are forecasted to arrive at the following locations and specified times. * Forecast tsunami duration is the approximate length of time which the tsunami may produce dangerous currents and waves. * Forecast max tsunami height is the highest expected water level above the tide. * Forecasts are not provided for sites which have been impacted more than an hour prior to the time of this message. FORECAST FORECAST FORECAST START TSUNAMI MAX TSUNAMI SITE OF TSUNAMI DURATION HEIGHT ---- ---------- -------- ------------- * Alaska Saint Paul 1855 AKDT Jul 29 less than 1ft * British Columbia Langara 2205 PDT Jul 29 less than 1ft Tofino 2330 PDT Jul 29 less than 1ft * Oregon Port Orford 2335 PDT Jul 29 15 hrs 0.9- 1.7 ft Charleston 2345 PDT Jul 29 less than 1ft Brookings 2350 PDT Jul 29 9 hrs 0.8- 1.4 ft Seaside 2355 PDT Jul 29 Newport 2355 PDT Jul 29 * Washington La Push 2335 PDT Jul 29 Neah Bay 2340 PDT Jul 29 less than 1ft Long Beach 2345 PDT Jul 29 less than 1ft Westport 2350 PDT Jul 29 less than 1ft Moclips 2350 PDT Jul 29 less than 1ft Port Angeles 0015 PDT Jul 30 less than 1ft Port Townsend 0045 PDT Jul 30 less than 1ft Bellingham 0110 PDT Jul 30 less than 1ft Tacoma 0200 PDT Jul 30 * California Fort Bragg 2350 PDT Jul 29 9 hrs 0.7- 1.3 ft Crescent City 2350 PDT Jul 29 30 hrs 2.6- 4.8 ft Monterey 0015 PDT Jul 30 less than 1ft Port San Luis 0035 PDT Jul 30 24 hrs 2.0- 3.7 ft San Francisco 0040 PDT Jul 30 less than 1ft Santa Barbara 0045 PDT Jul 30 less than 1ft Los Angeles Harb 0100 PDT Jul 30 less than 1ft Newport Beach 0110 PDT Jul 30 less than 1ft La Jolla 0110 PDT Jul 30 less than 1ft Oceanside 0115 PDT Jul 30 less than 1ft OBSERVATIONS OF TSUNAMI ACTIVITY - UPDATED ------------------------------------------ * Observed max tsunami height is the highest recorded water level above the tide level up to the time of this message. TIME OBSERVED MAX SITE OF MEASUREMENT TSUNAMI HEIGHT ---------------------------- ---------------- -------------- Amchitka Alaska 0.8ft Adak Alaska 0.9ft Kushiro Japan 1.1ft Abashiri Japan 0.7ft Hanasaki Japan 1.1ft Nikolskoe Russia 1714 PDT Jul 29 0.2ft PRELIMINARY EARTHQUAKE PARAMETERS --------------------------------- * Magnitude 8.8 * Origin Time 1525 AKDT Jul 29 2025 1625 PDT Jul 29 2025 2325 UTC Jul 29 2025 * Coordinates 52.2 North 160.0 East * Depth 46 miles * Location 315 miles SW of Bering I., Komandorski 80 miles SE of Petropavlovsk, Kamchatka RECOMMENDED ACTIONS ------------------- * See message number 4 for recommended actions. IMPACTS ------- * See message number 4 for possible impacts. ADDITIONAL INFORMATION AND NEXT UPDATE -------------------------------------- * Refer to the internet site tsunami.gov for more information. * Pacific coastal residents outside California, Oregon, Washington, British Columbia and Alaska should refer to the Pacific Tsunami Warning Center messages at tsunami.gov. * This message will be updated within 60 minutes. $$
 -

July 2025 Discussion-OBS - seasonable summer variability
SACRUS replied to wdrag's topic in New York City Metro
Dew point temps up to low 70s here from 68