All Activity
- Past hour
-
Hey Don, Thanks for clarifying. The 1+2 anomalies are found at this ERSST monthlies link that has the four Nino anomalies (warning: these are all based on 1991-2020 anomalies rather than being based on moving base periods): https://www.cpc.ncep.noaa.gov/data/indices/ersst5.nino.mth.91-20.ascii
-

November 2025 general discussions and probable topic derailings ...
WinterWolf replied to Typhoon Tip's topic in New England
Correct. He’s looking for METS to chime in, and soothe his anxiety. Stepping down nicely this autumn imo. -
Yeah, this is looking quite interesting still. There are still some disagreements on the synoptic setup, the GFS is a bit more progressive and would maybe limit the high-end potential, though the Euro and Canadian are more amplified and bring the core of the 500mb cold pool over or near Lake Erie Monday into Monday night...which could allow for a very fun event. It seems like lake enhanced/effect precip ramps up Sunday evening as we get into cold advection behind the departing low pressure. The flow will be northerly at this point, with some sort of Lake Huron enhanced band likely taking shape west of Cleveland initially. There could also be some disorganized showers/upslope into the higher terrain of the snowbelt. Instability isn't anything too extreme at first and the deeper cold air doesn't arrive until overnight, so accumulations may be marginal through Sunday evening. Activity should get more intense and accumulate more efficiently, even close to the lake, overnight into Monday morning. There's good agreement that the broad cyclonic flow will persist but gradually back to a more westerly direction Monday through Tuesday. It will be northwest on Monday, more west-northwest Monday night, and probably more west or even west-southwest on Tuesday. This will likely pivot any Lake Huron band east across the Cleveland metro and secondary snowbelt during the day Monday and into the primary snowbelt by Monday night, with perhaps a W-E band flaring up Monday night into Tuesday east of Cleveland while the Lake Huron band pivots east across Ashtabula County and Northwest PA. The global models don't have the resolution to resolve such features, but they seem to be hinting at some strong shoreline convergence or perhaps a mesolow of sorts evolving near or just offshore of Cleveland on Monday, which could be intriguing. Where the uncertainty lies is in mesoscale details, such as where upstream connections set-up, how our shoreline convergence behaves, and if a mesolow forms on Lake Erie. That will heavily dictate how organized any banding is and where it develops. With the flow slowly shifting from NNW to W or even WSW through the event, it has the potential to really spread the wealth. The potential exists for extreme instability, with fairly good synoptic moisture and support, especially if the trough is on the deeper side like the Canadian or Euro, which could allow for very impressive snow rates and double digit totals...the GFS would be ok, but it's not quite as good. Temperatures will be somewhat marginal, but by overnight Sunday night and through Tuesday morning should be cold enough that organized bands will be intense and able to accumulate. The higher terrain inland will accumulate more readily, but under good bands it should accumulate close to the lake. Should be a fun event to track! I'll actually be down in Athens Friday and Saturday so won't be forecasting this in an official capacity, but I'll be back in town before the event starts and may actually get some snow at my house!
-
November 2025 general discussions and probable topic derailings ...
WinterWolf replied to Typhoon Tip's topic in New England
3 weeks out bro…slow your roll. You do this every single season. -

Overnight Wednesday, November 5, 2025 Wind Event
Typhoon Tip replied to weatherwiz's topic in New England
what do we mean by llj in this case? i may not be understanding where that was seen. i never bought into the llj idea, as i think of that as a compression jet out ahead a baroclinic axis where 900 mb fire hose is going on. if so, that is not typically found in flat progressive wave types, skirting along a straight w-e or wnw-ese deep layer motion. that may be more of cyclone climatology argument but clippers/quasi-clippers don't typically do that. if this had, this would have been unusual. unusual things do take place from time to time so in that sense ... couldn't ignore it entirely, no. however, seeing it not happen? heh - but synoptically, any wind as i saw it in the modeling from 2 days ago ... was more likely going to come from a jolt isallobaric acceleration as the low was leaving, then seamlessly that pulsed acceleration becomes a few hours of caa instability related momentum gusts. (isallobaric acceleration is due to excessive deepening rates exceeding Coriolis and the wind goes across the isobars instead of flowing quasi-parallel - the response can be so overwhelming that it's like a p-wave off a bomb blast with low lvl wind fields, even calm scenarios, abruptly finding itself in damaging whiplash gusting in some extreme cases) two days ago this had some semblances of that effect. not hugely obvious, but when combining that with modeled lapses rates at the time, and also, a low modeled down to sub 980 mb ...the rest became choosing the model that was the most dystopian d-drip extreme lol . seriously though it should be noted, the nam never really had big wind beginning ~ two day ago. the other aspect is the model magnification syndrome. ha. just mean that tendency to de-amplify just about everything the models actually model, when they bring events inside of 72 hours. we've discussed this ad naseam. this overall system evolution has really bit some forecasting ass with that. that dependable error correction ( greater amplitude to less amplitudes at irregular percentage headaches) is puzzling. i've wondered if perhaps there a a physical flaw in the model construction, one possibly being exposed by cc. i've wondered if there is a natural, unavoidable tendency for that system to 'glow' prominently out in time, and then the emergence of countless corrosive factors - those that cannot be seen - occur along the way and gnaw system in question. i've even wondered if the engineers were mandated to do this on purpose- because it could actually serve a purpose in ferreting out the more important events that might otherwise be buried in chaos out in time. we can sci-fi this for ever. probably something like that middle reason... either way, something like 10 to 40% of any 'storm' is pretty much eaten away in some kind of entropic tax as the late mid range comes into near terms. this system clearly fell victim to that. -
 I appreciate your post, Coach and understand your reaction A-L-E-K ……. I however, in reflection, enjoy the G T’s. Stay well, as always ….
-
Placeholder for now. BWI: 9.8” DCA: 6.4” IAD: 11.3” RIC: 5.1” SBY: 7.8”
-
Overnight Wednesday, November 5, 2025 Wind Event
WinterWolf replied to weatherwiz's topic in New England
Honest question here…it seems like when the Euro used to be able to crush it, it would have known this was gonna be weaker at two days out? Now, no model seems to be able to sniff this stuff out even at 36-48 hrs? This is where it honestly seems the modeling has trended in the wrong direction? And I know the NAM showed it weak, but the NAM is all over the map…it found a nut this time, as it will rarely do from time to time. So that doesn’t really say much. -

2025-2026 ENSO
donsutherland1 replied to 40/70 Benchmark's topic in Weather Forecasting and Discussion
GaWx, Thanks. It looks like I messed up my pre-1980 values on the spreadsheet. By any chance, do you have a link to the monthly Region 1+2 anomalies. I can't find it on the moved ENSO page. -
@Bluewave
-
Records: Highs: EWR: 83 (2024) NYC: 80 (1948/2024) LGA: 81 (2024) old 75 (2022) JFK: 75 (2015 / 2024) Lows: EWR: 27 (2012) NYC: 27 (1879) LGA: 30 (1951) JFK: 30 (1952) Historical: 1880: A Great Lakes gale wrecked or disabled a score of ships on Lake Ontario, including the “Belle Sheridan”, a collier just 10 miles from Toronto. Only one of seven crew members survived. (Ref. Wilson Weather History) 1951 - Snow fell from the Texas panhandle to the Lower Great Lakes, leaving record totals of 12.5 inches at Saint Louis MO, and 14.1 inches at Springfield MO. Other heavier snowfall totals included 20 inches at Nevada MO, 13.5 inches at Sedan KS, 13 inches at Decature IL, and 10 inches at Alva OK. In the Saint Louis area, up to 20 inches was reported in Washington County. (5th- 6th) (David Ludlum) (The Weather Channel) 1953: A tropical depression moved east from the central Gulf of Mexico and across Florida on November 5th, accompanied by heavy rain and 30 to 40 mph winds. As it reached the Atlantic Coast and passed over the Gulf stream it rapidly intensified. At the same time, an unusual cold outbreak was developing in the Midwest and Northeast. As the storm intensified it turned sharply to the north and moisture from the storm was thrown back into the cold air mass, creating a band of snow that develop from North Carolina to New York. Snow began in Washington, DC in the early-morning hours of the 6th. A tight pressure gradient set up between the strong ocean storm and the cold high-pressure system to the north causing winds in Washington, DC of 30 mph. Old Kings Highway in Alex., Virginia was blocked by a large drifts and the total snowfall at National Airport was recorded at 6.7 inches. This is one of Washington's biggest early season snow falls, not far behind the Veteran's Day snowstorm of November 11, 1987, which piled up 11 inches in Washington. (p. 65 Washington Weather Book 2002 by Ambrose, Henry, Weiss) Other snowfall totals included 11 inches at Harrisburg, PA, 8.8 inches at Philadelphia, PA (their earliest snowstorm of 4 or more inches), 9 inches at Takoma Park, MD and 3 inches at Richmond, VA. (Ref. Wilson Weather History) 1953: 6.5 ins. snow at DCA and 27 mph north wind and 9.0 inches of snow was measured in Takoma Park, MD. (Washington Weather Records - KDCA) (Ref. AccWeather Weather History) Boston, Massachusetts had a severe northeast coastal storm with great coastal damage from wind and heavy rain. (Ref. NOAA Boston Weather Events) 1961: Santa Ana winds in southern California downed trees, utility lines and blew 10 to 50 percent of the avocado crop from trees. Dust from the winds lowered the visibility, which led to a 16 car pileup, injuring 23 people. In addition, the winds brought the lowerest relative humidity of record to Burbank, 3 percent, and contributed to disastrous fires in the hills of the Los Angeles area. 1977: Several possible causes lead to the collapse of the Kelly Barnes Dam in Georgia to give way. The failure allowed a 40-acre lake to flood the Toccoa Falls College, killing 39 people and injuring 60 more. 1977: 5 to 9 inches of rain caused an earthen dam above the town of Toccoa, Georgia to burst during the pre-dawn hours of a Sunday morning, flooding the town and killing 37 people. The Toccoa Falls Bible College was flooded and several people perished there. There were many bridge and road washouts in North Georgia during the event, including 18 in Madison County GA alone. (Ref. AccWeather Weather History) 1986: On this date through the 7th, a storm brought heavy snow across parts of the northern Rockies. Snowfall totals included: Mystic Lake, MT: 35 inches, Red Lodge, MT: 27 inches, Nye, MT: 16 inches, Burgess Junction, MT: 15 inches, Sheridan, WY: 13 inches, Pryor, MT: 9 inches, Broadus, MT: 7 inches and Billings, MT: 5 inches. (Ref. Wilson Weather History) 1987 - High winds in the northeastern U.S., turning a recent warm spell into a distant memory, gusted to 63 mph at Rhode Island. Squalls resulting from the high winds produced five inches of snow at Marquette MI and seven inches at Rome NY. A storm in the southwestern U.S. brought heavy snow to some of the higher elevations of Arizona, Colorado and Utah. (Storm Data) (The National Weather Summary) 1988 - A powerful low pressure system over the Great Lakes Region continued to produce snow across parts of the Ohio Valley and the Great Lakes Region. Snowfall totals along the shore of Lake Superior reached 24 inches, with three feet of snow reported in the Porcupine Mountain area of Upper Michigan. Marquette MI established a November record with 17.3 inches of snow in 24 hours. (The National Weather Summary) (Storm Data) 1989 - Unseasonably warm weather prevailed in the south central and southeastern U.S. Nine cities from Florida to Oklahoma and Texas reported record high temperatures for the date as readings warmed into the 80s. The high of 89 degrees at the Dallas/Fort Worth Airport in Texas equalled their record for November. (Storm Data) (The National Weather Summary) 1994: San Francisco, CA set a 24-hour rainfall record with 6.19 inches. (Ref. AccWeather Weather History) 1996: Heavy showers and thunderstorms moved across central and southern Oklahoma on this date in 1996, and continued through the early morning of the 7th. Flash flooding occurred across many counties. Durant received up to 5 inches, as city streets became impassable with as much as two feet of water covering the roads. (Ref. Wilson Weather History) 2005 - Severe thunderstorms produced a deadly tornado near Evansville, Indiana during the early morning hours of November 6. There were 23 fatalities from the tornado, with 19 of the deaths occurring in the Eastbrook Mobile Home Park located just to the southeast of the city (Associated Press). It was Indiana's deadliest tornado since the Super Outbreak on April 3, 1974. 2005: The deadliest tornado to strike Indiana since April 3rd, 1974, occurred around 2 am. A single F3 tornado inflicted 24 fatalities, 238 injuries, and nearly 90 million dollars in damage with a path length of 41 miles. This storm moved in a northeasterly direction from just north of Smith Mills, Kentucky, to Gentryville, Indiana, and crossed the Ohio River three times. Most of the damage occurred as the tornado passed southeast of the city of Evansville, Indiana. 2009: Gulf of Alaska: High waves, winds, and low pressure accompany a major storm sitting over the Gulf of Alaska. Weather buoy station 46082 recorded the highest winds with the storm hit 69 mph and also had waves of nearly 30 feet. Buoy station 46085 reports the lowest pressure reading at 945 mb (27.91 inches mercury, just shy of the Category 4 Hurricane classification on the old SS Scale. Along the Pacific Northwest Coast, winds hit as high as the 91 mph reading at Garibaldi, Oregon. The storm also generates a confirmed F0 tornado at Roads End, Oregon. (Ref. WxDoctor)
-
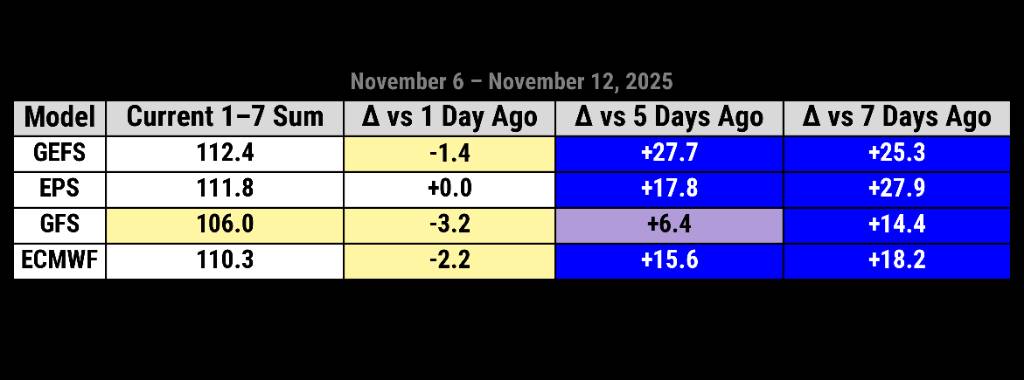
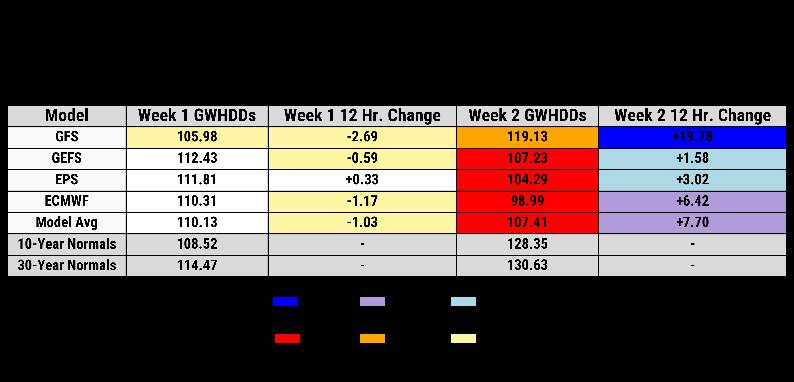
This is interesting. Model data continues to struggle with extended range cold fronts. Week 1 GWHDDs running 25+ points colder than forecast for the next 7 days this time last week. Operational data has performed slightly better. This might be a case where the "colder" GFS has some merit for week 2. Sent from my SM-G998U using Tapatalk

-
(002).thumb.png.6e3d9d46bca5fe41aab7a74871dd8af8.png)
Central PA Fall Discussions and Obs
ChescoWx replied to ChescoWx's topic in Upstate New York/Pennsylvania
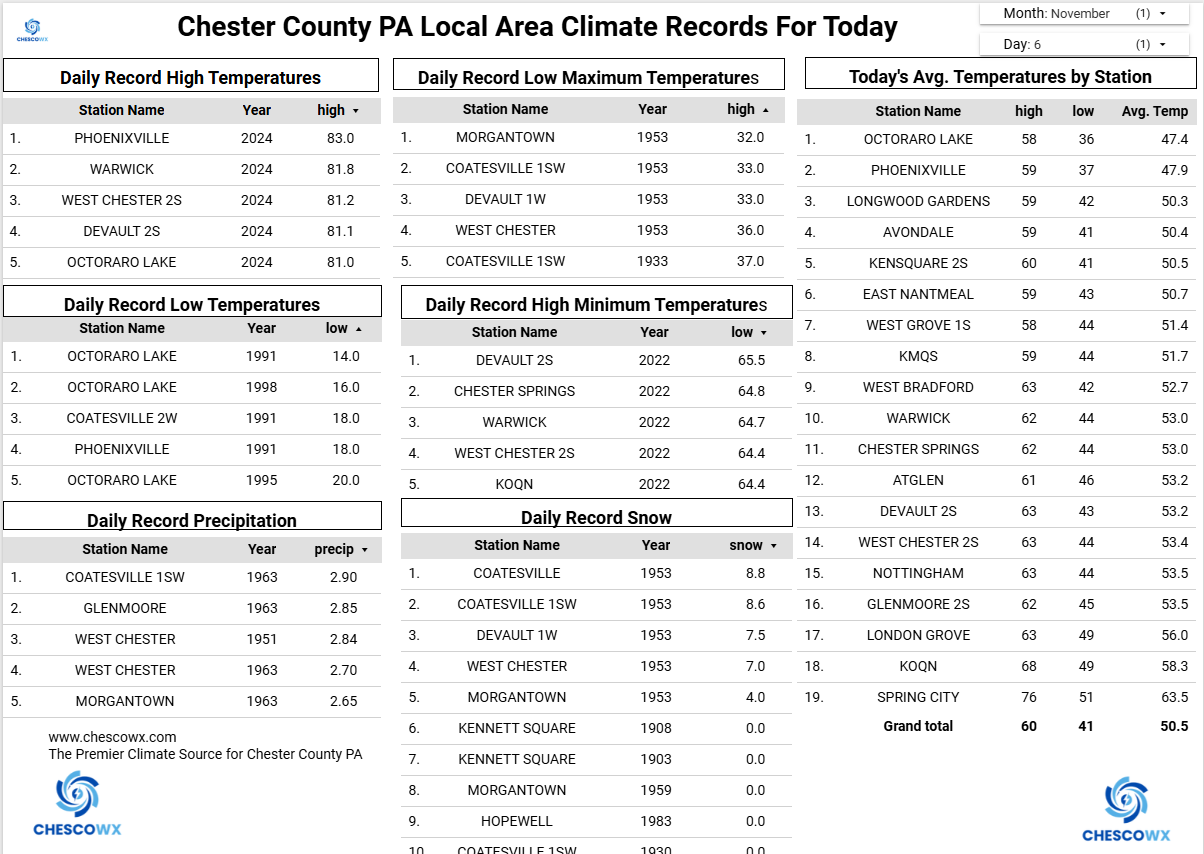
A year ago, today we saw record high temperatures across the area with temperatures in the 80's for many spots. Today we will see readings about 30 degrees cooler than that with highs mainly in the lower 50's. Some frost and freeze potential for especially valley spots tonight before we start a gradual warming trend through the weekend. We then turn sharply colder Sunday evening with a widespread hard freeze across the area by late Monday evening. We could even see some snow flurries later Monday. Our best shower chances look to be Friday night.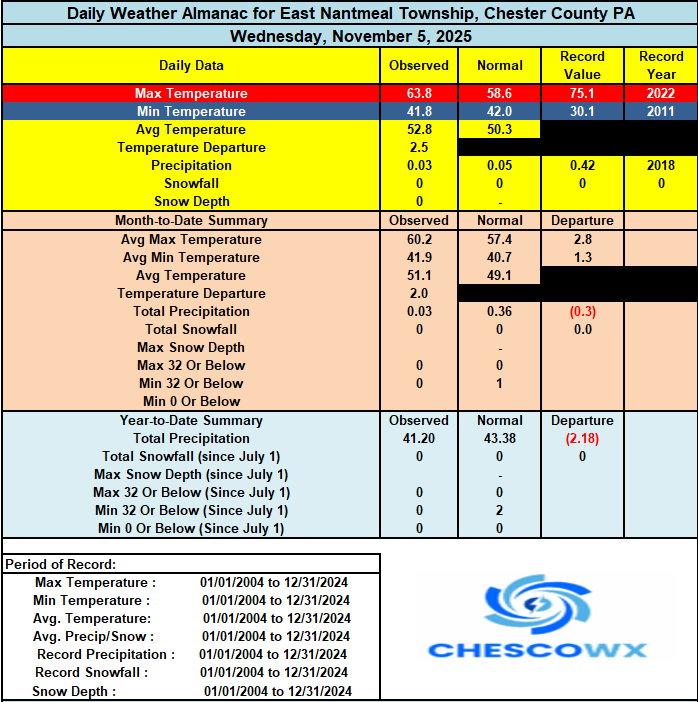

-
E PA/NJ/DE Autumn 2025 Obs/Discussion
ChescoWx replied to PhiEaglesfan712's topic in Philadelphia Region
A year ago, today we saw record high temperatures across the area with temperatures in the 80's for many spots. Today we will see readings about 30 degrees cooler than that with highs mainly in the lower 50's. Some frost and freeze potential for especially valley spots tonight before we start a gradual warming trend through the weekend. We then turn sharply colder Sunday evening with a widespread hard freeze across the area by late Monday evening. We could even see some snow flurries later Monday. Our best shower chances look to be Friday night.
-
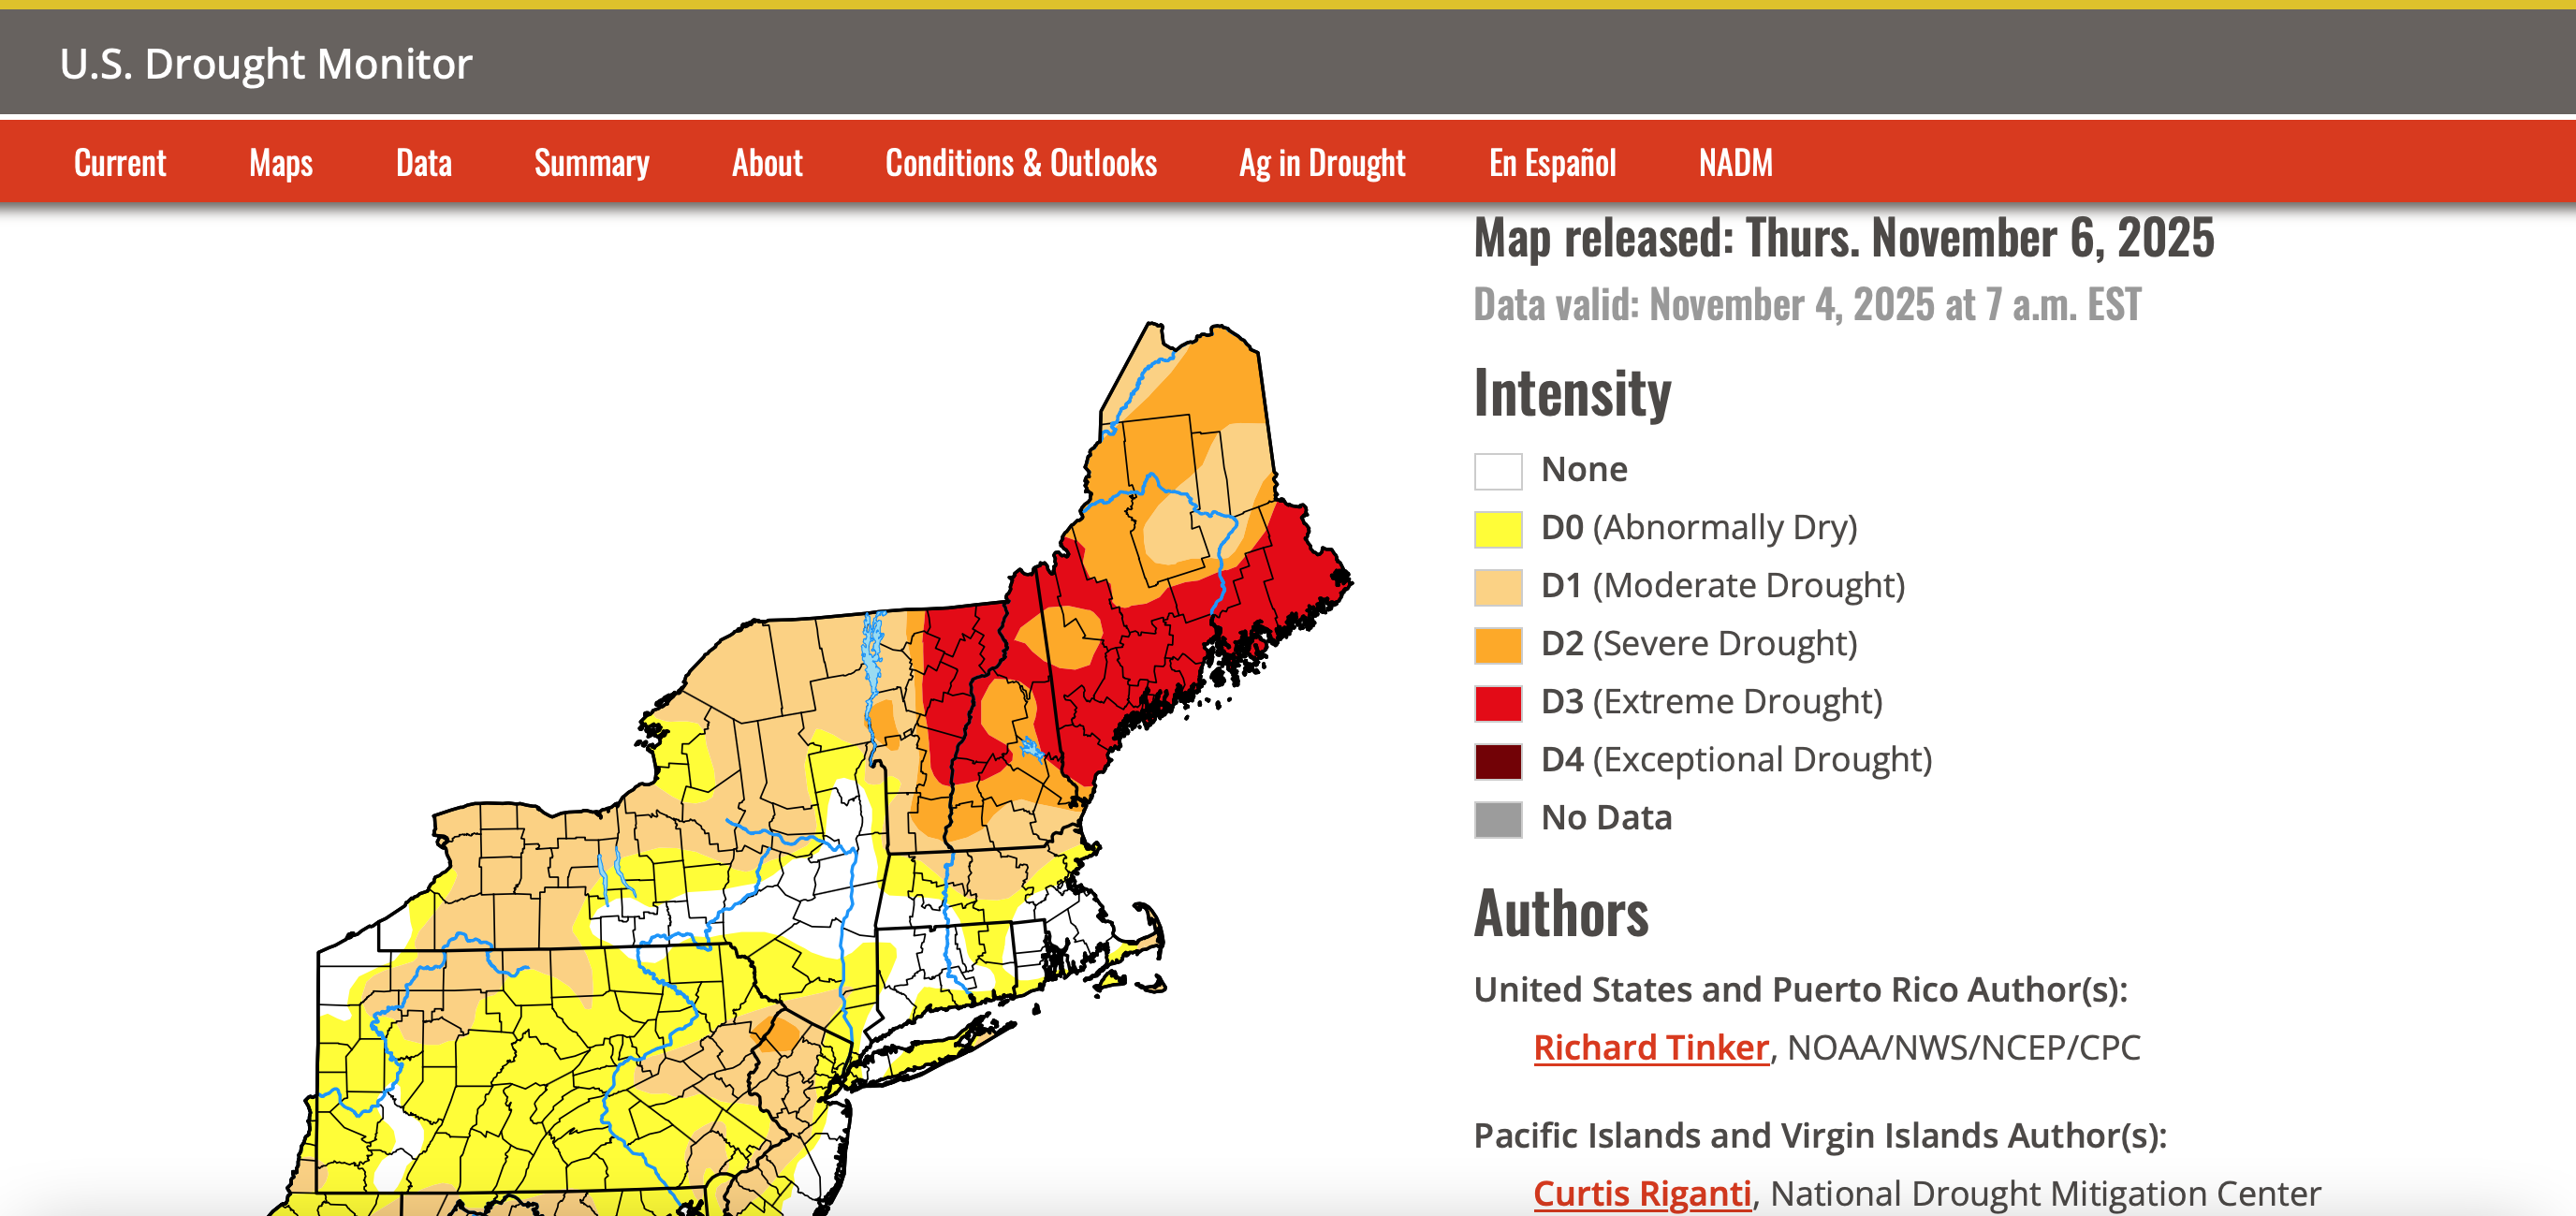
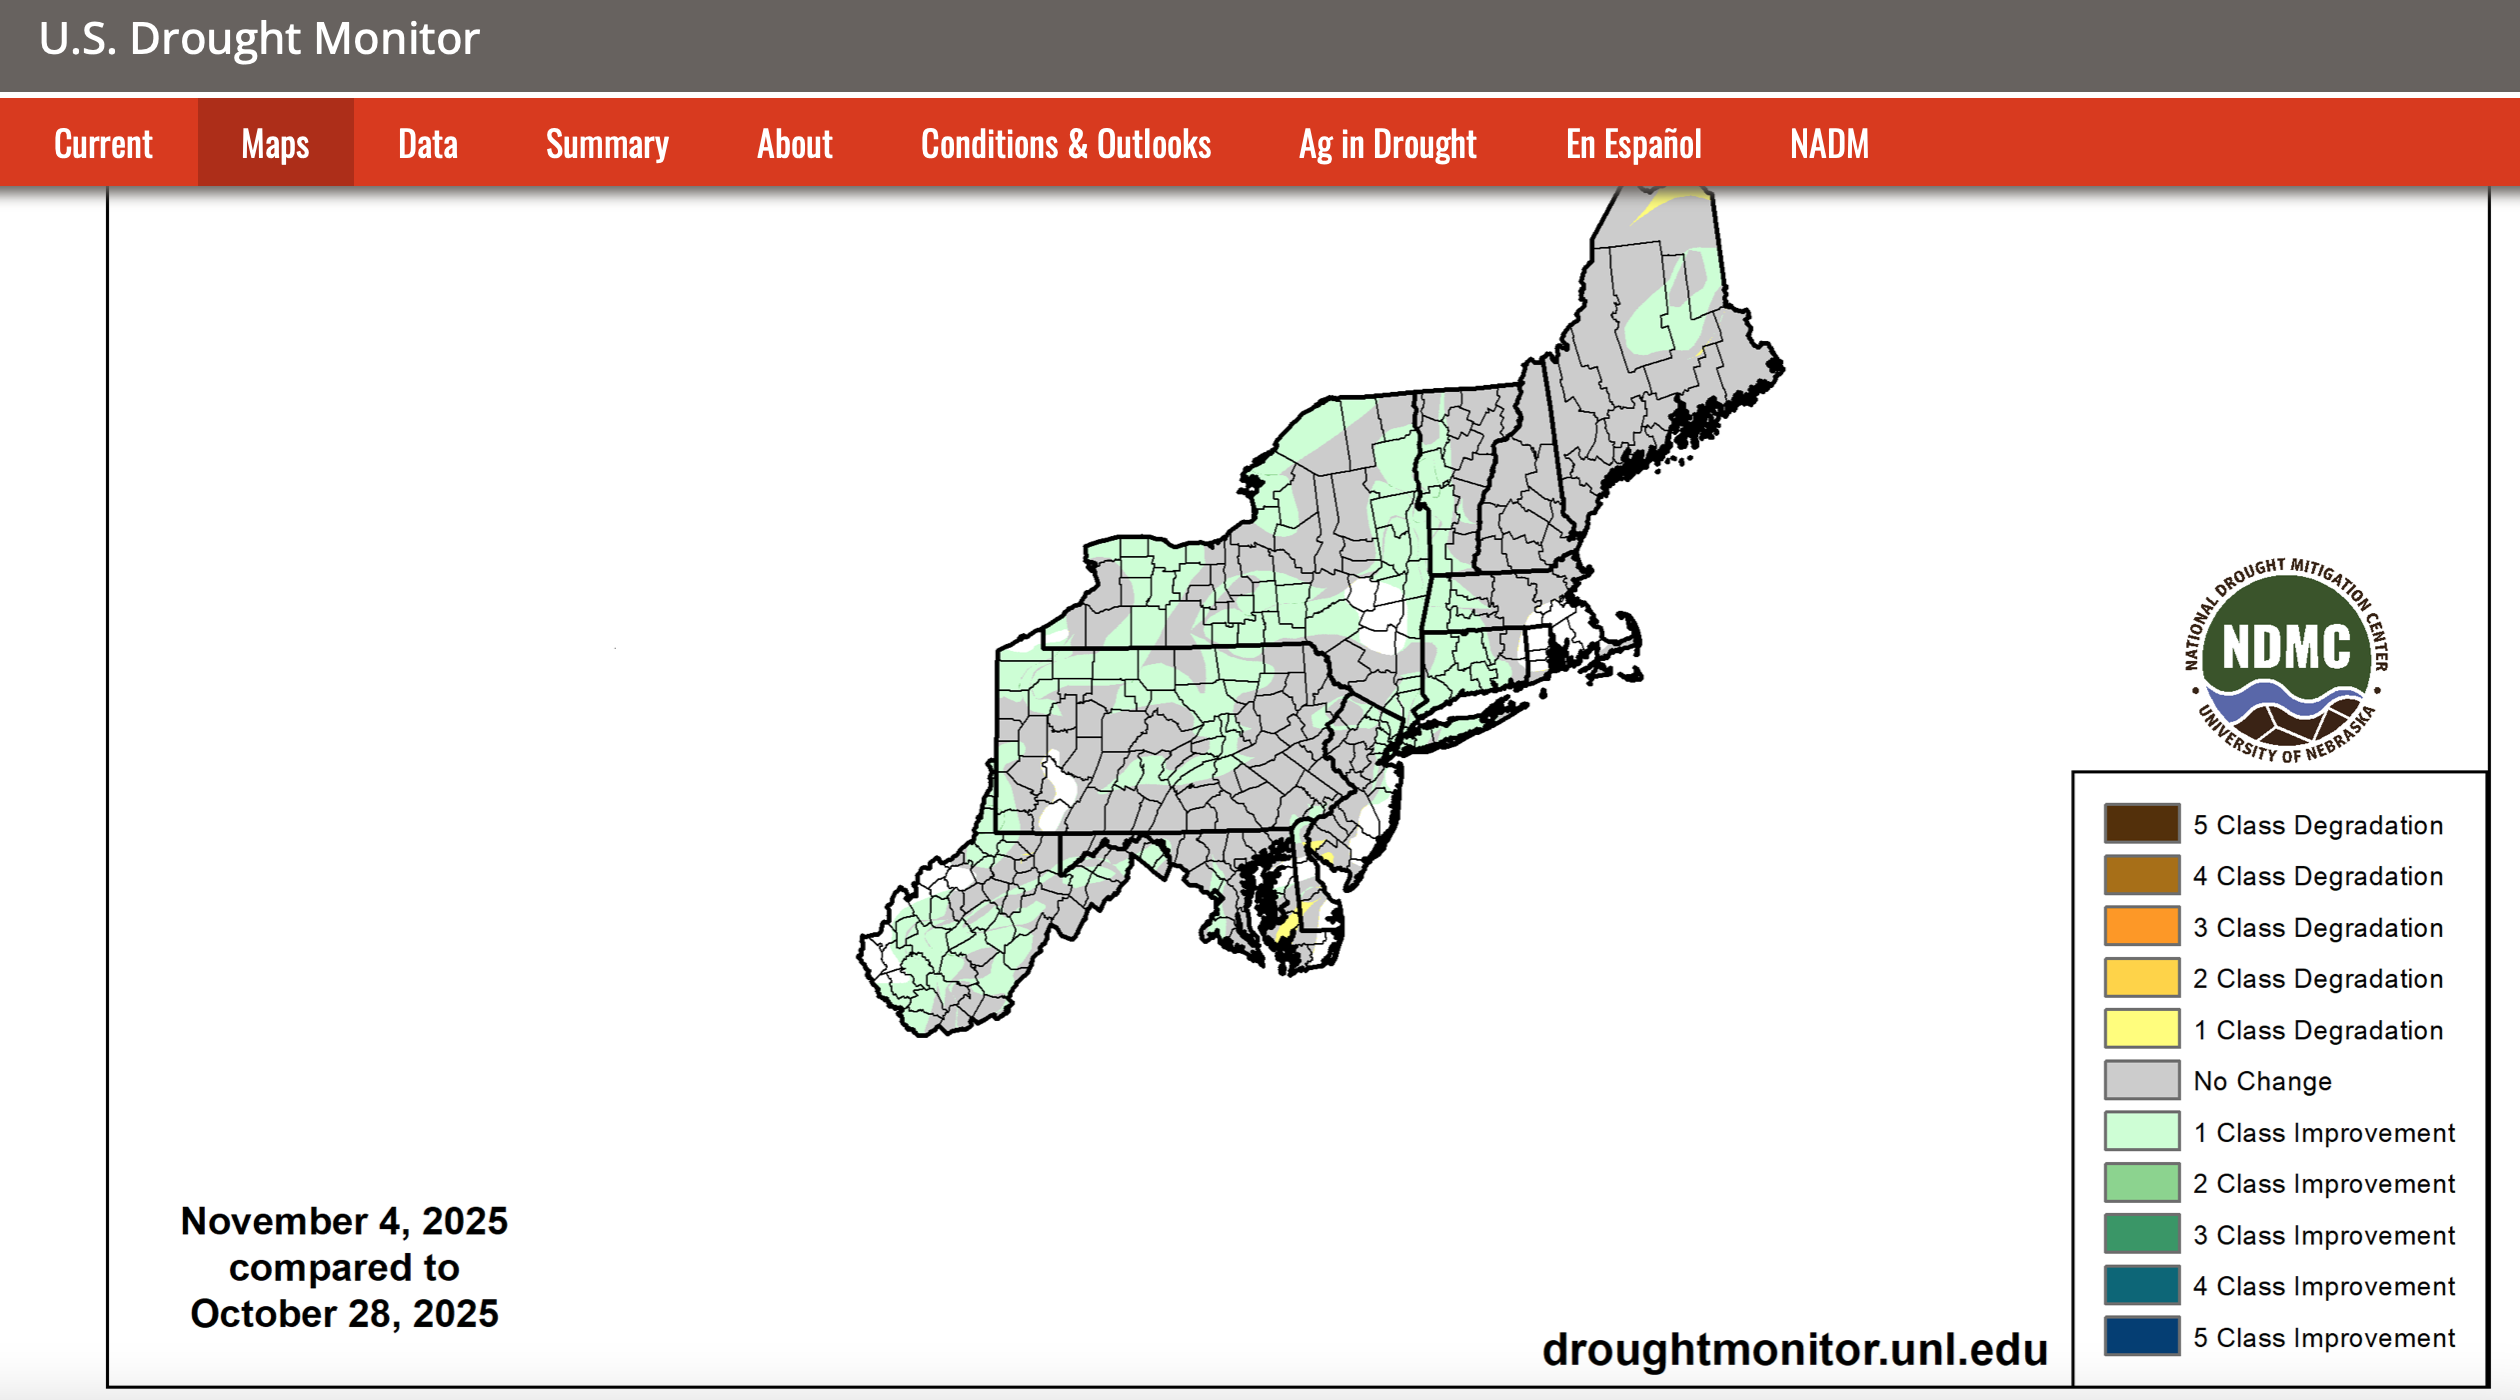
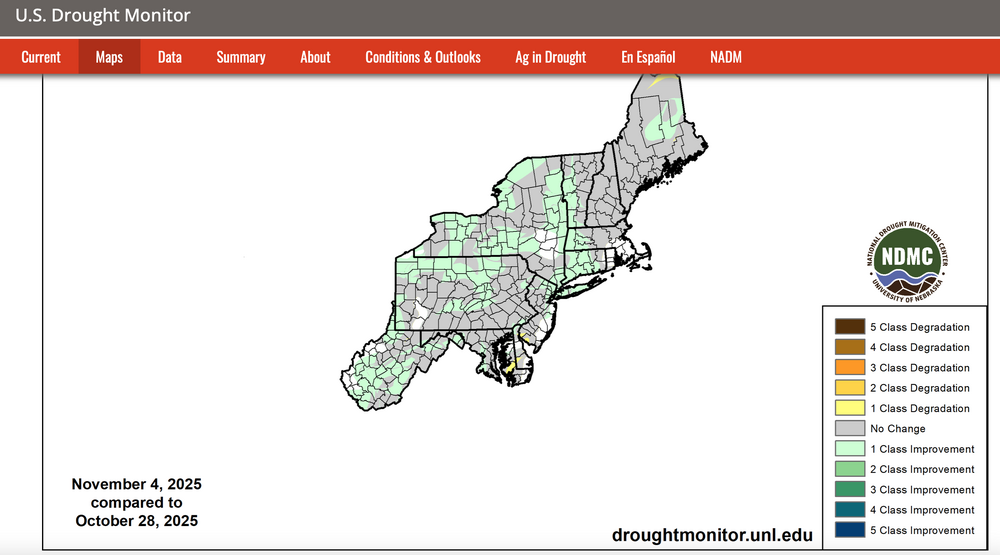
Drought monitor and the classification change over the past week attached. Please click for clarity.

-
51 / 29 winds dying down. Cooler today - sunny / dry minly in the 50s. Warmer Fri / Sat wit Sat maxing in the mid - upper 60s. FRont brings rain on Sunday ahead of the trough and widespread freezing and lowest temps since last winter. Moderation towadrs the 14th then overall near or above normal beyond there.
-
Hey Don, I’m still confused about 1951-2 and 1952-3. 1. 1951-2 had cooling rather than warming from Nov through Feb (coming out of El Niño) and with none of the monthlies near that -0.5 threshold: Nov 1951: +1.19 Dec 1951: +0.74 Jan 1952: +0.49 Feb 1952: +0.37 2. 1952-3 had sharp warming in Jan but these were nowhere near the -0.5 threshold that you were going by: Nov 1952: -0.14 Dec 1952: +0.03 Jan 1953: +0.56 Feb 1953: +0.61 https://www.cpc.ncep.noaa.gov/products/analysis_monitoring/ensostuff/detrend.nino34.ascii.txt
-
Yesterday 11/5 Highs TEB: 71 PHL: 70 EWR: 70 ACY: 69 New Brnswck: 69 BLM: 69 TTN: 67 LGA: 66 NYC: 66 ISP: 64 JFK: 63
-
As a warminista, I would love to predict zeros across the board. However, I'm afraid the weather knows where I am, so... BWI: 16.0 DCA: 14.0 IAD: 18.0 RIC: 8.0 Tiebreaker SBY: 8.0
-
 38.7 was the highest my station recorded. .02" of rain. Saw Reading PA got to 61mph
 -

November 2025 general discussions and probable topic derailings ...
alex replied to Typhoon Tip's topic in New England
Snowing well now
-
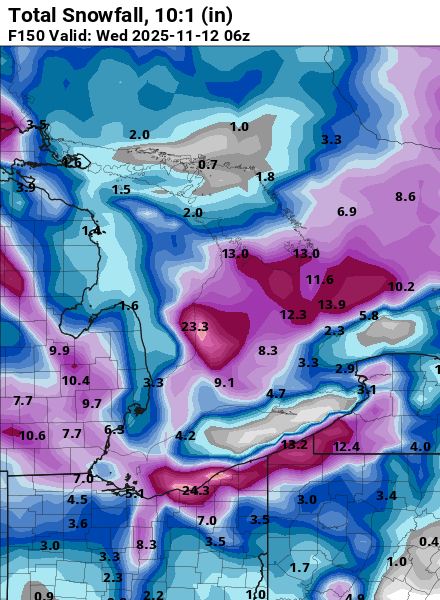
Seems like the models are shifting to a more NW wind direction. Still a long way out but some of the clown maps are interesting... CMC with a 2' bullseye over downtown.
-
I think its more valid for further north. The southeast ridge should be more prevalent than last winter.
-
Everyone is bullish for next month and early January. Its the end of January through March that we have to watch out for a crappy pattern.
-
Hello Mr. Bluesky. Light winds still but the sun is shining bright.