All Activity
- Past hour
-

Possible Record Breaking Cold + Snow 1/25 - 1/26
donsutherland1 replied to TriPol's topic in New York City Metro
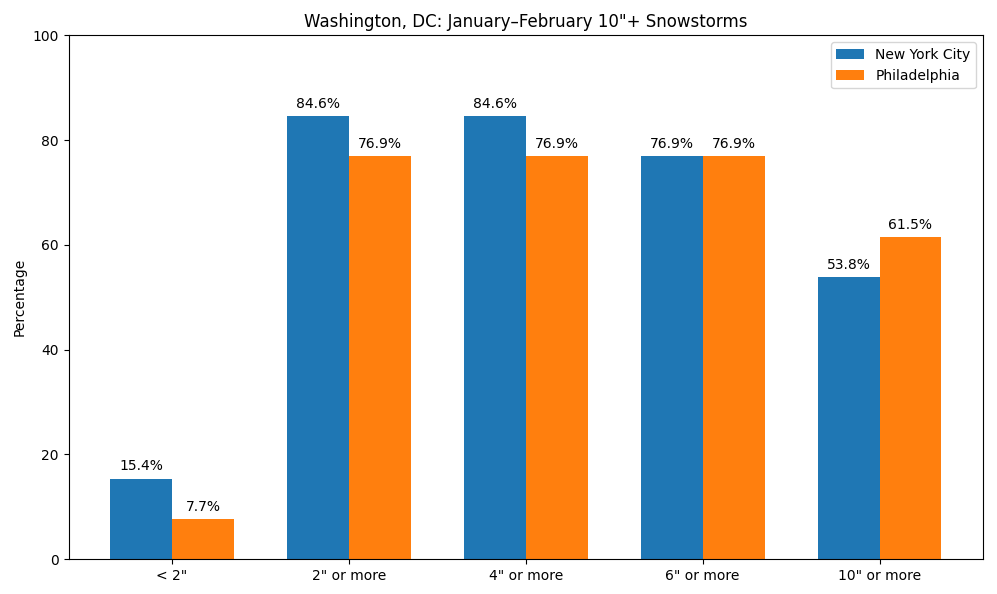
At present, it appears very likely that Washington, DC will see 6" or above snowfall during the January 24-26, 2026 snowstorm. Since 1950, below is the distribution of outcomes based on 6" or above and 10" or above January-February snowstorms in Washington, DC for New York City and Philadelphia. In theory, guidance with the higher-skill initialization (4dVAR)/better resolution (ECMWF, GGEM, and UKMET) should have a better handle at the current lead time. One can't fully dismiss the GFS, especially as there are ensemble members that support its solution. However, if one also weighs the historical outcomes while waiting for the guidance to reach higher skill levels in resolving the synoptic details (usually within 3 days of the event), it seems plausible that New York City and Philadelphia are plausibly in line for at least a 3"-6" snowfall with upside potential if full phasing takes place and the storm tracks closer to the coast.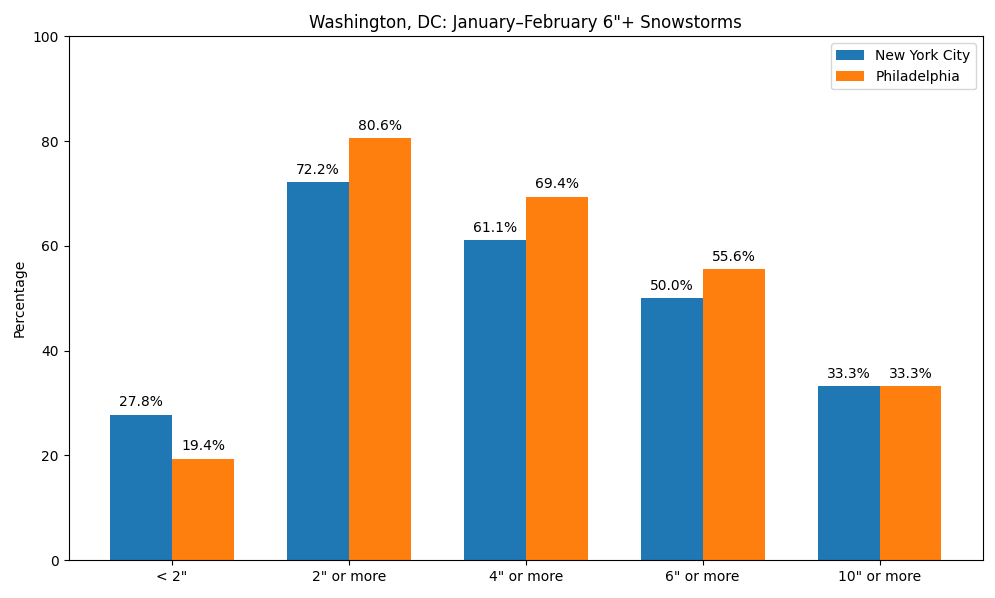
-
Anyone know when this will be integrated into the models @high risk @MillvilleWx @WxUSAF
-
-
@WxWatcher007id sell my soul to you for minimum 2 years if this verified. Let the Reaper come back!
-
That is my greatest memory of Bob Ryan. I used to “argue” with him on tv and loved watching him increase the forecast.
-

1/23/26-1/25/26 Winter Storm Thread
Holston_River_Rambler replied to AMZ8990's topic in Tennessee Valley
Looks like the para CMC jumped about 200 miles south with its snow line since 0z. 40 north now instead of central KY -
Well, evidently the Scooters groundhog has some kind of Puxatony Phil powers. Didn't seem overly scared of his shadow, but maybe that is what happens when good folks slip you a cake bite now and then - got to stay visible.
-

Possible Record Breaking Cold + Snow 1/25 - 1/26
Krs4Lfe replied to TriPol's topic in New York City Metro
If this pans out as forecast, its a winter saver for DC-Philly, which has been hurting in snow department this year. DC had average snow in 2019, 2024, and 2025. Philly had average snow in 2021 but baltimore has been snowholed since 2018. Baltimore has missed out on almost every big snow over past 10 years. Overall, entire I-95 corridor has been hurt by the 2020s, lowest snowfall average of any recorded decade. Boston can always get the late blooming blizzard, but wow has I-95 been lacking -

Central PA Winter 25/26 Discussion and Obs
canderson replied to MAG5035's topic in Upstate New York/Pennsylvania
The perfect storm amount imo. Not too much to absolutely destroy a week, but enough to kill a a day or two. Fluffy snow makes it even better since it’s easier to clear! FAIW Broadway show runners are already messaging about potential snow impacts. -
6hrs snowfall off latest Sref. Pretty far north. https://www.pivotalweather.com/model.php?m=srefens&p=sn10_006h-mean-imp&rh=2026012015&fh=87&r=conus&dpdt=&mc=&pwplus=1
-

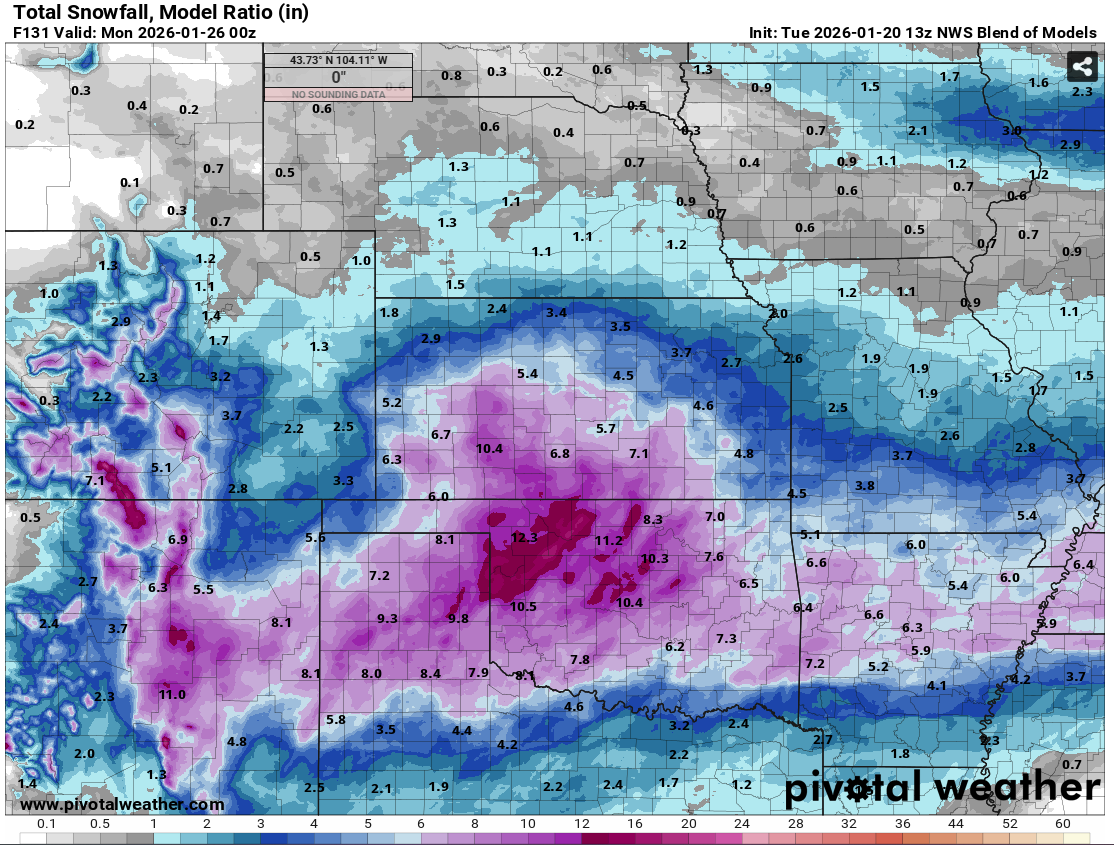
MO/KS/AR/OK 2025-2026 Winter Discussion
RocketWX replied to stormdragonwx's topic in Central/Western States
Here is the most recent run of NWS Blend of Models through Sunday evening. I haven't done a ton of research on it, but essentially it combines multiple numerical weather models and post processed data in hopes of giving an accurate and reliable starting point for NWS forecasts. I will say this most recent run is the most bullish with amounts across the board so far. Previous runs had ICT in the 3-5" range. This is probably due to a few factors. Models becoming more aligned as we go (confidence) and/or trends in the models. I'd still expect some fluctuations as we progress through the week, but I'd expect them to become smaller by the day. I'll be curious how this does as I don't have much history with it.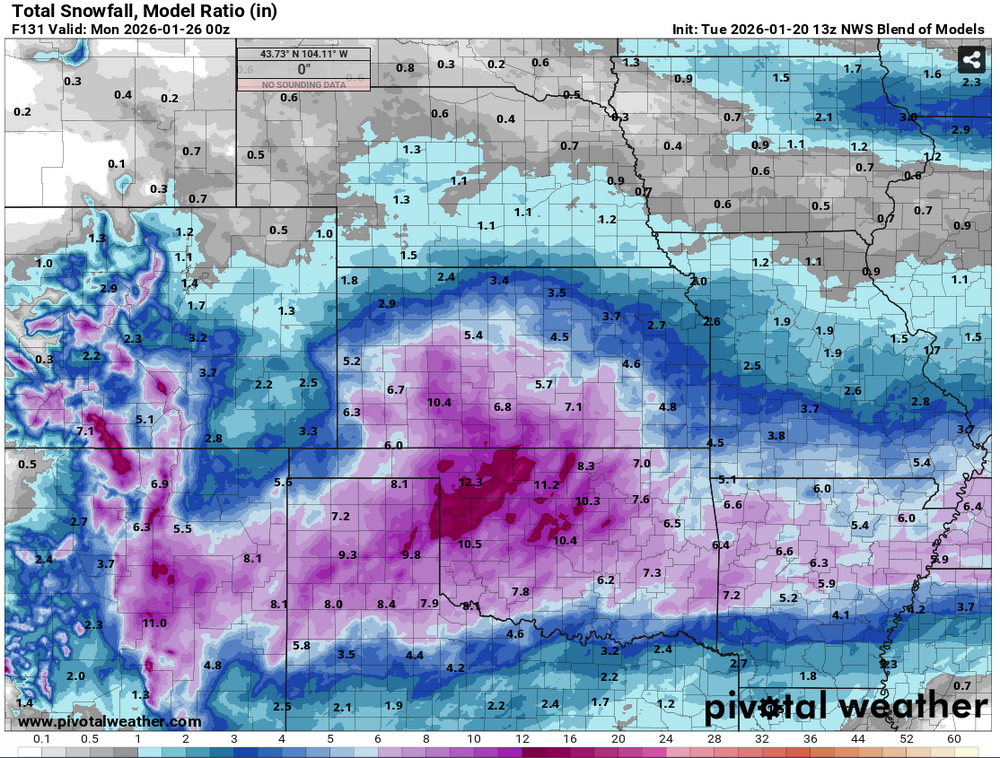
-

Possible Record Breaking Cold + Snow 1/25 - 1/26
eduggs replied to TriPol's topic in New York City Metro
On the EPS individuals I count 13 misses and 11 big hits out of 50. The rest are light to significant hits. ~25% miss rate is still pretty high. Still plenty of variability. -
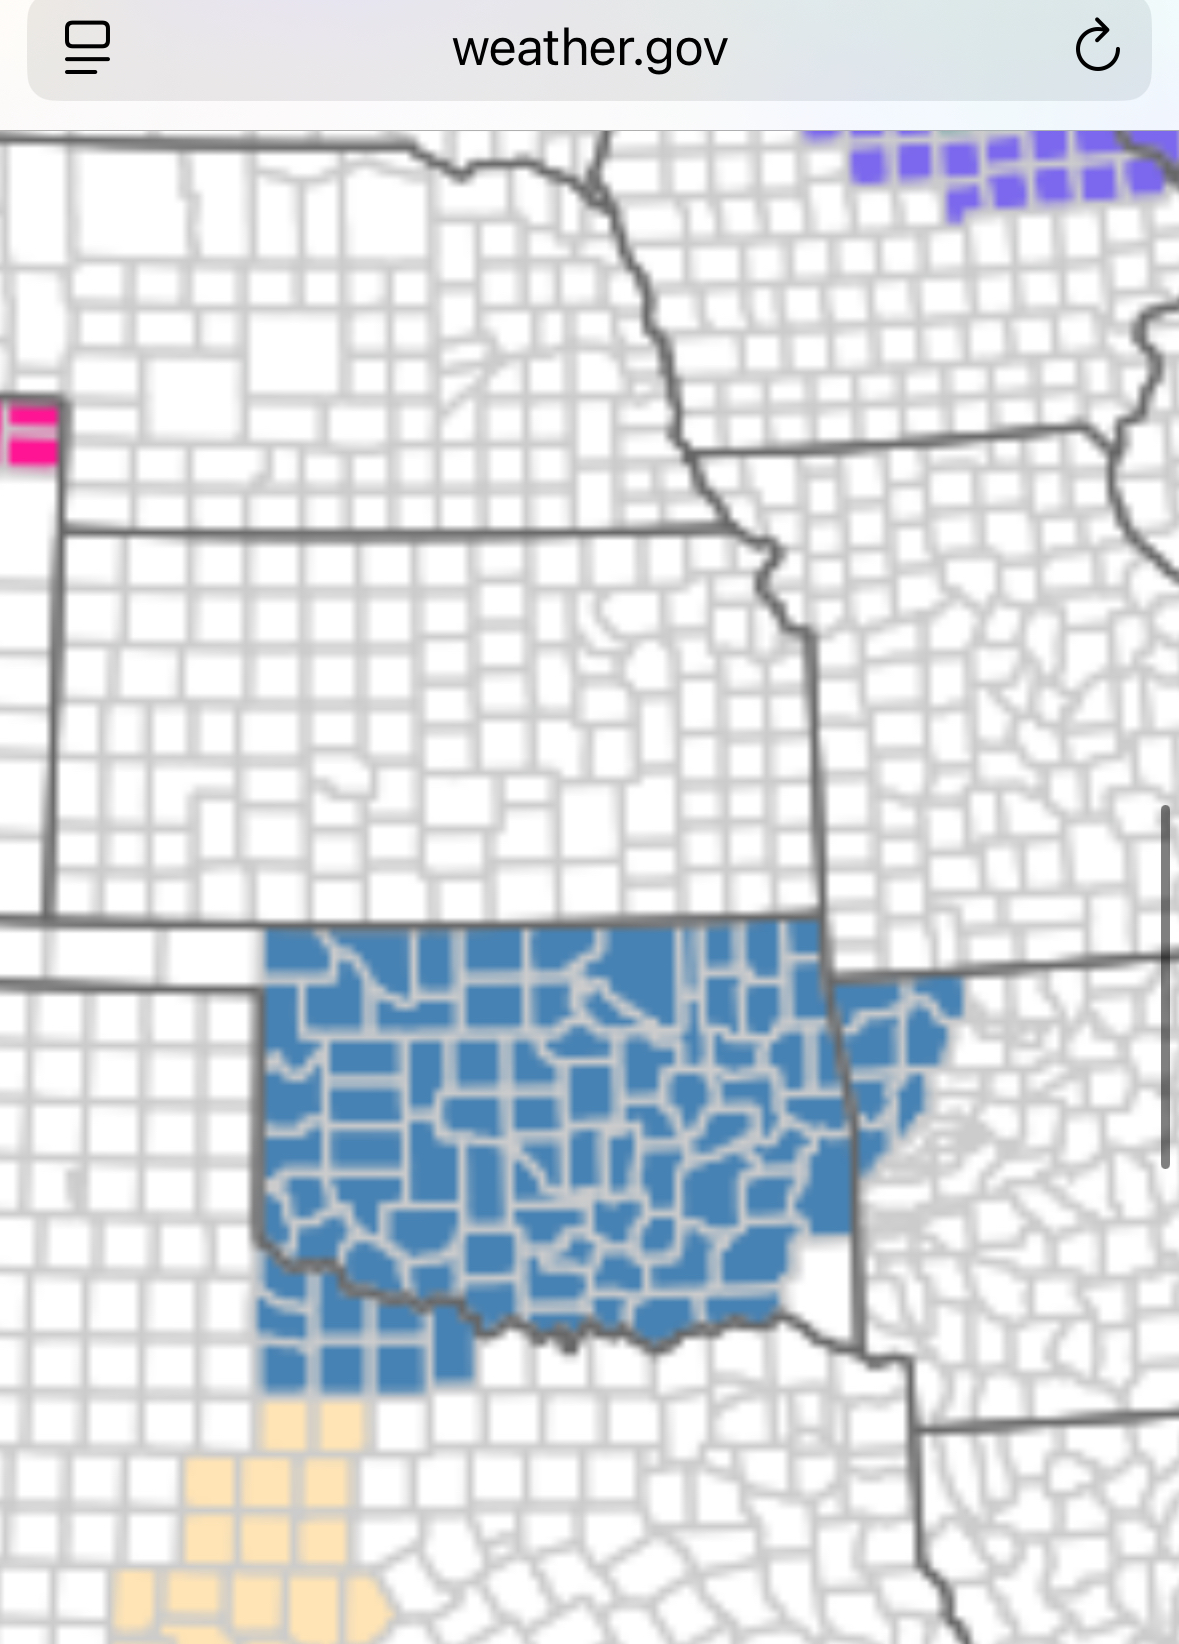
The first watches for the storm have gone up out west.
-
It’s beautiful
-

Pittsburgh/Western PA WINTER ‘25/‘26
colonel717 replied to Burghblizz's topic in Upstate New York/Pennsylvania
Here are several EPS members that with ratios would likely give us 1-2ft So there is some ability for this storm to improve.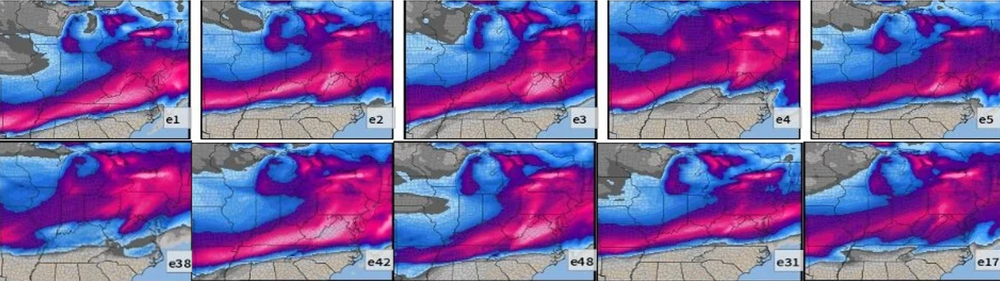
-
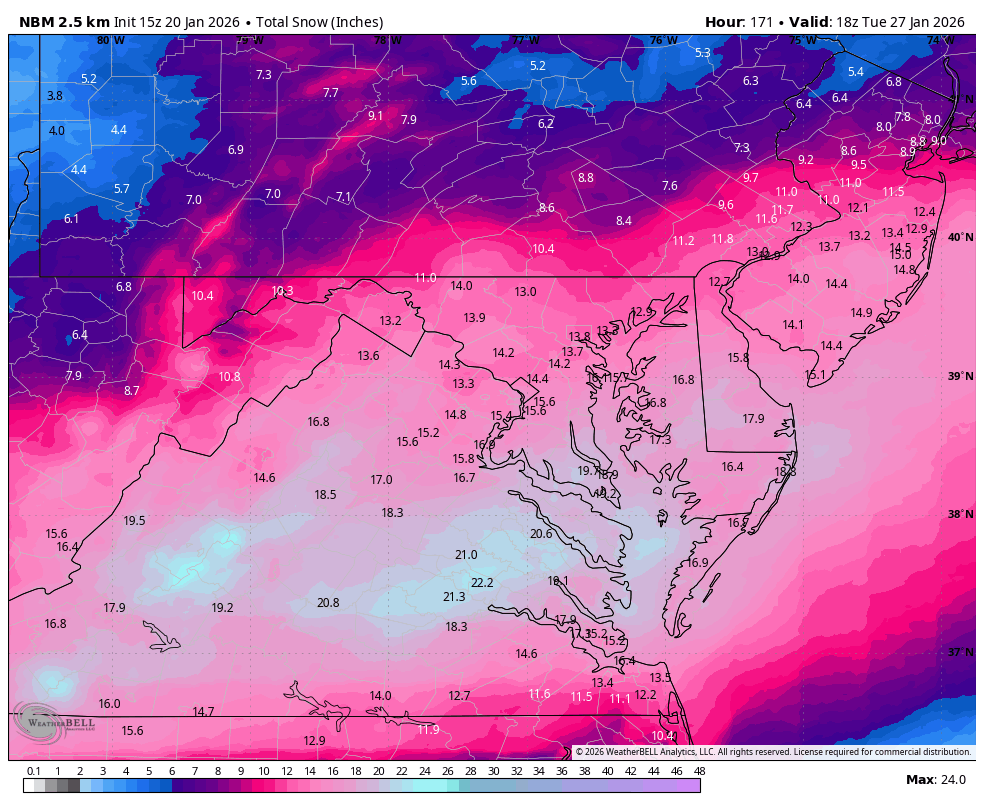
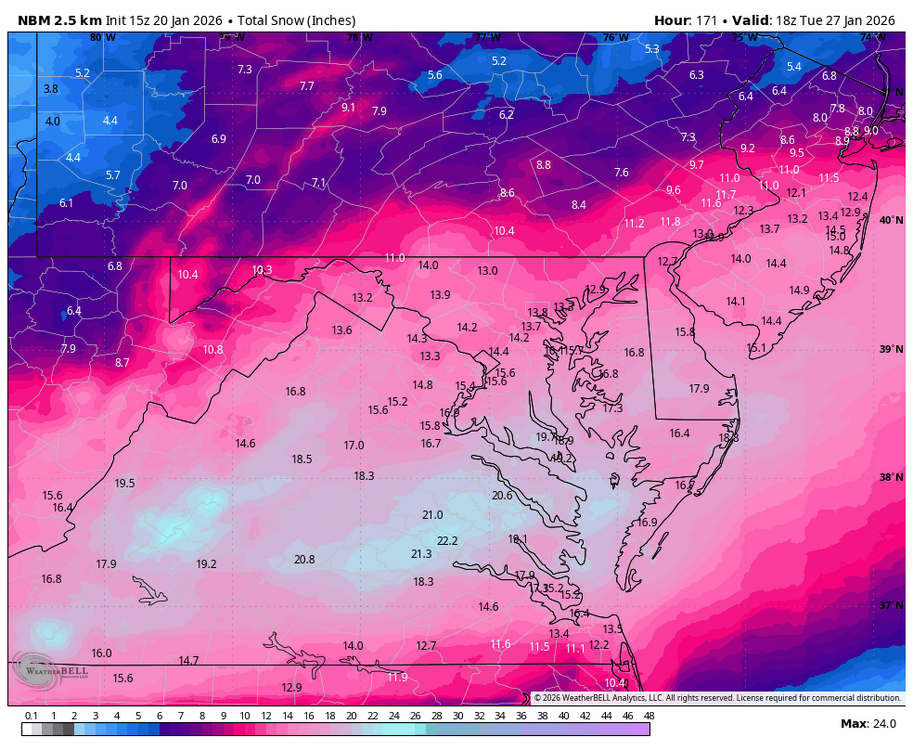
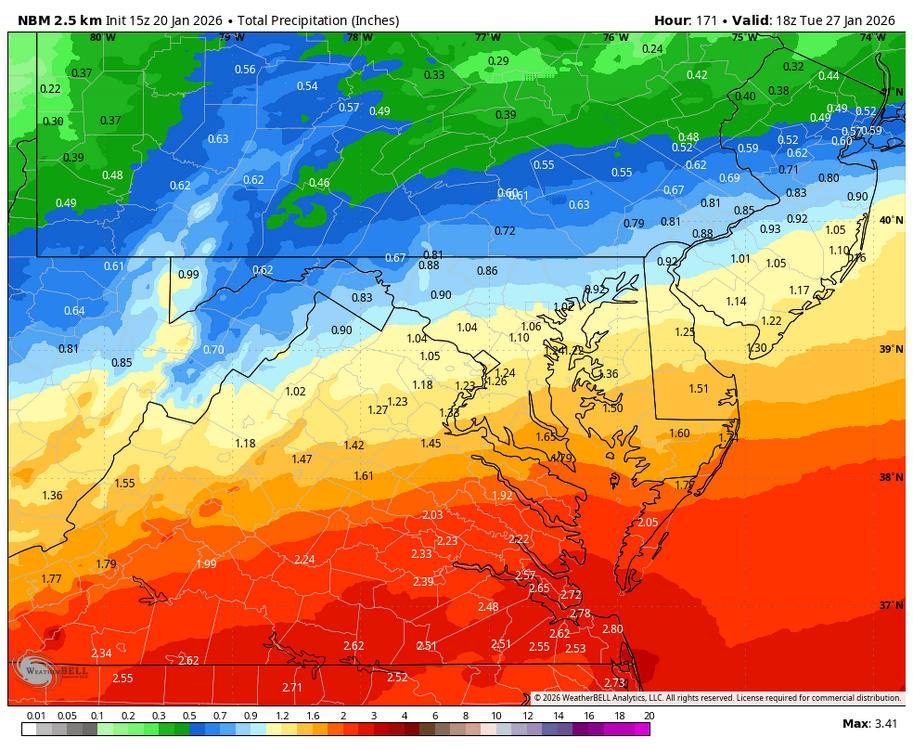
WB 15Z NBM
-

Possible Record Breaking Cold + Snow 1/25 - 1/26
SACRUS replied to TriPol's topic in New York City Metro
Final 12z - solid snowstorm on 8 of 9 outputs -
Like that the EPS got a lil better
-
Yeah, a near lock for 1.5-2.5" QPF all frozen doesn't come around too often and that bears out in the upper levels
-
Possible Record Breaking Cold + Snow 1/25 - 1/26
SACRUS replied to TriPol's topic in New York City Metro
EPS Total QPF Mean -
...I know that you got to have the GFS or nothin' at all, but that Low is movin' too fast... On topic, I'd take that 1.0" of Freezing Rain that the Euro shows and rationazlize it a win that Macon got frozen precip two Sundays in a row !
-
Yup and this statement and its been a while since Warning criteria was met around for most. All this to say, confidence on p-types remains low but confidence of getting warning criteria snow/sleet and/or ice accumulations is increasing.
-
This is just complete model porn if you've researched and tracked these things for 25 years. Just absolutely SICK looking 500mb chart. I have NEVER seen one look this good for our area (GA/SC/NC) from just a general winter storm perspective, regardless of where you find yourself in the precip type category. Definitely soak in this next week.
-
Possible Record Breaking Cold + Snow 1/25 - 1/26
SACRUS replied to TriPol's topic in New York City Metro
GGEM / GEPS