All Activity
- Past hour
-
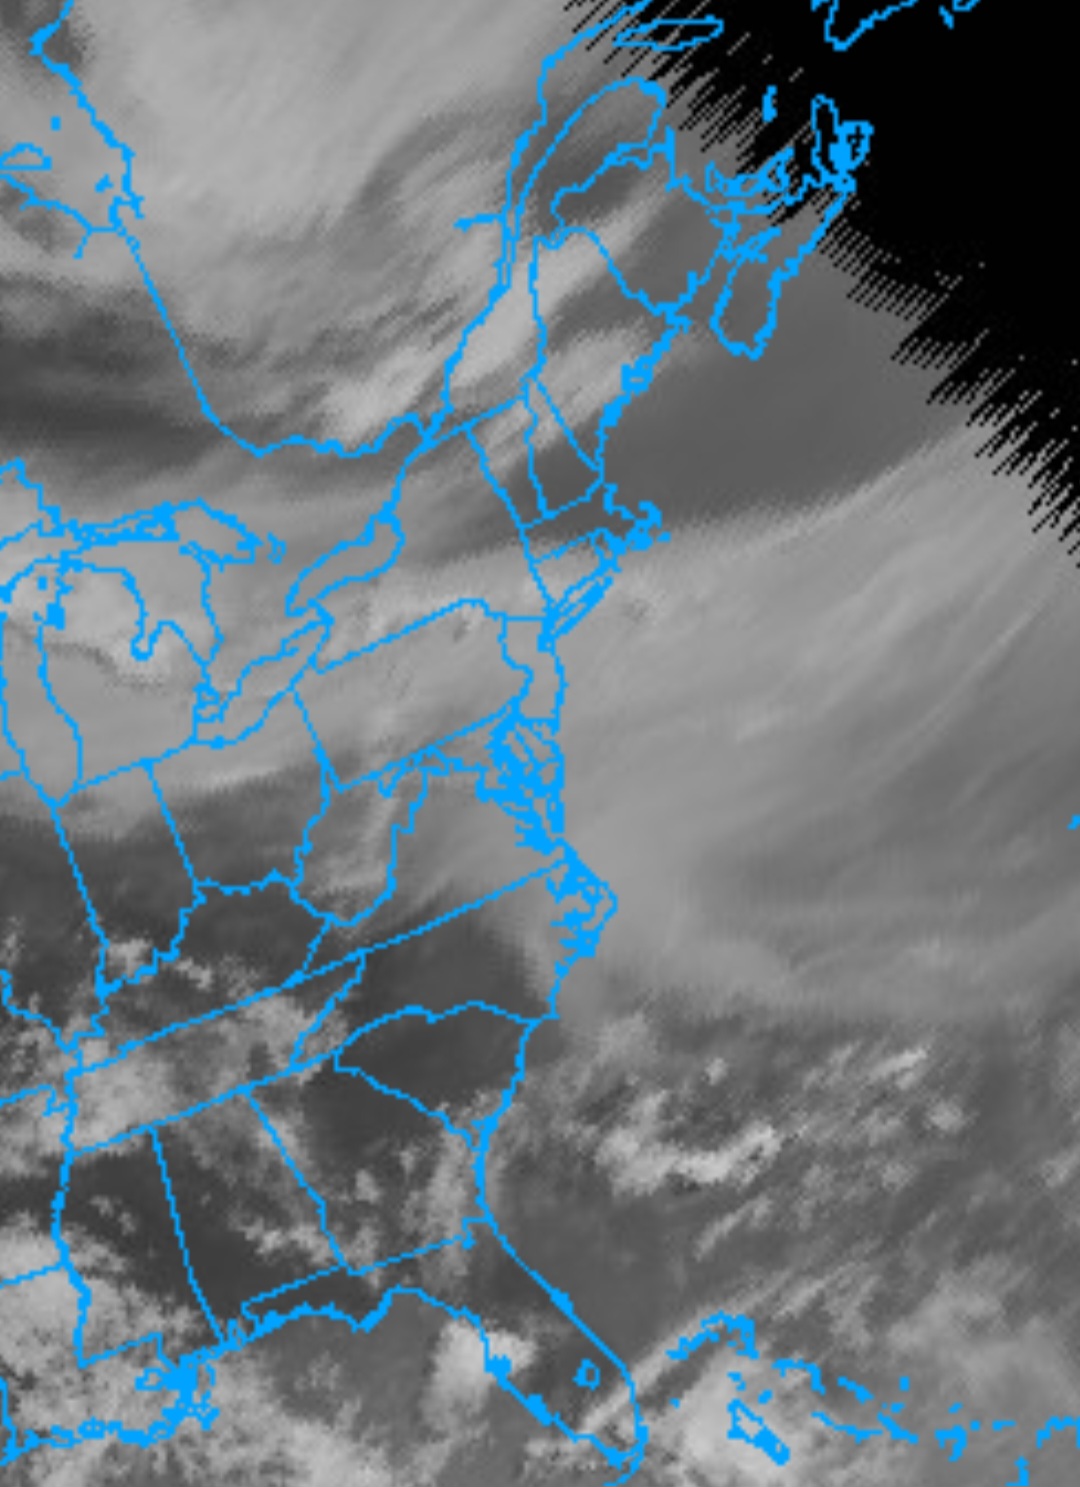
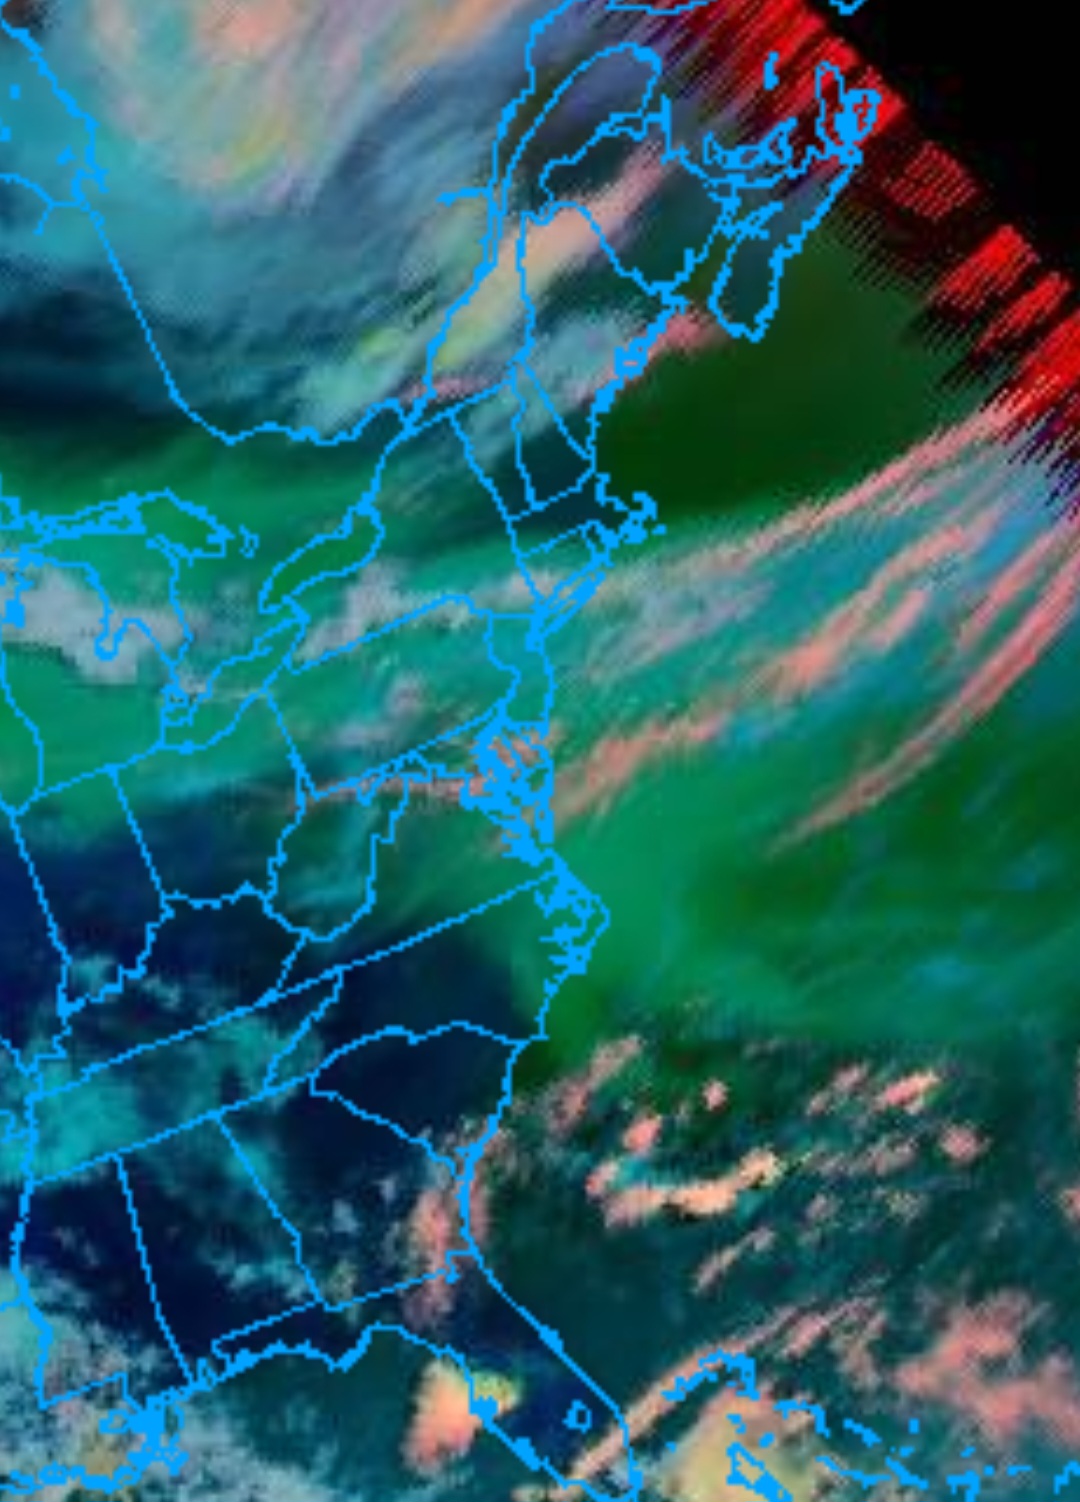
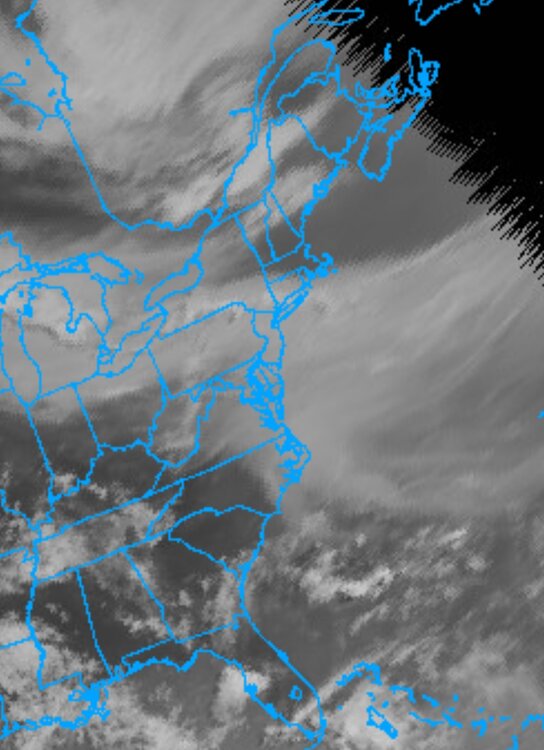
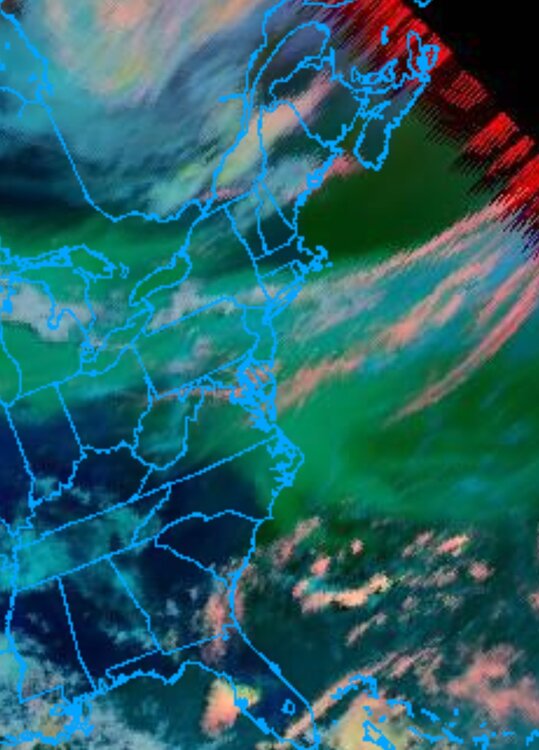
Since GOES-EAST is down, you could use GOES-WEST, though it's not ideal since we're near the edge of the disc image, so images appear blurry but its better than nothing. The colored image distinguishes between cloud types. Smoke is green, blue and red are clouds
-
73 this morning. 85 currently.
-
.thumb.gif.f92b16c631a1d15d405ed77b33f0710d.gif) A little hazy but wish we had some smoke! We dry
A little hazy but wish we had some smoke! We dry -

2026-2027 Super El Nino
GaWx replied to Stormchaserchuck1's topic in Weather Forecasting and Discussion
Unlike the very mild Feb 1878 in the upper Midwest, the E US’ warmest month of that winter was Dec. In contrast, Feb was only modestly AN in a good portion of the NE to NN in the SE. Jan was NN to BN. Jan-Feb combined in much of the E US wasn’t mild at all and instead was largely NN (even BN in good part of SE). -
Haha yeah. Can put the band name above it, name of the album below
-
Air Quality Indexes are off the charts in the upper mid west. Higher than 2023, The extreme readings are knocking on the door of Buffalo. Hopefully it doesn't reach here and without that satellight working, we won't know for sure.
-

2026-2027 Super El Nino
mitchnick replied to Stormchaserchuck1's topic in Weather Forecasting and Discussion
Daily Cfs2 plume charts are updated daily and hyperlinked to this site; past half way down. https://www.stormsurf.com/page2/links/ensocurr.html -
Album cover vibes.
-

2026-2027 Super El Nino
snowman19 replied to Stormchaserchuck1's topic in Weather Forecasting and Discussion
-
Hard to know with satellite down but looking at obs back to the Great Lakes I'd say using pre 1960s forecasting that the worst smoke will go S and W of here
-
In my experience down there in 2015-16, when it decides to rain there it goes totally bonkers. May 2015 was the most rain I've seen in my life in Austin. I guess the closest match would be August 2010 up here but I think May 2015 was worse. The heaviest rain I've ever seen was Oct 2015 when the remnants of Patricia came through. It was literally like watching a firehose outside.
-

2026-2027 Super El Nino
Typhoon Tip replied to Stormchaserchuck1's topic in Weather Forecasting and Discussion
I was just looking at that stuff... According to CPC most recent power point, yet the present NINO 3.4. regional anomalies ( found here: https://climatereanalyzer.org/clim/sst_daily/?dm_id=nino3.4 ) are already floating around +2.00 C. So, either their CFSv2 product is less accurate as a predictive use ( by over a whole deg C ), or... Climate Reanalyzer's data is suss. I don't really care to get into that ..per se, I'm really just more interested in general with the comparison between monitoring vs modeling: where are we?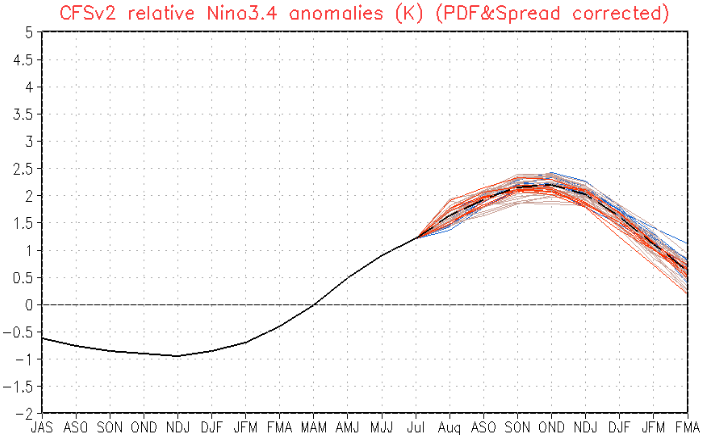
-
URGENT - WEATHER MESSAGE National Weather Service Baltimore MD/Washington DC 955 AM EDT Thu Jul 16 2026 DCZ001-MDZ008-011-013-014-016-504-506-508-VAZ053-054-527-170000- /O.NEW.KLWX.HT.Y.0010.260716T1500Z-260717T0000Z/ District of Columbia-Cecil-Southern Baltimore-Prince Georges-Anne Arundel-Charles-Central and Southeast Montgomery-Central and Southeast Howard-Southeast Harford-Fairfax-Arlington/Falls Church/Alexandria-Central and Southeast Prince William/Manassas/Manassas Park- 955 AM EDT Thu Jul 16 2026 ...HEAT ADVISORY IN EFFECT UNTIL 8 PM EDT THIS EVENING... * WHAT...Heat index values around 105. * WHERE...Washington DC, and portions of central, northeast, northern, and southern Maryland, and northern Virginia. * WHEN...Until 8 PM EDT this evening. * IMPACTS...Hot temperatures and high humidity may cause heat illnesses.
-
 A little while at least based on GOES-W imagery.
 -
 ASH 81F/60 sun.....for how long?
 -
2026-2027 Super El Nino
mitchnick replied to Stormchaserchuck1's topic in Weather Forecasting and Discussion
That's what the Cfs2 was showing over 3 months ago when I posted. I was just the messenger. Obviously, Cfs2 forecast, updated multiple times a day, changed. -
2026-2027 Super El Nino
snowman19 replied to Stormchaserchuck1's topic in Weather Forecasting and Discussion
Here comes the next monster WWB -

2026-2027 Super El Nino
bluewave replied to Stormchaserchuck1's topic in Weather Forecasting and Discussion
Parts of the East had their lowest snowfall of the 1800s that winter. The big story during the 1877-1878 super El Niño was the warmth in the Upper Midwest. It’s an example how really strong El Niños can sometimes have their warmest departures in February. While we don’t have the 1841-1870 climate normals for MSP, I used the earliest available 30 year period. The departures for them that winter would have been like if December 2015 had run through February 2016 in the Northeast with no pattern reversal. MSP 1877-1878 DEC….+14.5 JAN…..+9.8 FEB……+15.8 Monthly Mean Avg Temperature for Minneapolis-St Paul Area, MN (ThreadEx) Click column heading to sort ascending, click again to sort descending. Mean 19.3 12.0 15.7 15.6 Max 33.8 1877 25.9 1880 31.9 1877 1872-1873 6.0 5.4 12.8 8.1 1873-1874 17.6 12.2 12.6 14.1 1874-1875 17.2 -3.4 -2.6 3.7 1875-1876 24.7 15.7 15.9 18.8 1876-1877 8.3 8.6 31.9 16.3 1877-1878 33.8 21.8 31.5 29.0 1878-1879 19.1 16.1 12.7 16.0 1879-1880 11.5 25.9 19.6 19.0 1880-1881 13.2 7.9 17.1 12.7 1881-1882 29.0 19.0 30.4 26.1 1882-1883 15.0 0.8 12.1 9.3 1883-1884 19.7 8.8 12.9 13.8 1884-1885 14.8 4.4 11.3 10.2 1885-1886 21.0 3.7 14.9 13.2 1886-1887 7.3 0.7 9.4 5.8 1887-1888 17.4 -0.4 13.1 10.0 1888-1889 25.2 20.7 10.6 18.8 1889-1890 28.8 10.6 19.2 19.5 1890-1891 24.4 21.6 11.8 19.3 1891-1892 30.1 13.5 22.9 22.2 1892-1893 16.8 7.3 12.0 12.0 1893-1894 14.0 12.3 15.7 14.0 1894-1895 28.1 7.0 12.0 15.7 1895-1896 22.5 16.8 22.3 20.5 1896-1897 24.4 10.6 20.0 18.3 1897-1898 15.3 23.0 20.6 19.6 1898-1899 14.1 13.7 7.8 11.9 1899-1900 21.4 21.3 8.6 17.1 1900-1901 21.0 15.2 12.3 16.2 1901-1902 15.9 18.7 18.2 17.6 -
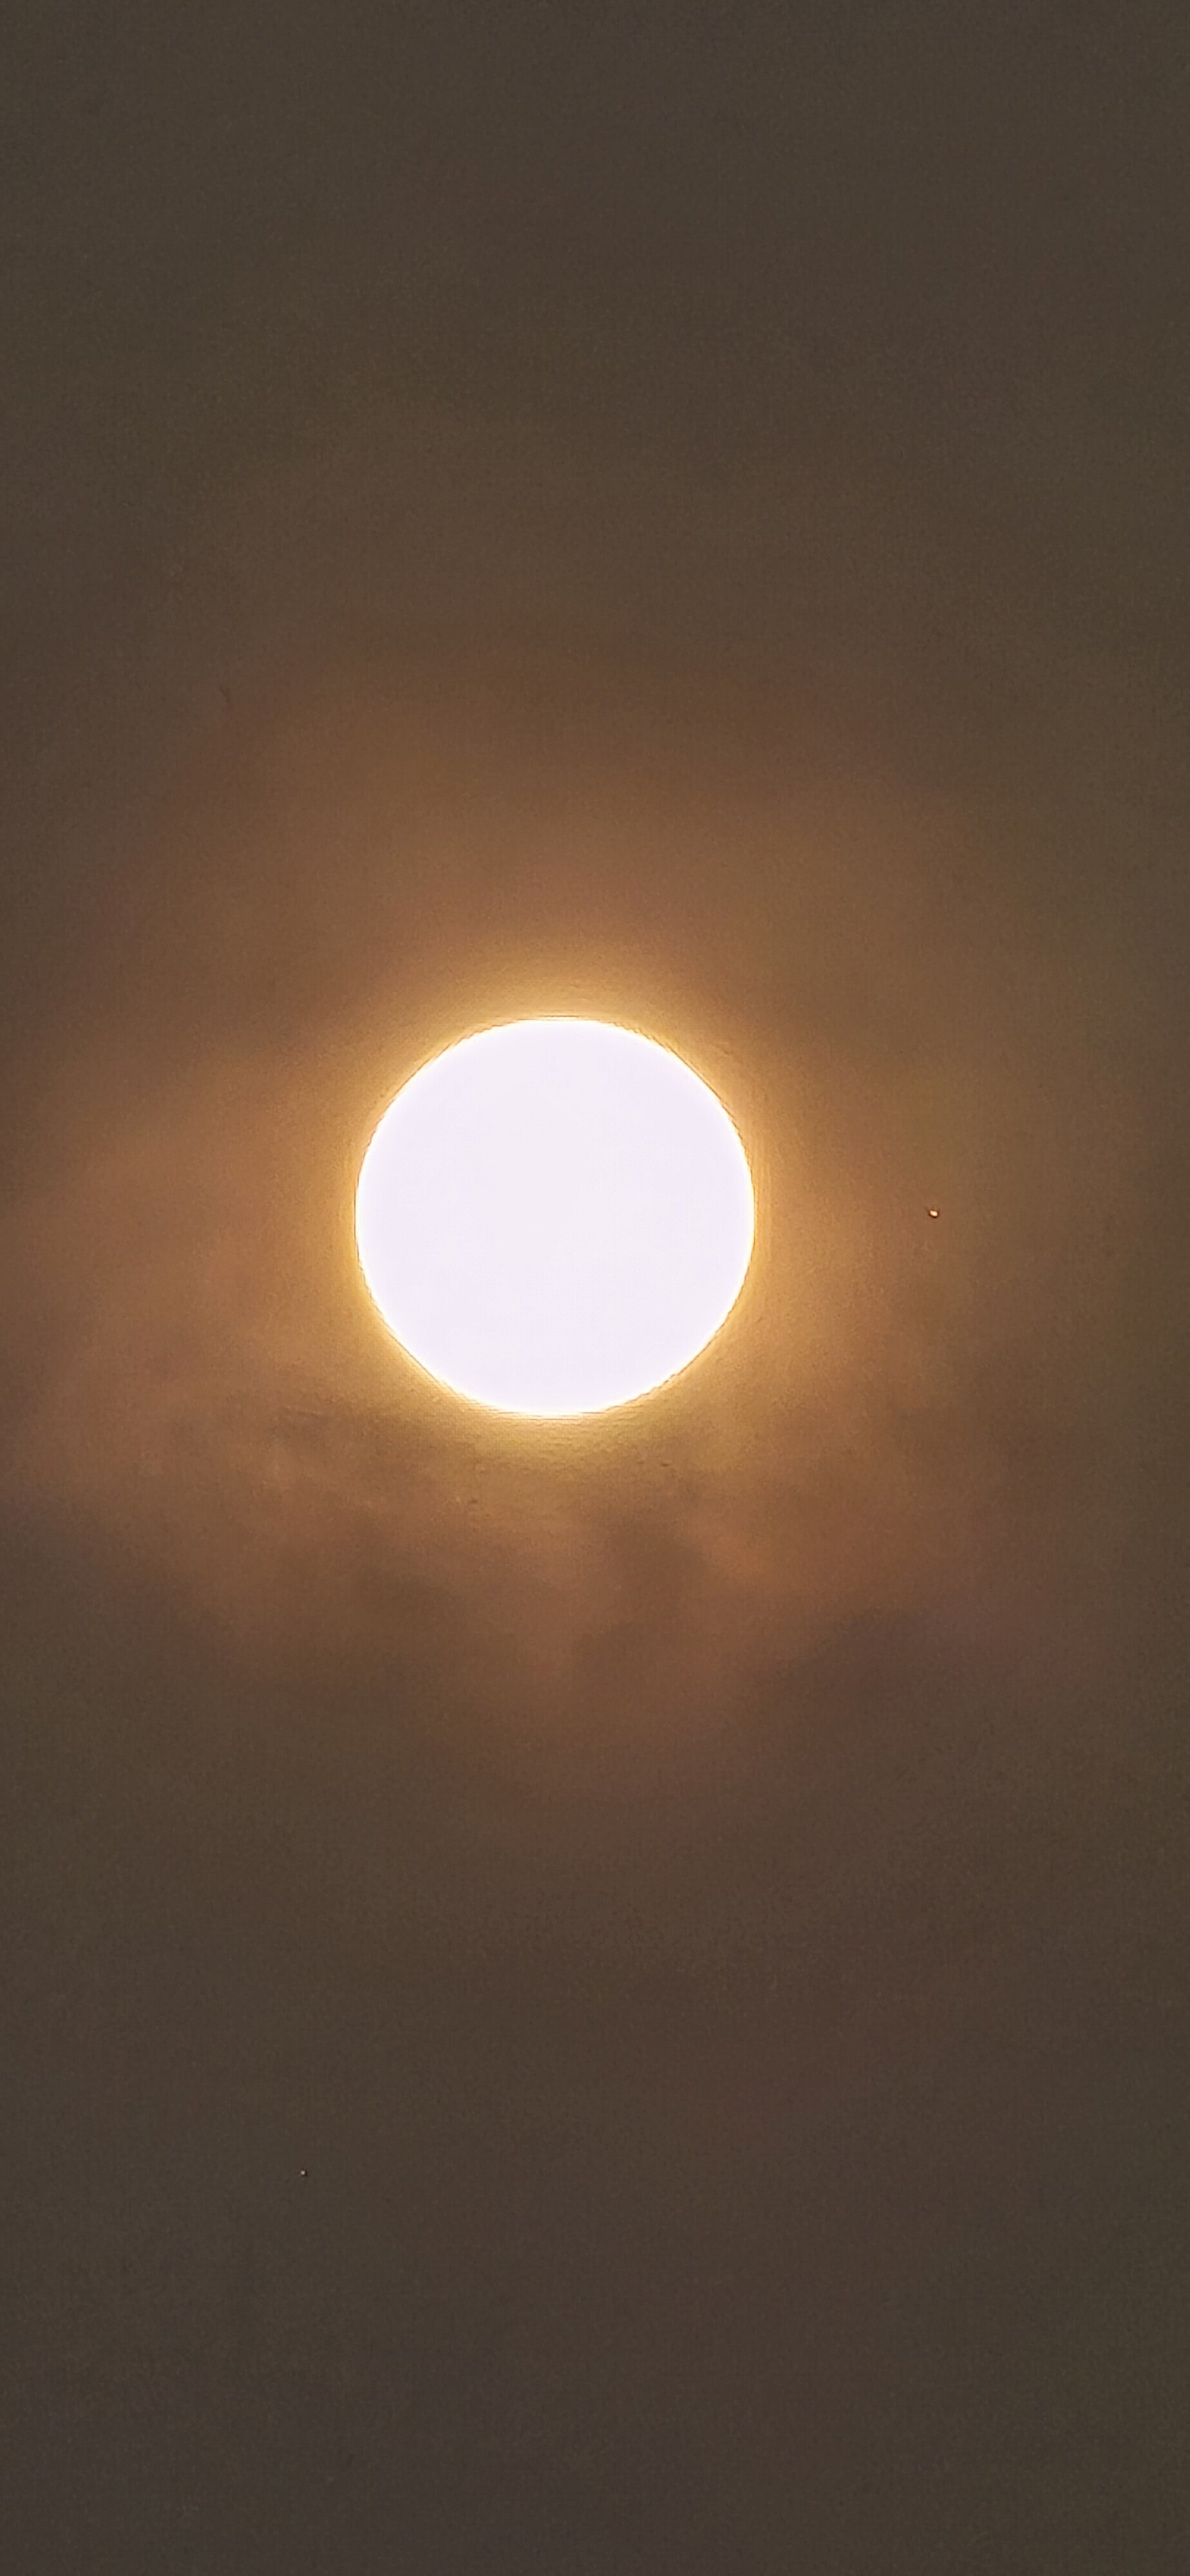
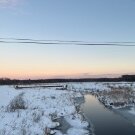
 was wild out pink/red at 5am as sun came up, and the thick of it is still SW of us
 -
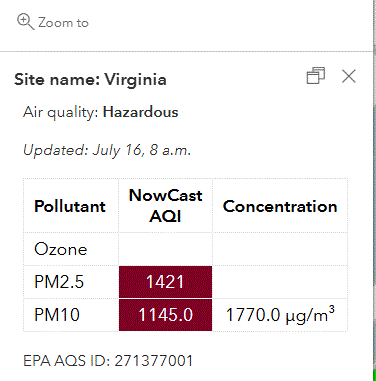
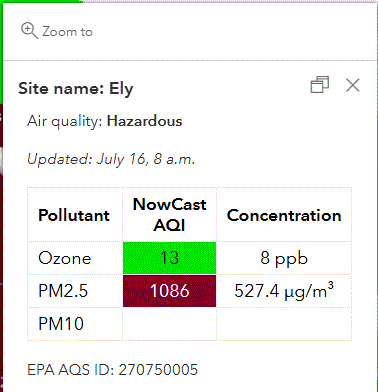
Radical. Hibbing /Virginia area just updated on the map. With HP overhead, air is stagnant atm.
-
2026-2027 Super El Nino
LakePaste25 replied to Stormchaserchuck1's topic in Weather Forecasting and Discussion
I mean this goes into the discussion with @40/70 Benchmark that past super Ninos were not torches for the Northeast due to “clean forcing” as in, less competing Nina-like convection in the Maritime Continent. It used to be more of a torch signal for the upper Midwest. Only modern super Ninos have been torchy in the NE. -
2026-2027 Super El Nino
GaWx replied to Stormchaserchuck1's topic in Weather Forecasting and Discussion
This map agrees with many of the official SE station temps being NN (and even BN in FL as Jacksonville and other official temps confirm). It also shows that the torch was centered in the Midwest and Plains with no torch near the E coast (ex: NYC was ~+1.3F, not a torch). Much of NE coast was only 1-2 F AN per the city by city official temps. -
Rode my motorcycle to/from the gym this morning. Definitely a hazy, orange sunrise. But I couldn't smell any smoke or anything, even on my bike, so it didn't really bother me.
-
(002).thumb.png.6e3d9d46bca5fe41aab7a74871dd8af8.png)
Central PA Summer 2026 Discussion/Obs Thread
ChescoWx replied to Voyager's topic in Upstate New York/Pennsylvania
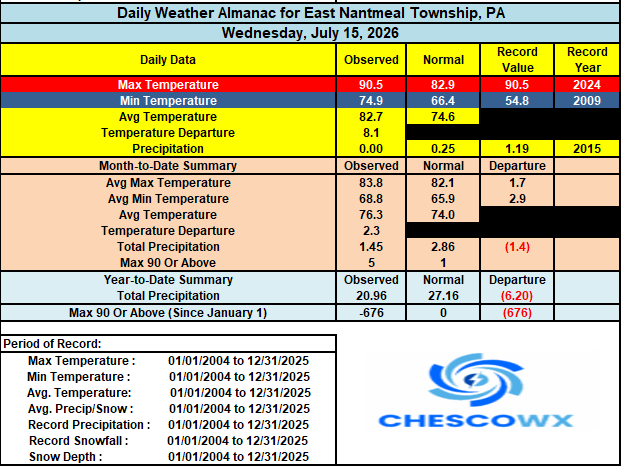
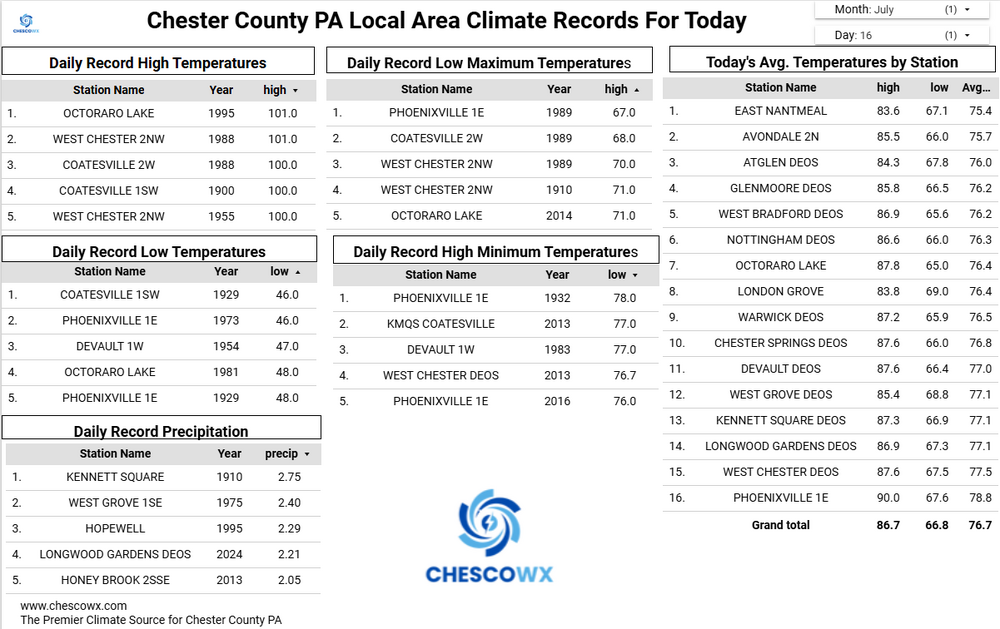
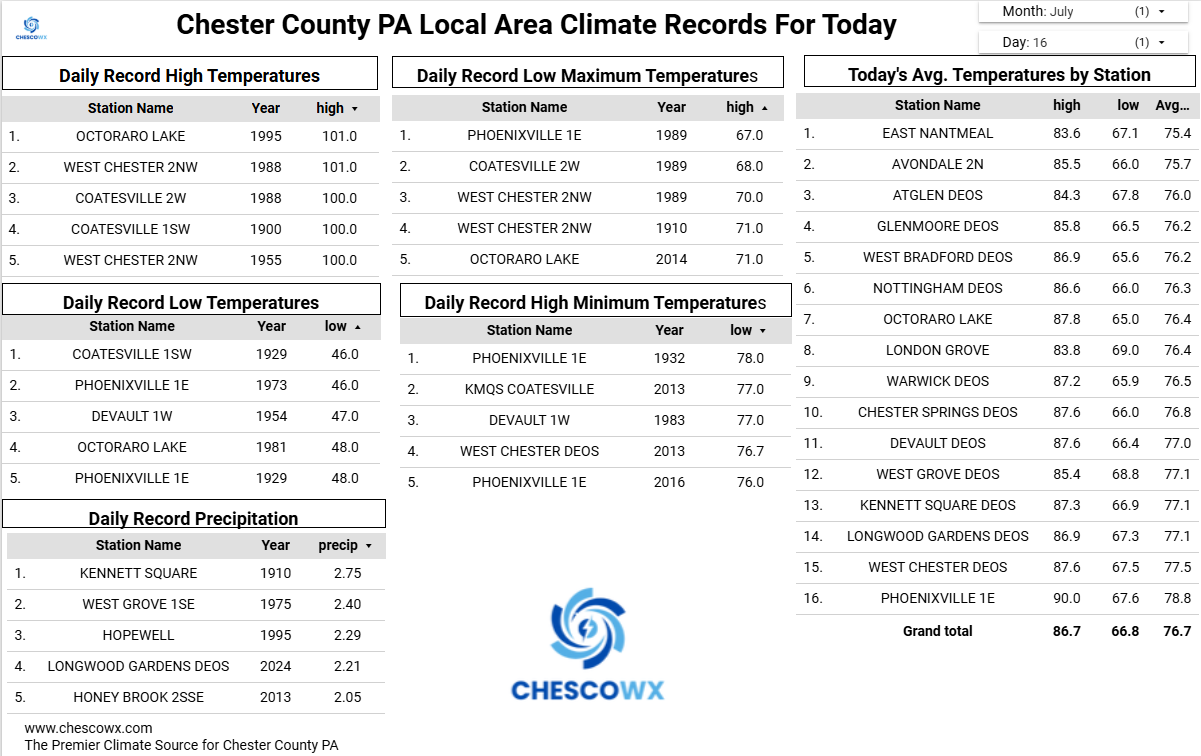
Yesterday was the 5th day this month and season that I recorded a 90+ temperature here in East Nantmeal. This is the 6th most 90+ days I have recorded in a summer season over the last 23 summers. The most being 10 in 2011 with the summers of 2004/2014/2015/2022/2023 seeing no days touching 90 degrees at all. Many spots maybe not the higher ridge locations like EN should reach 90 again although the well-advertised smoke from the Ontario fires could potentially limit daytime heating a bit. We cool back to near normal on Friday and below normal over the weekend and through Monday. Some small rain chances are around this evening but much better chances of widespread rain on Saturday into Saturday Night. We could see widespread totals of much needed rain of at least an inch.