
fountainguy97
-
Posts
1,267 -
Joined
-
Last visited
Content Type
Profiles
Blogs
Forums
American Weather
Media Demo
Store
Gallery
Everything posted by fountainguy97
-
 Look at that band. Crawling across TN
 -
Oh yeah. Sure it's not ideal and we will lose some accumulation but this isn't 12hrs of .5" rates. The heavy rates plus diving temps. Ground will be white before you know it.
-
This escalated quickly.
-
We do haha. 3-4" hr rates on alot of models. Usually we deal with 12+ hr storms but this one entirely falls in 6hrs. Ground temps won't matter much with rates like that as well as the rapid freeze into the low 20s Someone could very well end up with near blizzard conditions.
-
What do I have to do to get this to happen? 7" in 2 hrs
-
9 please
-
man that band wrapping up around a 999mb low would be crazy.
-
Gfs 18z more southern separation. Gets a little tilt on the southern end and boom back to the snowier solution. This is kuchera as well. A bit more tilt and it's a major major event.
-
Gfs reversing course this morning. 12z will be interesting. Kind of surprised about how slow the boards are about this event. A non-zero chance of atleast flurries for a decent size section of the SE. GFS has been very consistent with a threat. I'd rather have it on my side than EURO right now.
-
-
The FV3 is vicious. I've noticed it likes to go supercell crazy though. HRRR and NAM have much more of a linear storm mode vs discreet cells. but man this fv3 supercell is nasty.
-
Fall 2021 Thread (September, October, November)
fountainguy97 replied to Carvers Gap's topic in Tennessee Valley
I'm not saying there is a chance but.... most GEFS members bring a NW event on the tail end of this mid November system. still way out in no man's land for now . -
Fall 2021 Thread (September, October, November)
fountainguy97 replied to Carvers Gap's topic in Tennessee Valley
Whoever wished for fall is going to get their wish this weekend. Seems to be a permanent move to cooler weather if models are to be believed. @Carvers Gap I like what I'm seeing in long range models as we head into November. A few more weeks and the first high elevation event will be on the table. -
It probably doesn't mean anything but man I've been watching the CFS for the last week and it has been consistently SNOWY for much of TN. Idk what the CFS usually shows but I don't remember it being so snow happy in the past. It shows a start of winter in mid-November and that lines up with a lot of posters on other forums and my own analog work. I think we can expect a quick start of winter this year and hopefully some decent blocking in December. Fingers crossed we score before the new year because it seems our chances may start declining after the first half of January.
-
Fall 2021 Thread (September, October, November)
fountainguy97 replied to Carvers Gap's topic in Tennessee Valley
Gfs is consistently dropping a nice front through the region between the 22-24th. Euro also agrees. I would say this will be the first major "cold snap" of fall and will easily start our leaf season. This front is only 3-5 days away from pushing across the US. Seems like it's a legit pattern coming up. -
Unicoi County has been better off in the rain department than areas just to my west but it's catching us now. We are starting to get crispy here. My yard is a very dull green with that crispy look. If we don't get rain soon I am sure we will be in official drought criteria in the next couple of weeks.
-
Hey guys hope all is well. I tend to go quiet in the summer haha We have honestly had a pretty enjoyable summer over here in Unicoi County this year. We have yet to hit 90 this year with my high being 88.9. It looks like only 5 years in the last 60 went without a single 90+ day for Erwin. There is a lot of summer left though. This summer has been incredibly slow as far as thunderstorm activity compared to last year. Maybe last year was a crazy active year for this area.. but this summer has been all but dead for thunderstorms. My tempest station has only recorded 983 strikes within 22miles so far this July. Half of which happened yesterday. July 2020 had 13754 and I missed the first 6 days of the month. With the days slowly getting shorter I am feeling an inner longing for crisp fall days growing every minute.
-
Snow falling on green grass this morning... I guess I’ll take it
-
Spring/Summer 2021 Medium/Long Range Forecast Discussion.
fountainguy97 replied to John1122's topic in Tennessee Valley
we have been lucky over here in Unicoi county. Our rain has been spaced out just enough to avoid a lot of flooding, but todays inch is really pushing ditches and creeks to their limits. Good thing today wasn't 2-3 inches. Would require water rescues if that happened. -
Yeah this gust front is insane. Probably straight from dead quiet to 70+ winds in an instant.
- 164 replies
-
- 1
-

-
- tennesse
- mississippi
- (and 6 more)
-
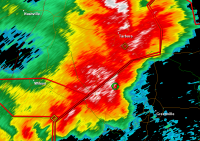
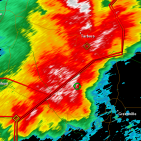
Beast of a storm heading toward Nashville.
-
I have the same feelings and my total is 20” on the year. It certainly doesn’t feel like an above average season. I’ve had 3 events completely bust. All 3 had models in agreement on decent snow 18hrs out then poof! the NW events really saved me this year because the standard storms haven’t panned out at all.
-
32.2 and rain for a few hrs now. Lol.
-
Easy come easy go I guess. From a non event to an event back to a non event over this way. Scorching at 47 this afternoon. Not a chance there is any major ice or any accumulation. hope you guys score! And then bring on the 70s.
-
Not sure I’ve ever seen the COD maps maxed for ZR like this. Yeah that’s 2” lol


