All Activity
- Past hour
-
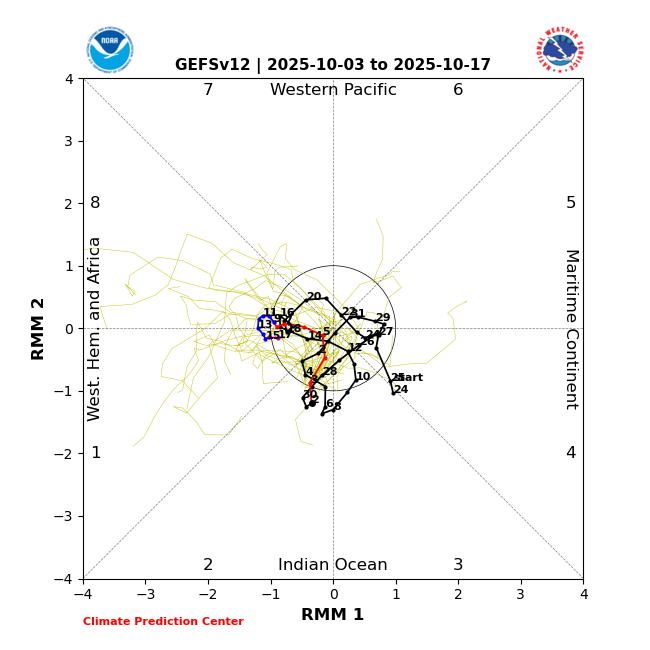
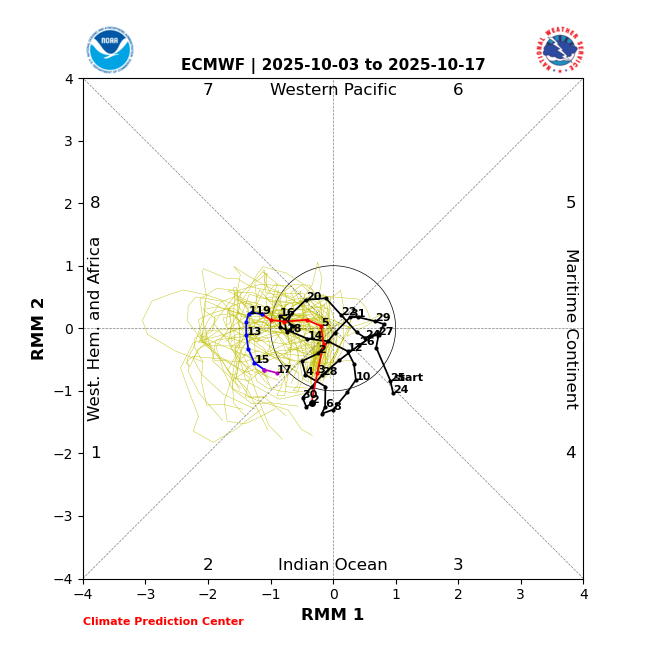
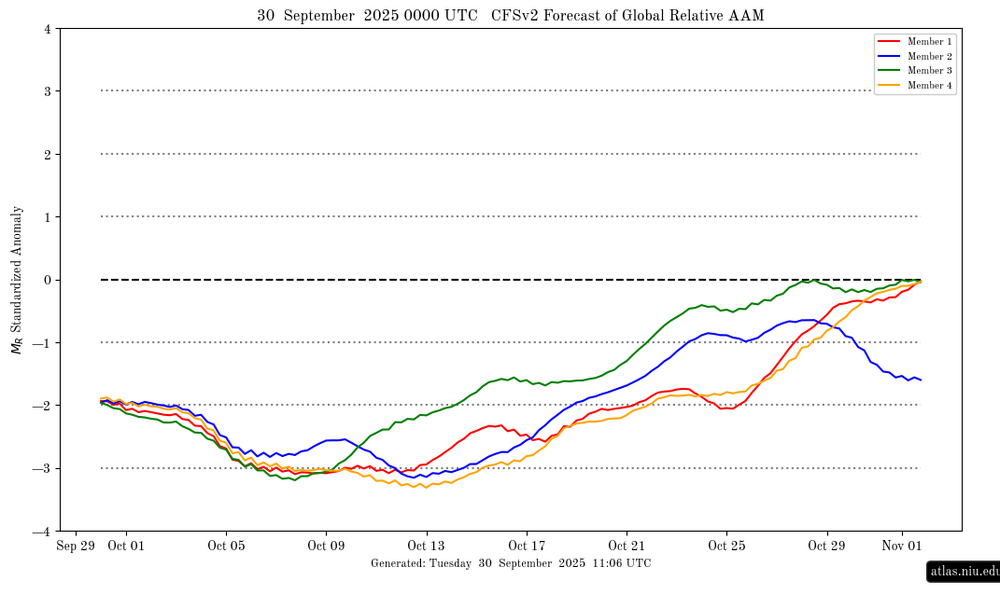
MJO is forecasted to continue to traverse mainly favorable phases meaning a resumption of activity would be favored pretty soon:
-
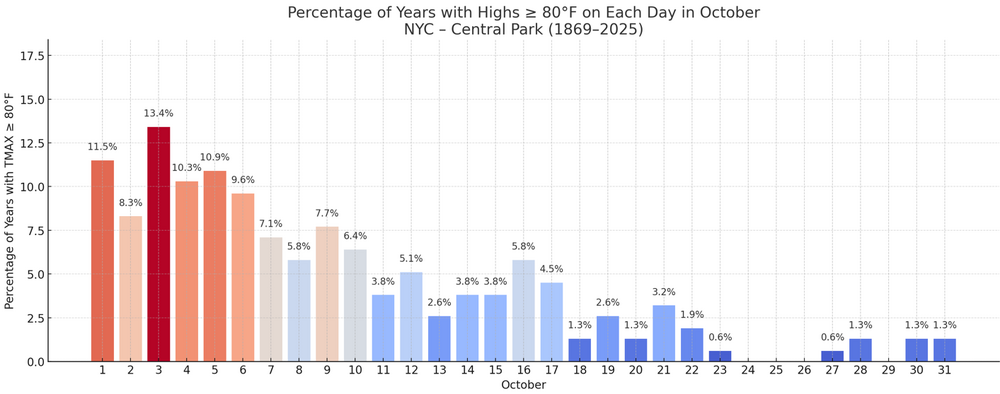
I love these stats and the way you visualize them. Put things in perspective. Can you also do >70F?
-
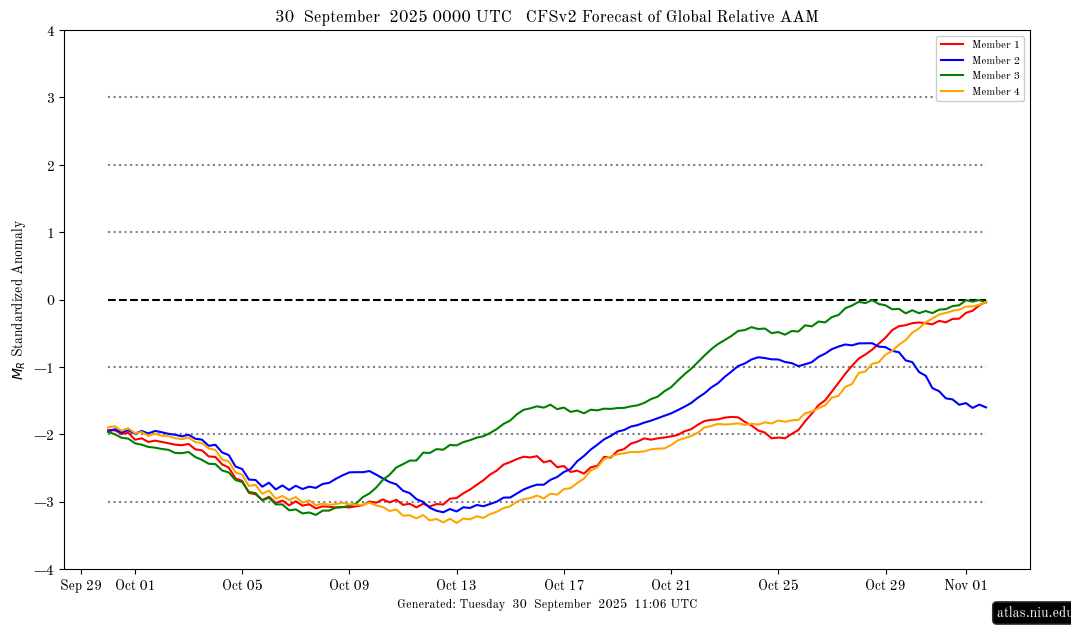
AAM forecast: Ninaish for at least most of month
-
He wasn't old enough to remember (and he still kind of isn't) but we did get above average snow in 20-21.
-
And tomorrow will be October 4th
-

Mid to long range discussion- 2025
WinstonSalemArlington replied to wncsnow's topic in Southeastern States
Next week begins seasonal, ends chilly -
Low of 50 at 7:32am, high of 77 at 3:38pm.
-
89.1 at mdw last hour. so close.
-
I’m here
-
I've created a new loop including all 500mb maps last month (it's 24-hour daily anomalies) https://great-lakes-salsite.web.app/Sep_2025_500mb_loop.html
-
41° for the low here. Haven't been to Grapevine in many years. My Uncle lived in Bedford and used to drive down and visit him yearly back in the late 80's/ early 90's. Was in Dallas area a few years back and was shocked at how much the area has grown. Traffic is nuts
-
In fairness 2-3 inches would be much above average for Arkansas.
-
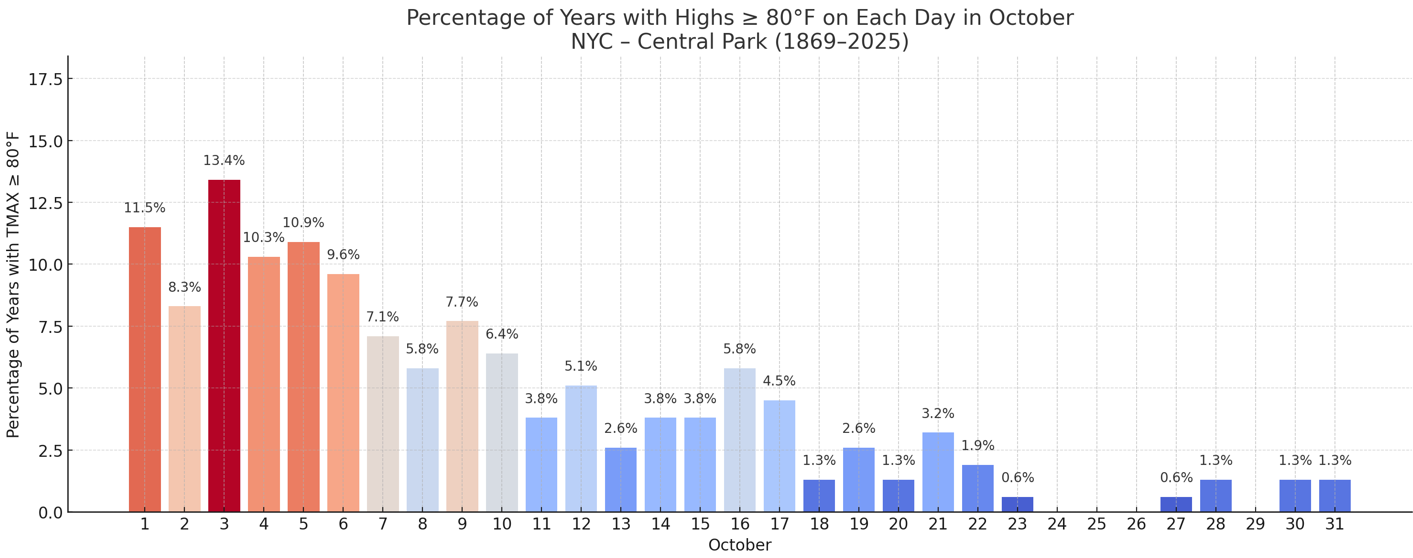
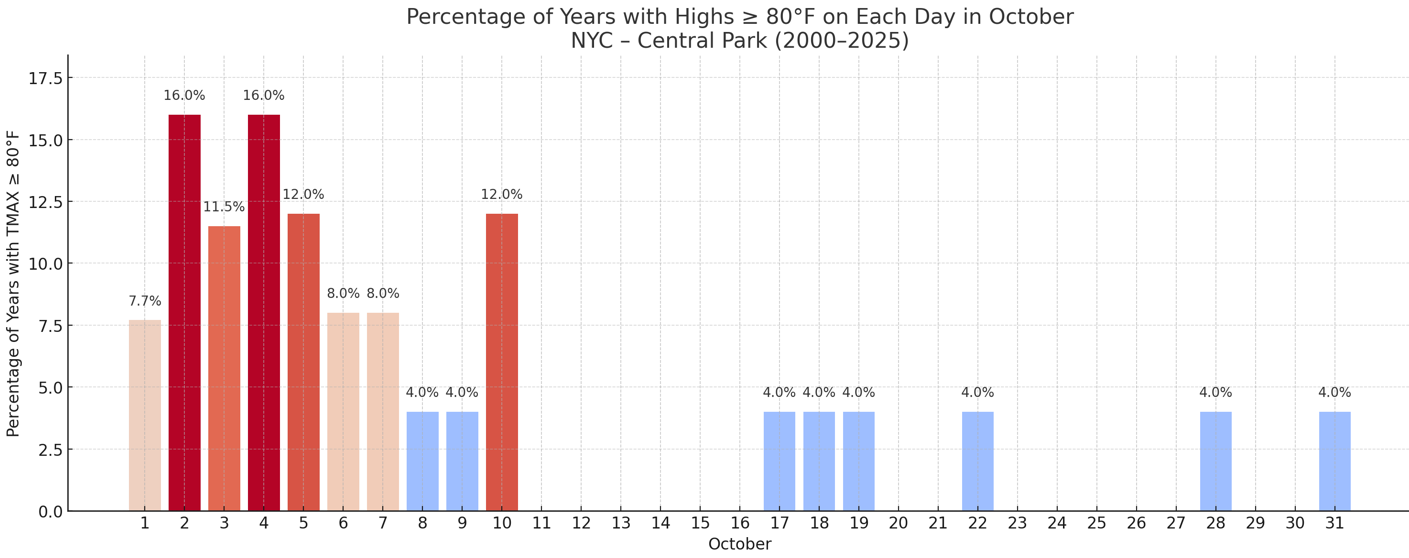
Frequency of 80° or above highs at Central Park: 1869-2025: 2000-2025: Note: October 4-31 is from 1869-2024.

- Today
-
Most recent Ninas in the last 20 years have included at least one cold and snowy period of 2-4 weeks. Although much of the rest of the winter is pretty meh. Based on ENSO and other factors, I think one of the “good” Ninas is probably the ceiling for this year. But a dead ratter is also well within the realm of the possible.
-
I don't hate Nina's at all. We seem to do relatively well in the lowlands during Nina's. The past two winters were respectable IMBY. Especially last winter.
-
NIce day, 70 the high here.
-
But more snow than last year. That would be a respectable Nina winter if so. Outside the 95-96 fluke, high teens snowfall totals for most of the area is a “good” Nina. Honestly I’d take a repeat of last winter. January was a really good month and we had the late February heartbreak that could have made it an excellent year if it went the other way.
-
Today got off to another chilly start. Many areas outside New York City again saw the temperature start out in the 40s with colder spots recording 30s. Low temperatures included: Bridgeport: 48° Danbury: 41° Islip: 47° Montgomery: 35° New Haven: 45° New York City-Central Park: 54° New York City-JFK Airport: 51° New York City-LaGuardia Airport: 57° Newark: 51° Poughkeepsie: 39° Sussex: 38° Westhampton: 35° White Plains: 47° In parts of the Upper Midwest and Northern Plains, daily and monthly high temperature records were set. Green Bay (88°) and Rapid City (96°) tied their October monthly records. Philip, SD reached 98°, breaking its October monthly record of 97° for October 1, 1953. The New York City area will be on the fringes of this exceptionally warm air mass this weekend into early next week. A warm weekend lies ahead. Highs will generally reach the upper 70s to lower 80s. The warm weather will continue early next week. Another strong cold front will likely cross the region around midweek. The frontal passage will likely bring some showers or thundershowers. A shot of much cooler air will follow. The ENSO Region 1+2 anomaly was -0.1°C and the Region 3.4 anomaly was -0.5°C for the week centered around September 24. For the past six weeks, the ENSO Region 1+2 anomaly has averaged -0.12°C and the ENSO Region 3.4 anomaly has averaged -0.42°C. La Niña conditions will likely develop during mid- or late-autumn. The SOI was +5.48 today. The preliminary Arctic Oscillation (AO) was +0.374 today.
-
Warm/wet and cold/dry obviously
-
First September DAY failed to reach 90 degrees since September 2020. The last 90 degree day this year was on August 16th, the earliest last one since August 16, 2009 and August 16, 1997.
-
Anyone know how to contact @Kevin W? His PMs are full.
-
Next three days coincide with warmest three-day interval for NYC highs in October (1941) 88 _ 94 _ 90, all daily records. Here are the rest of the NYC records ... <<<< OCTOBER >>>> For 2d rainfalls, which always end on date cited, ** indicates all rain fell only on that date, and ^ indicates all precip fell on the previous day while none fell on date listed. ... * indicates notes at bottom of table. In the snowfall column before it begins listing on 10th, some other rainfall events are noted. In Low min, a value in brackets indicates a max for that date not a record low max as well. Some low mins have an associated record low max (e.g., 5th 1881, after all that warm weather in Sep 1881). DATE ____ Hi max __ Hi min _____ Low max ____ Low min __________ Max prec (r) _ Max 2d rain _ Max snow (10th to 31st) Oct 01 ___ 88 1927 __ 72 1881, 1954 _ 51 1899 ___ 36 1947 (60) ______4.98 1913 ___ 4.98 1913*__ 2d rain 3.56 2010 (1.10+2.46) Oct 02 ___ 93 2019 __ 72 1954 ______ 49 1899 ___ 39 1886 (54) ______2.16 1929 ___ 5.28 1913 __ Oct 03 ___ 87 1919 __ 68 1954, 69 ___ 47 1888 ___ 38 1888,99,1974 __1.84 1869 ___ 2.16 1929**_ Oct 04 ___ 88 1941 __ 75 1898 _______ 51 1883 ___ 37 1888 (55) ______4.05 1877 ___ 4.05 1877*__ 2d rain 3.90 1869 (1.84+2.06) Oct 05 ___ 94 1941^__ 75 1898^______50 1881 ___ 35 1881 ___________1.99 1995 ___ 4.07 1877 __ Oct 06 ___ 90 1941 __ 71 1910 _______ 50 1935 ___ 36 1881 (60) ______2.70 1871 ___ 2.70 1871*__ 2.39" R 1955 (1d) Oct 07 ___ 88 1944 __ 70 2005 ______ 48 1873 __ 39 1954, 99 _______4.09 1972 ___ 4.38 1972 __ Oct 08 ___ 87 2007 __ 72 2017 ______ 45 1988 ___ 37 1988 __________ 4.30 1903 ___ 4.49 2005 (0.23+4.26) ^ Oct 09 ___ 86 1916 __ 71 2017 _______ 43 1888 ___ 37 1888, 1988 ____ 7.33 1903 ___11.63 1903 __ Oct 10 ___ 91 1939 __ 71 2018 _______ 43 1925 ___ 35 1888 ___________2.44 1871 ___ 7.50 1903 __ Tr sn 1925,79 Oct 11 ___ 85 1949 __ 69 2018 _______ 48 1951 ___ 34 1964 (55) ______3.06 2002 ___ 3.25 2002 __ Oct 12 ___ 86 1928,54 _ 67 1954 ____ 49 1875,87,91_35 1876 (52) ______4.26 2005 __ 4.39 2005, 4.34 2002 _ 3.40 1983 1dR Oct 13 ___ 87 1954 __ 69 1990 _______ 47 1874 ___ 34 1875 (51) ______2.75 2005 ___ 7.01 2005 __ Tr sn 1937 Oct 14 ___ 84 1920 __ 68 1990 _______ 45 1889 ___ 37 1988 (53 13th)_ 1.76 1995 ___ 4.29 2005 __ Oct 15 ___ 84 1956 __ 69 2014 _______ 46 1876 ___ 32 1876 __________ 1.70 1943 ___ 1.95 1995 __ 0.5 sn 1876 Oct 16 ___ 87 1897 __ 67 1897 _______ 46 2009 ___ 34 1876 (49) ______2.15 1974 ___ 2.35 1974 __ (all entries snow from here on) Oct 17 ___ 90 1938 __ 67 1928 _______ 47 1970 ___ 33 1886 (47 16th) _2.28 1936 ___ 2.30 1936 __ Trace 1929 Oct 18 ___ 82 1928 __ 69 1928 _______ 45 2009 ___ 35 1929,39,74 _____2.45 1911 ___ 3.24 1932^__Trace 1926,72 Oct 19 ___ 85 2016 __ 68 1905 _______ 43 1972 ___ 30 1940 (45) ______4.35 1996^___ 4.35 1996*__ Trace 1940,72 Oct 20 ___ 80 1947,69 _ 65 1916, 84 ___44 1974 __ 31 1974 ___________2.78 1989 ___ 4.50 1996^__ 0.5 1952 Oct 21 ___ 84 1920 __ 64 1947, 79 ___ 43 1888 ___ 31 1871 (52 20th) _2.17 1995 ___ 2.78 1989^_ Oct 22 ___ 88 1979 __ 67 1979 _______ 43 1887 ___ 30 1940 (51) ______1.51 2014 ___ 2.17 1995^ _ Oct 23 ___ 85 1947 __ 67 1979 _______ 42 1889 ___ 32 1969 (43) ______2.97 1912 ___ 2.99 1912 __ Oct 24 ___ 79 2001 __ 67 2017 _______ 44 1889 ___ 31 1969 (51) ______2.51 1917 ___ 3.92 1923* __Tr 1960 Oct 25 ___ 79 1963 __ 69 1908 _______ 40 1879 ___ 29 1879 __________ 3.30 1913 ___ 3.94 1913 __ Oct 26 ___ 78 1963,64 _66 1908 ______ 39 1962 __ 30 1869, 79 ______ 3.40 1943 ___ 3.54 1943 __ Tr 1903,28,62 Oct 27 ___ 82 1963 __ 66 1908 _______ 39 1869 ___ 28 1936 (43) ______1.88 2003 ___ 3.55 1943 __ Tr 1903,44 Oct 28 ___ 83 1919 __ 64 1971 ________ 41 1876 ___ 29 1976 (42 27th)_ 2.49 1953 ___ 2.54 2006 __ Tr 1925,34,65 Oct 29 ___ 78 1971 __ 63 1946 ______43 1909,25,52_ 31 1925 (43) ______3.67 1973 ___ 3.67 1973**__ 2.9 2011 Oct 30 ___ 82 1946,61 _ 64 1918, 46 ___ 38 1925 __ 31 1925 __________1.64 1917 ___ 3.89 1973 __ 0.8 1925 Oct 31 ___ 81 1946, 2024 __62 1881, 1961 _ 41 1869 _29 1887, 1925____2.41 1956___ 2.41 1956**__ (no snow) -- - - - - - - - - - - - - - - -- ^ 5th _ Min with the extreme Oct max of 94 in 1941 was 71. Max with the extreme high mins in 1898 were 80, 81. ^ 7th to 14th _ 2005 had 13.25" rain in eight days with two amounts of 4.26" (8th,12th) and another 4.29" 13th-14th. ^ 18th _ 2d max rain 1932 3.24" (1.15+2.09) also 2.89" 1927 (0.98+1.91). Both greater than 1911 which had zero added. ^ 19th _ 3.12" R in 1966 (1d) .. 3.72 2d 1911 (2.45+1.27). ^ 20th _ 4.19" 2d rain 1989 (1.41+2.78) ^ 23-24 _ 3.92" 2d rain 1923 (2.45+1.47) ^ 31st _ 2024 min 61F not a record
-
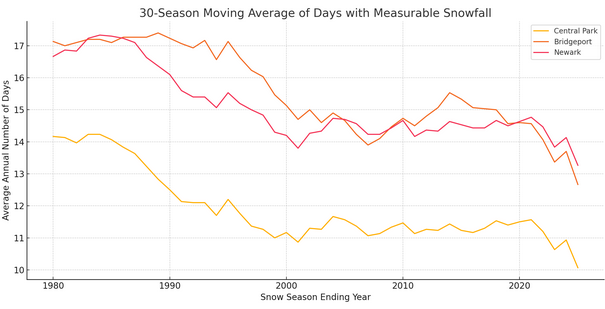
Your temperature charts were really eye opening to me. It is really shocking just to see how short our “winters” have become.
-
What Don said. A big part of the decline in winter is the shoulder seasons are no longer cool. Hell you just had Liberty saying September was fallish. Our AC worked just as much according to our smart system as it did in August. I like 80s and blue sky just as much as the next person but I really do love winter. I know you are happy with just big snows a few times a year but I enjoy winters that have some staying power. My son is 7 and has never seen an above average winter. Also, to add, southern NY now sees year round tick activity as the norm. We alway tend to have lows above 40 now for at least part of each winter month (and not just a stray warm night). This is stuff that historically did not happen.
-
I believe he's describing the declining number of snow days.