All Activity
- Past hour
-
70 here what a stretch
-
Would be nice to get some snow in Denver with the next storm system. The only model hinting at it has been the Canadian. Every other one just has a bunch of rain. There are no obvious storm signals past this weekend into early next week either.
-
 legitimate canadian pharmacy: CanPointeRx - the canadian pharmacy
 -

Winter 2026-2027 Seasonal Outlook
WinstonSalemArlington replied to WinstonSalemArlington's topic in Southeastern States
-
70 here after a frosty morning
-
Ha, came here to post that. You mean we aren't going to get two 2" rainstorms 3 days apart around Nov 5th? The ensembles seem vaguely interested in the period.
-

Central PA Autumn 2026
Itstrainingtime replied to canderson's topic in Upstate New York/Pennsylvania
One more week of dry weather. Meanwhile, out west, ski resorts are on the verge of opening for the 26-27 winter season. -
28 to 70
- Today
-
Same boat, any water that does get into / into the grass is not moving very much. This last 2 weeks has been perfect grass growing weather. The highs in the 60/70s allows growth but not parching, and the lows in the 30/40's allow a nice "rain dew" every morning from the atmosphere to keep the growth going.
-
I haven’t looked at the euro, but the 12z gfs should keep @JenkinsJinkies off the ledge for the afternoon. Of course, if you take it literally, then you’re signing up for potential disappointment.
-
70!
-
33.8 last night, a beautiful 68 now with no clouds
-
Yes, I am still mowing twice a week because of this. Although several 70's and near 80 this week may start really parching the grass. Having to water all the plants/veggies every other day right now.
-
They’re blocking the sun here, but we should clear back out soon. Back to 62° after hitting 68°.
-
Stupid clouds.
-
canadian pharmacy compare: CanPointe Rx - canada rx pharmacy world
-

2026-2027 Record-breaking El Nino
snowman19 replied to Stormchaserchuck1's topic in Weather Forecasting and Discussion
-
At least we're solidly into low sun angle season. ET losses are pretty minimal right now with the cooler than average temps.
-
lol JLC is wound up today. Hard to argue with much of what he is saying.
-
December 22nd though it feels like I’m a touch early. I’ll stick with it. .
-
Tis the season
-
Got a long weekend in back home from Texas, and my god it was beautiful weather. If that's boredom, give me boredom every day for all of Oct and most of Novie.
-
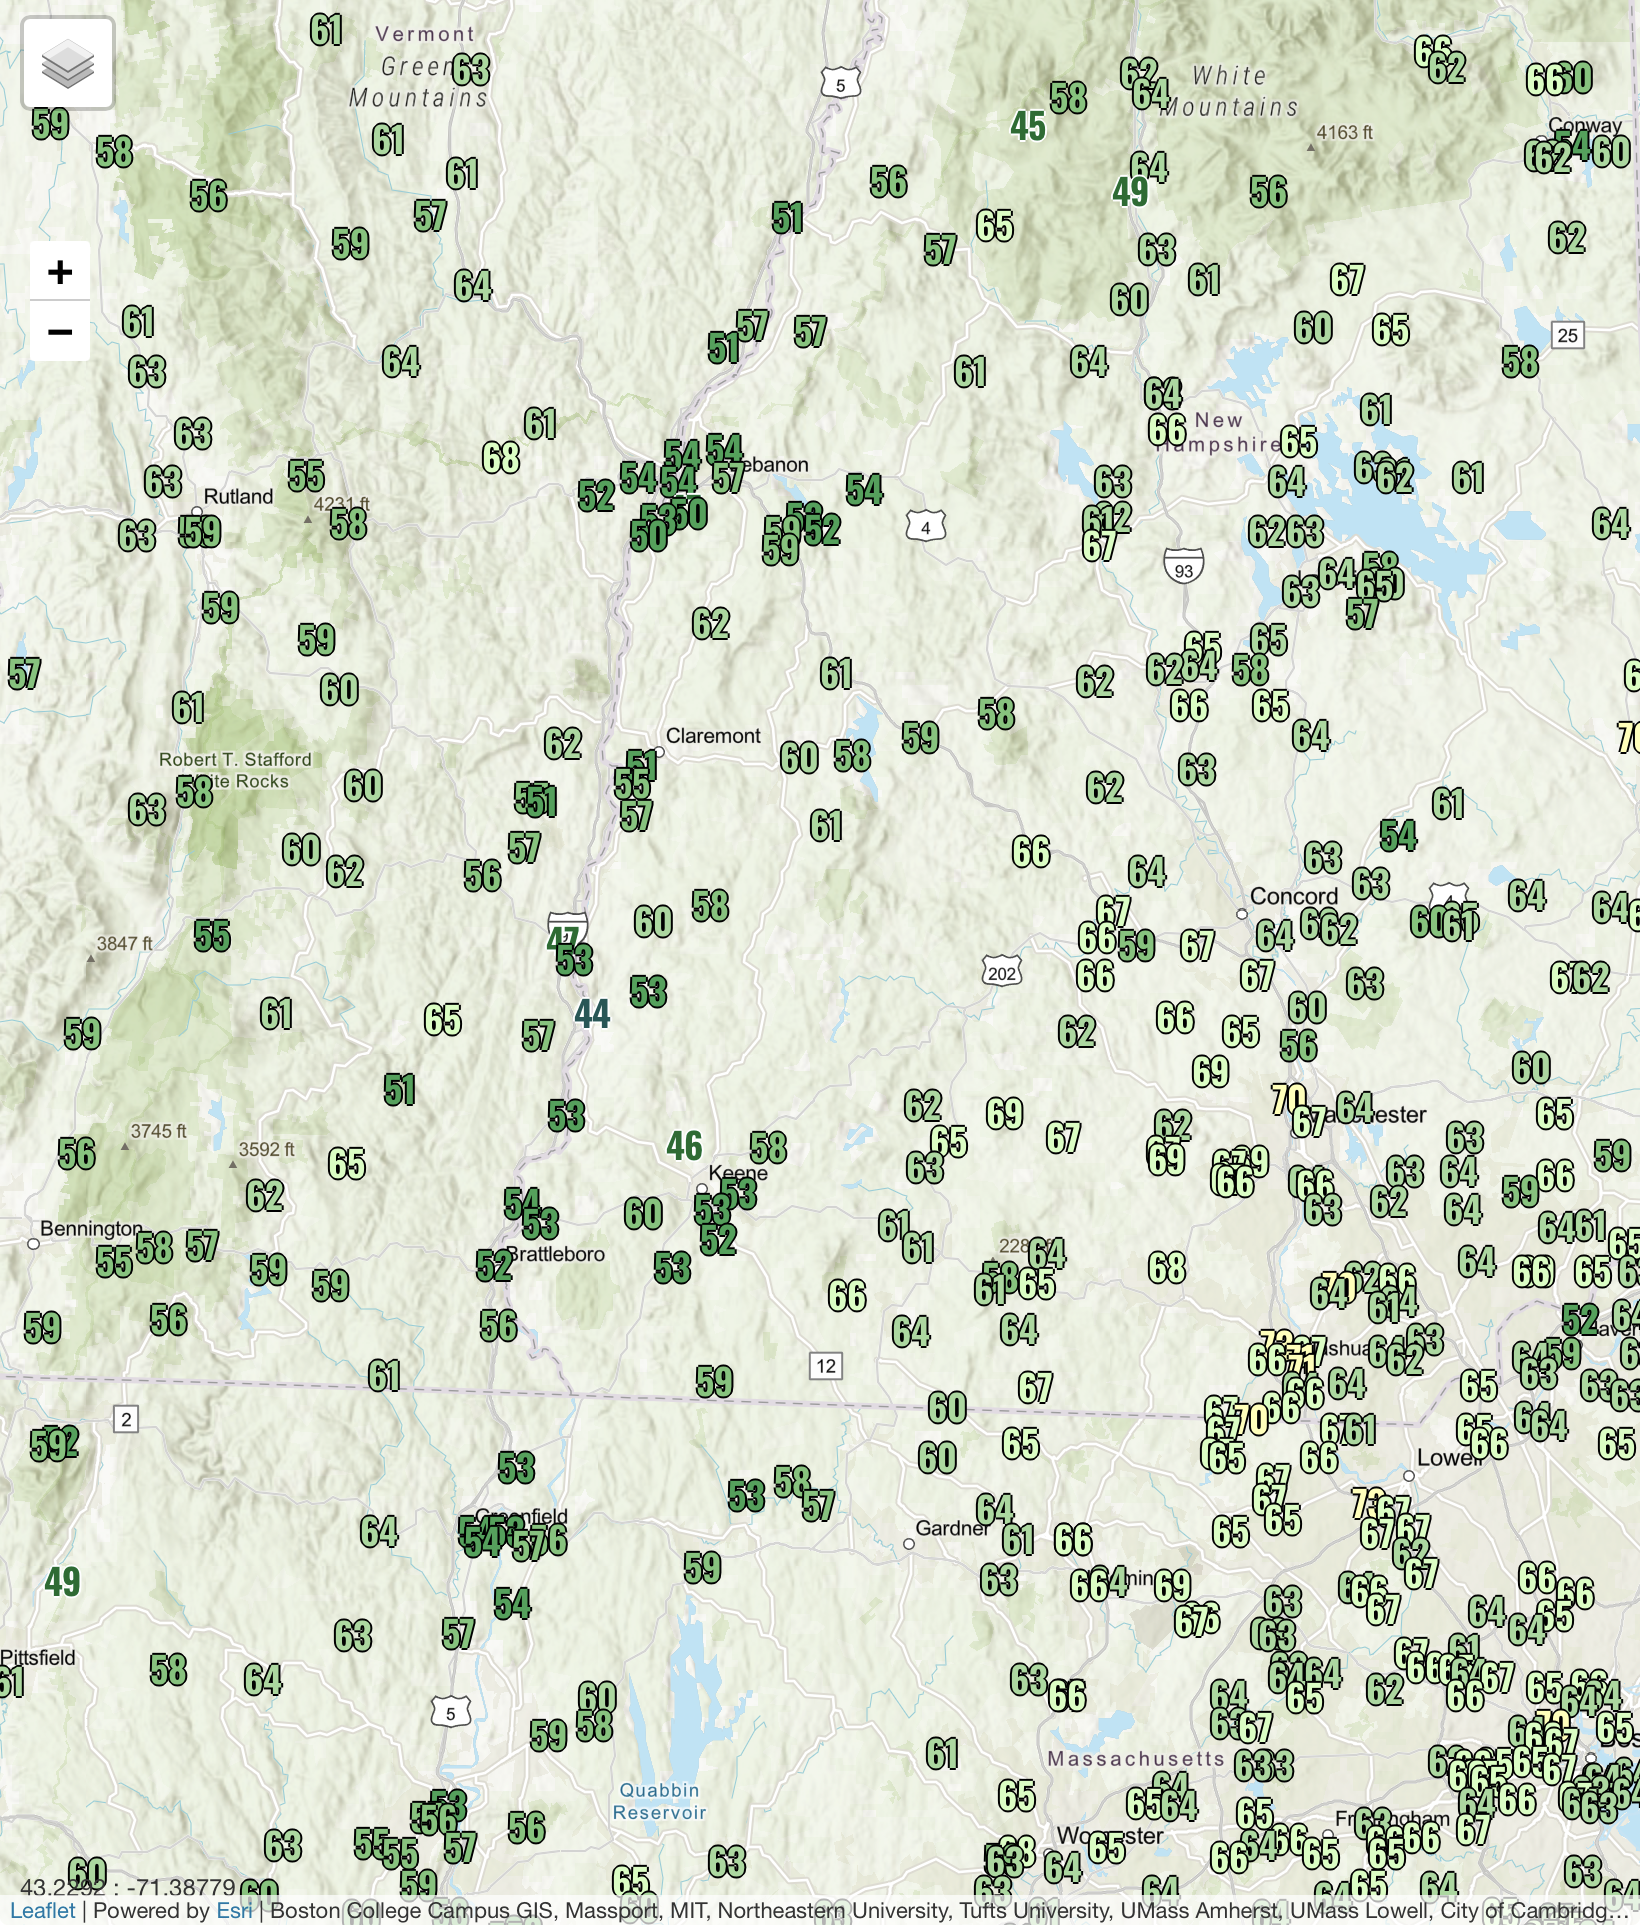
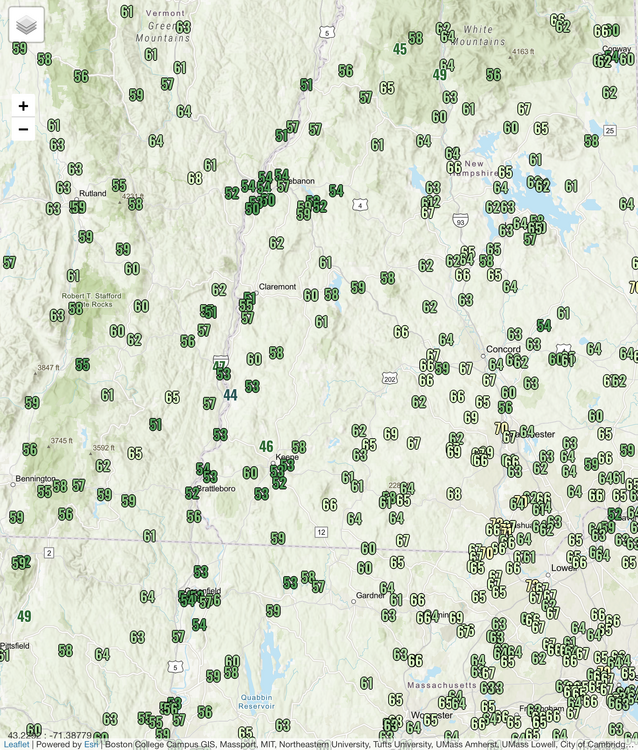
It’s kind of crazy how it won’t mix out. Still upper 50s at 1500ft and upper 40s down in Stowe Village PWS spots. MVL holding at 48F too. Even some spot 60F above 1,200ft.
-
Kinda cool to see the CRV still wedged after noon despite sunshine.
-
41 with some very light le. Feels like the October I know but it's not gonna last, quick warmup follows.