All Activity
- Past hour
-
The summer of 1996 was the last time that JFK had over 50 days staying under 80° for a high temperature. Most Days With High Under 80°Time Series Summary for JFK INTERNATIONAL AIRPORT, NY - Jun through Aug Click column heading to sort ascending, click again to sort descending. 1 1967 66 0 2 1996 55 0 3 1956 54 0 4 1950 52 0 5 1979 51 0 - 1954 51 0 - 1951 51 0 6 1992 50 0 7 1982 49 0 8 2000 48 0 9 1989 47 0 - 1977 47 0 - 1975 47 0 - 1953 47 0 10 1958 46 0 - 1957 46 0
-
Augdewst 2026: Summer's Last Stand
Go Kart Mozart replied to Prismshine Productions's topic in New England
I am curious. Are there a lot of mask wearers at Tanglewood? -
Augdewst 2026: Summer's Last Stand
dendrite replied to Prismshine Productions's topic in New England
64° -DZ 0.05” breezy Kinda feels like mid September -
It wouldn't surprise me if if it was because the anomalies under the core of that ridge are going to dwarf the cooler anomalies in association with the STJ to the south and east. There is a TON of heat being displaced.
-
Augdewst 2026: Summer's Last Stand
CoastalWx replied to Prismshine Productions's topic in New England
Those drought maps are classic. Shows the exact opposite of what is occuring. -
Augdewst 2026: Summer's Last Stand
CoastalWx replied to Prismshine Productions's topic in New England
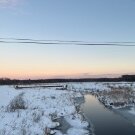
Opened up my shades and this is what I saw looking right at me. -
0.49 yesterday, 0.11 since midnight today
-
2026-2027 Record-breaking El Nino
bluewave replied to Stormchaserchuck1's topic in Weather Forecasting and Discussion
Yeah, we aren’t going to know the exact location of the warmest winter departures until each month gets underway. +10 months have been fairly common during super El Niño events since 1997-1998. Areas adjacent to the +10s also had very high temperature departures. Regions with the most overlapping high departures across multiple months finished the warmest for DJF. But since all seasonal models default to general climatology due to long range forecast uncertainty, none of the months were forecast ahead of time to my knowledge. The most common locations have been from the Upper Plains and Midwest across to the East. December 2015 was the most extreme for the aerial coverage and magnitude of the 10+ area. As early as November 22, 2015, the EPS weeklies were showing just moderately above average temperatures across the Northern Tier for December. So the long range models gave no indication of what occurred. +10 months super El Niño months since 1997-1998 Dec 1997 Upper Plains to Upper Midwest Jan 1998 Upper Plains to East Feb 1998 Upper Plains to East Dec 2015 Much of East Feb 2016 Upper Plains Mar 2016 Upper Midwest Dec 2023 Upper Midwest Feb 2024 Upper Midwest -
Central PA Summer 2026 Discussion/Obs Thread
mahantango#1 replied to Voyager's topic in Upstate New York/Pennsylvania
1.07 beneficial rainfall from the event. Monthly total is now 2.58 - Today
-
A disappointing 0.11” for 8/16 imby/Columbia. 2.22” for August thru 8/16.
-
Central PA Summer 2026 Discussion/Obs Thread
Itstrainingtime replied to Voyager's topic in Upstate New York/Pennsylvania
1.15" of rain total. .22" of that since midnight. -
Another boring and lame event here in mby. What's up with the horrible forecast this season. Every single one of these events has failed this season. My forecast was for up to 2". I got .12
-
Augdewst 2026: Summer's Last Stand
jlauderdal replied to Prismshine Productions's topic in New England
63/62 .32 in the high terrain. Took a trip to Tanglewood yesterday, as expected, a few raindrops caused some of the lawn crowd to flee for the cars, not the bravest group of people you will ever see. This weekend looks like it has potential. -
I don't think area burned is telling you much about CC; because, other human factors are driving the long-term trends. Per Our World in Data, the vast majority of wildfires occur in grassland and savanna in the sub-tropics and tropics, roughly 50% in Africa. Forest burning is a small portion of area burned in all regions. Our World in Data cites a Science paper that attributes the long-term decrease in area burned to the spread and intensification of agriculture. In Europe and North America, reduction in cropland burned is another important long-term trend. Have to look at other stats to see the effect of climate change. The blog I linked makes the point that the intensity of the largest fires is increasing due to climate change. Big, intense fires are the most problematic but aren't well captured by the area burned stats. Here's a recent paper that finds that a small number of extreme fires are having an out-sized impact on the forest ecosystem in western and boreal North America. https://www.science.org/doi/full/10.1126/sciadv.aeg5802
-
66°/64° and 0.03 in the bucket. Tropical morning.
-
Convergence will be almost non existent but a weak front approaching at peak heating should be enough to encourage at least some convective activity late this afternoon and early tonight. Charleston West Virginia experienced some flooding with 4.08" Sunday. My .71" was the most since July 4!
-
Central PA Summer 2026 Discussion/Obs Thread
pawatch replied to Voyager's topic in Upstate New York/Pennsylvania
68 degrees this morning Picked up .32” of rain yesterday. -
August 2026 in a nutshell: Here, 1.29" more of rain now puts us at 7.85" for the month so far, now currently the 3rd wettest August on record. Top 10 Wettest Augusts (KDAY)1. 8.03" - 19742. 7.95" - 19793. 7.85" - 2026 (as of 8/16) 4. 7.54" - 19955. 6.98" - 19786. 6.64" - 19127. 6.59" - 1926 8. 6.42" - 19829. 6.40" - 200110. 5.56" - 1906
-
That’s bizarre. My PWS has recorded almost 4” in just the last 10 days (a good chunk of it from 2.71” on August 9)
-
We actually managed a low of 39.9 at home last night - first 30s since June 10
-
Augdewst 2026: Summer's Last Stand
OrangeCTWX replied to Prismshine Productions's topic in New England
-
Had a very small cell move through Gastonia that laid down some heavy rain.
-
I was monitoring this storm. Baseball sized hail was also reported. The radar returns were like nothing I've ever seen.
-
Public Information Statement National Weather Service Baltimore MD/Washington DC 954 PM EDT Sat Aug 15 2026 ...NWS Damage Survey for 08/14/26 Charlottesville Thunderstorm Wind Event... .Charlottesville, VA Thunderstorm Wind Event... Peak Wind /E/: 90 mph Path Length /statute/: 2.4 miles Path Width /maximum/: 1.4 miles Fatalities: 0 Injuries: 0 Start Date: Aug 14, 2026 Start Time: 5:33 PM EDT Start Location: Greenbrier Community / Charlottesville / VA Start Lat/Lon: 38.065 / -78.481 End Date: Aug 14, 2026 End Time: 5:42 PM EDT End Location: Darden Towe Park / Charlottesville / VA End Lat/Lon: 38.041 / -78.448 Survey Summary: On the evening of August 14th, 2026, a powerful thunderstorm began to develop over southeastern Rockingham County out of a cluster of otherwise innocuous showers. The storm would rapidly intensify into a powerful supercell thunderstorm before reaching the Blue Ridge. As the storm crossed into northwestern Albermarle county, particularly around Free Union, the storm would go through a period of weakening as it approached Charlottesville. Just prior to arrival, the supercell thunderstorm went through another cycle of strengthening, making the storm much more intense than it had been earlier. The storm reached it`s peak intensity as it moved across the north side of Charlottesville. It was at this point in the storms life cycle where it started to drop damaging hail and very strong wind gusts under the forward- flank downdraft of the storm. This is where a majority of damage reports were, with numerous trees and powerlines down between the Greenbrier and Locust Grove neighborhoods and continuing into Darden Towe Park. Ground photos and video, paired with drone photos of the aftermath showed a vast majority of this damage occurring in the southeast direction. This is consistent with a damaging straight line wind event, which occurred over roughly a three square mile area. In this area there were numerous snapped and uprooted trees, several of which fell onto structures and/or powerlines. Additionally, there were a few locations with some structural damage, but those few instances could easily occur with this level of straight line wind damage. The damage lacked any true linear continuity overall, but was moreso in several north-to-south swaths. Additionally, this area had measured hailstones in the 2 to 2.5 inch range. At this time, when paired with radar presentation, this would reinforce the thinking that this damage likely occurred under a microburst within the forward flank downdraft region of this powerful supercell thunderstorm. However, the National Weather Service will be sending a storm damage team to further investigate early this coming week. It is important to note that severe thunderstorms are capable of producing wind gusts equal to EF0 and EF1 tornadoes in extreme cases. The National Weather Service would like to thank Albemarle County Department of Emergency Management, City of Charlottesville Emergency Management, the University of Virginia, as well as local reports via social media and local broadcast meteorologists for the invaluable information provided to this survey.
-
It usually runs way too high on radar estimates versus actual ground truths especially on convective precip ....