All Activity
- Past hour
-
0.09" from the Sunday evening T-storm. Looked stronger on radar.
-
41.3° for the low here.
-
Wow congrats guys!
-

Hurricane Erin: 130 MPH - 942mb - NW @ 12
olafminesaw replied to BarryStantonGBP's topic in Tropical Headquarters
Hold up...do I spy another ERC?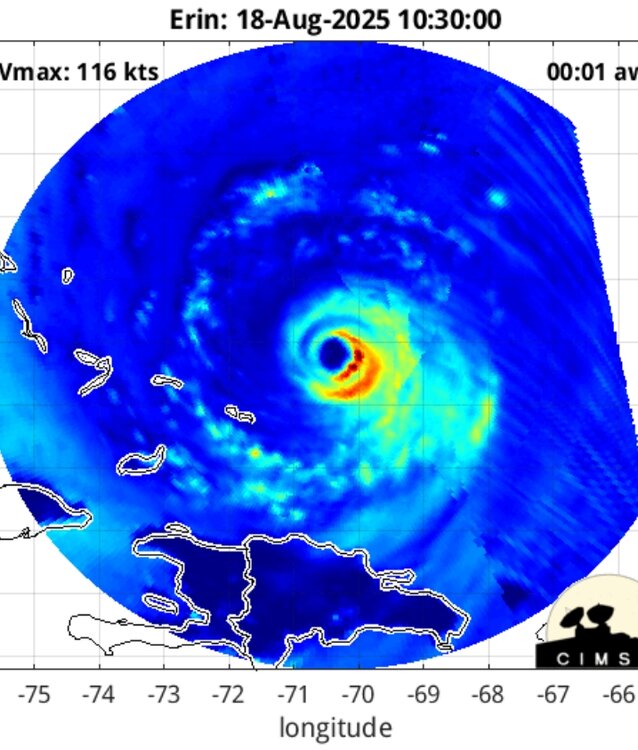
-

Occasional Thoughts on Climate Change
donsutherland1 replied to donsutherland1's topic in Climate Change
Those findings aren't too surprising. The UHI Effect grows most rapidly when an area first begins to urbanize. From 1950-1980, Phoenix's population grew 6.9% per year (Phoenix metro area: 6.4% per year). Since 1980, Phoenix's population has been growing 1.7% per year (Phoenix metro area: 2.7% per year). Since 2000, those rates have slowed further to 1.0% per year and 2.0% per year respectively. Phoenix's suburbs are currently growing faster than the City. -
Sitting at 0.83 for the month here, but 0.65 of that fell in first 5 days. Things are finally getting dry/crunchy around here.
-
Out early this morning. One word, GLORIOUS!
-
Effin Covid.
-
We take. We enjoy.
-

NEW DISTURBANCE: Central Tropical Atlantic (0/50)
cptcatz replied to BarryStantonGBP's topic in Tropical Headquarters
A couple things have my attention this morning: there's a big blob of convection at 7N which is significantly further south than where the NHC marked the wave. I wonder if this will help tug it south or maybe it will just go poof. Second, this morning's 06z GEFS shows a much stronger signal with many of the ensembles staying south hitting Florida. -
 59 here with NE winds
 -
 What a gorgeous morning. Feels like fall.
 -

Hurricane Erin: 130 MPH - 942mb - NW @ 12
jbenedet replied to BarryStantonGBP's topic in Tropical Headquarters
There will be WAR pumping by the developing TC behind Erin. That influence may be another pc that was not resolved at all until today’s model runs. It’s a negligible affect if Erin makes a hard right, but an important influence if that does not occur. Just another thing to monitor out of interest until Erin makes that hard right that’s being shown on the vast majority of guidance/ensemble members. If nothing else, we may see larger spread to the east/west wrt latitude in the western/slower vs eastern/faster tracks. -
40F overnight. Even seeing some 39s locally.
-

Hurricane Erin: 130 MPH - 942mb - NW @ 12
marsman replied to BarryStantonGBP's topic in Tropical Headquarters
I’ve been keeping an eye on the 75W line, and don’t think the cone has crossed it until now, even if just by a pixel. 8am advisory right around the corner. -
Left the window fans on and the living room was down to 65°.
-
0.59” from yesterdays storms .
-

Hurricane Erin: 130 MPH - 942mb - NW @ 12
MANDA replied to BarryStantonGBP's topic in Tropical Headquarters
Very impressive satellite shots this morning! Lots of room for additional intensification next 12-24 hours before shear kicks in. We'll see how strong it can get but that is one impressive satellite presentation going on both in intensity and size. -
Skunked on the rainfall again IMBY. On a brighter note it is really pleasant out there this morning. Temperature of 59, low humidity and a nice breeze. Very refreshing for a change!
-
-
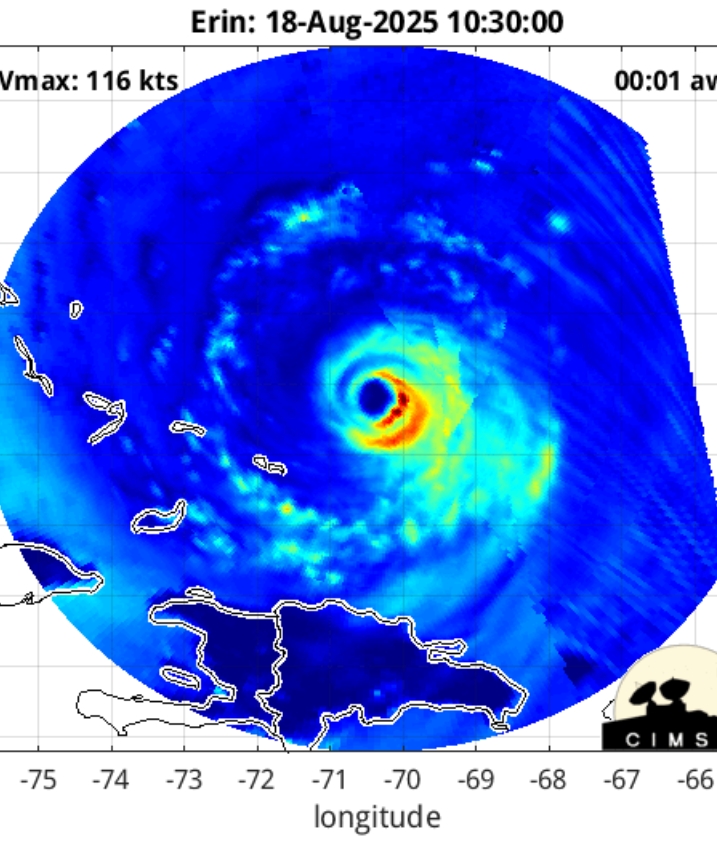
Hurricane Erin: 130 MPH - 942mb - NW @ 12
olafminesaw replied to BarryStantonGBP's topic in Tropical Headquarters
Recon flying circles in the eye, pressure in the mid to upper 930s. Back up to around 120 kts - Today
-

Hurricane Erin: 130 MPH - 942mb - NW @ 12
SnoSki14 replied to BarryStantonGBP's topic in Tropical Headquarters
This could have some of the most substantial indirect impacts we've seen. It's already very large and could double by the time it nears Hatteras. Substantial coastal erosion, flooding, even TS impacts along the coast. -
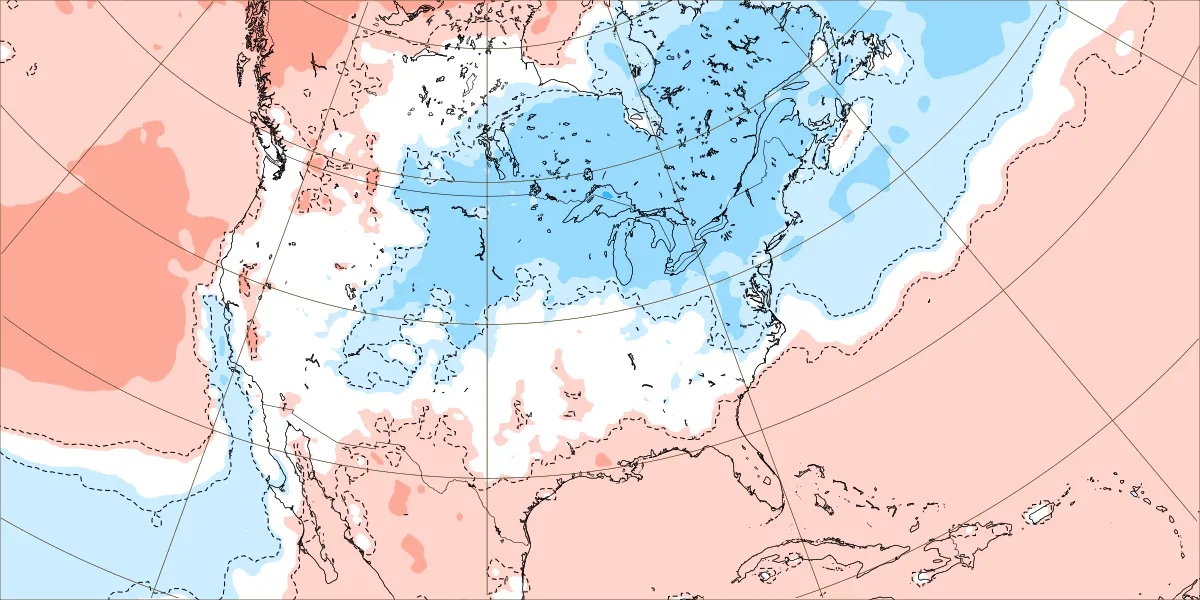
An update from yesterday's run for week of 8/25 fwiw.

-

Hurricane Erin: 130 MPH - 942mb - NW @ 12
NotSureWeather replied to BarryStantonGBP's topic in Tropical Headquarters
GEFS ensemble puts SEMA in the picture. Run is pretty west and has jumped big time over the last day. This has trended west almost this entire time. I’d guess it is gonna just keep going west until it runs into NC and then goes north to scrape Cape Cod. -
 Some records from 1993 have been very difficult to beat. It still remains the only year where the warm spots had 100° heat from June through September. Was the only year with 9 days getting to 100°. But the 2020s are getting close to surpassing the 1990s for total 100° days with 4 years to go. The 2020s only need 3 more 100° days to set the new record. Monthly Highest Max Temperature for NEWARK LIBERTY INTL AP, NJ June Through September Maximum Temperatures Click column heading to sort ascending, click again to sort descending. 2025 103 101 96 M 103 2021 103 97 99 91 103 2011 102 108 98 88 108 1994 102 99 95 92 102 1993 102 105 100 100 105 1952 102 98 92 94 102 1943 102 95 97 93 102 1988 101 101 99 86 101 1966 101 105 95 91 105 2024 100 99 100 87 100 1959 100 93 96 93 100 1953 100 99 102 105 105 1934 100 98 90 85 100 1923 100 99 92 90 100 Time Series Summary for NEWARK LIBERTY INTL AP, NJ - Jan through Dec 100° Days Click column heading to sort ascending, click again to sort descending. 1 1993 9 0 2 1949 8 0 3 2025 7 136 4 2022 6 0 - 1953 6 0 6 1988 5 0 - 1966 5 0 100° days 1990s….19 days 2020s…17 days 1940s….16 days 1950s….15 days 2010s….13 days 2000s…11 days 1980s….9 days 1960s….6 days 1970s….3 days


.thumb.png.4150b06c63a21f61052e47a612bf1818.png)