All Activity
- Past hour
-
 ASH 81F/60 sun.....for how long?
 -

2026-2027 Super El Nino
mitchnick replied to Stormchaserchuck1's topic in Weather Forecasting and Discussion
That's what the Cfs2 was showing over 3 months ago when I posted. I was just the messenger. Obviously, Cfs2 forecast, updated multiple times a day, changed. -

2026-2027 Super El Nino
snowman19 replied to Stormchaserchuck1's topic in Weather Forecasting and Discussion
Here comes the next monster WWB -

2026-2027 Super El Nino
bluewave replied to Stormchaserchuck1's topic in Weather Forecasting and Discussion
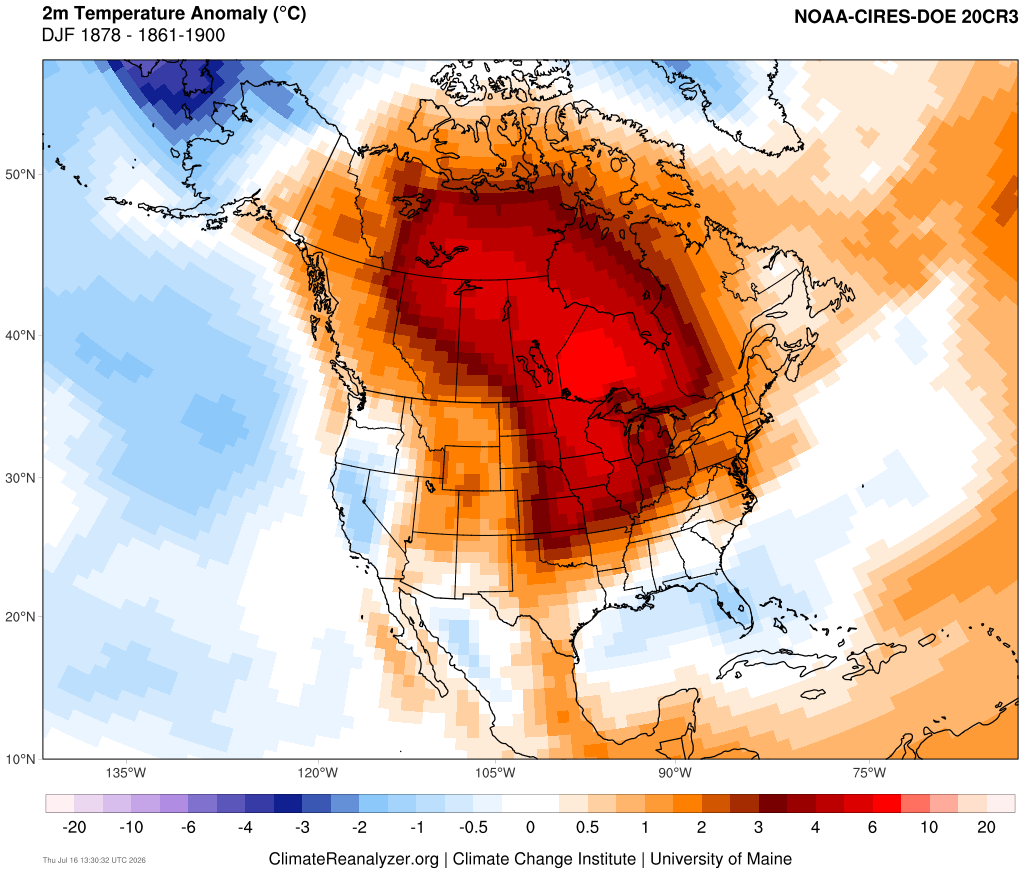
Parts of the East had their lowest snowfall of the 1800s that winter. The big story during the 1877-1878 super El Niño was the warmth in the Upper Midwest. It’s an example how really strong El Niños can sometimes have their warmest departures in February. While we don’t have the 1841-1870 climate normals for MSP, I used the earliest available 30 year period. The departures for them that winter would have been like if December 2015 had run through February 2016 in the Northeast with no pattern reversal. MSP 1877-1878 DEC….+14.5 JAN…..+9.8 FEB……+15.8 Monthly Mean Avg Temperature for Minneapolis-St Paul Area, MN (ThreadEx) Click column heading to sort ascending, click again to sort descending. Mean 19.3 12.0 15.7 15.6 Max 33.8 1877 25.9 1880 31.9 1877 1872-1873 6.0 5.4 12.8 8.1 1873-1874 17.6 12.2 12.6 14.1 1874-1875 17.2 -3.4 -2.6 3.7 1875-1876 24.7 15.7 15.9 18.8 1876-1877 8.3 8.6 31.9 16.3 1877-1878 33.8 21.8 31.5 29.0 1878-1879 19.1 16.1 12.7 16.0 1879-1880 11.5 25.9 19.6 19.0 1880-1881 13.2 7.9 17.1 12.7 1881-1882 29.0 19.0 30.4 26.1 1882-1883 15.0 0.8 12.1 9.3 1883-1884 19.7 8.8 12.9 13.8 1884-1885 14.8 4.4 11.3 10.2 1885-1886 21.0 3.7 14.9 13.2 1886-1887 7.3 0.7 9.4 5.8 1887-1888 17.4 -0.4 13.1 10.0 1888-1889 25.2 20.7 10.6 18.8 1889-1890 28.8 10.6 19.2 19.5 1890-1891 24.4 21.6 11.8 19.3 1891-1892 30.1 13.5 22.9 22.2 1892-1893 16.8 7.3 12.0 12.0 1893-1894 14.0 12.3 15.7 14.0 1894-1895 28.1 7.0 12.0 15.7 1895-1896 22.5 16.8 22.3 20.5 1896-1897 24.4 10.6 20.0 18.3 1897-1898 15.3 23.0 20.6 19.6 1898-1899 14.1 13.7 7.8 11.9 1899-1900 21.4 21.3 8.6 17.1 1900-1901 21.0 15.2 12.3 16.2 1901-1902 15.9 18.7 18.2 17.6 -
 was wild out pink/red at 5am as sun came up, and the thick of it is still SW of us
 -
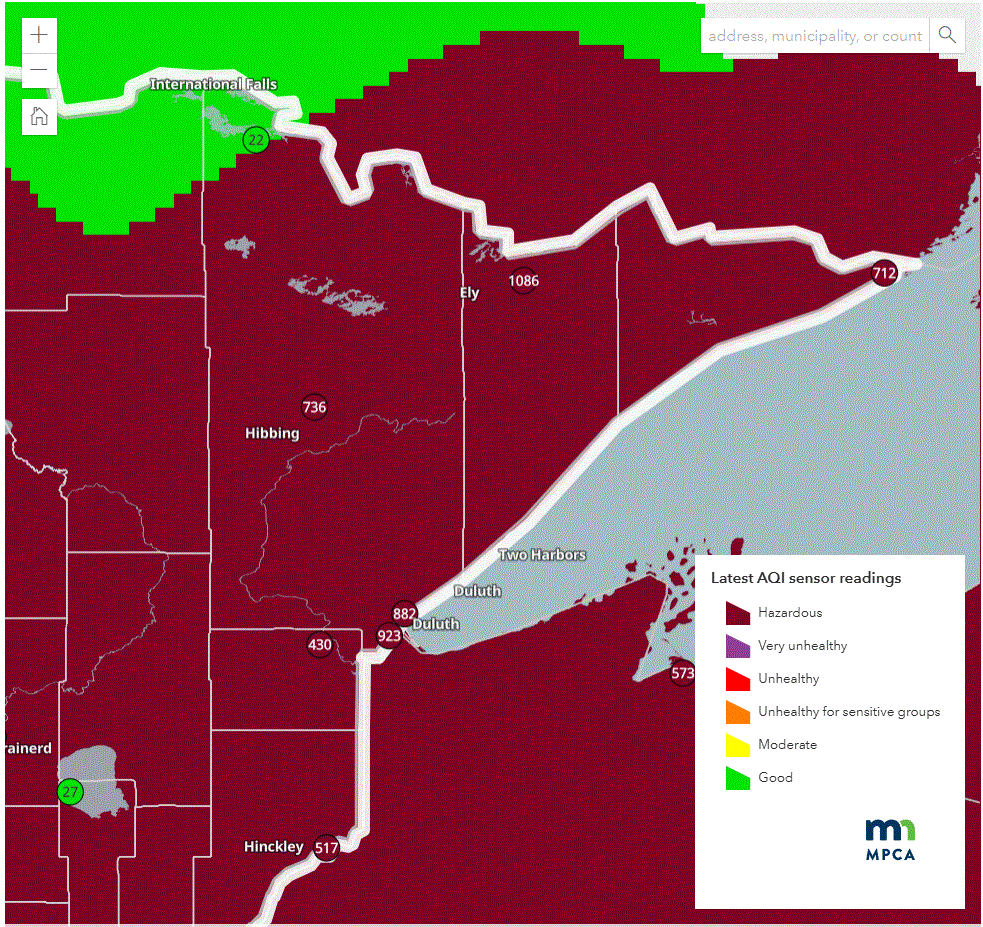
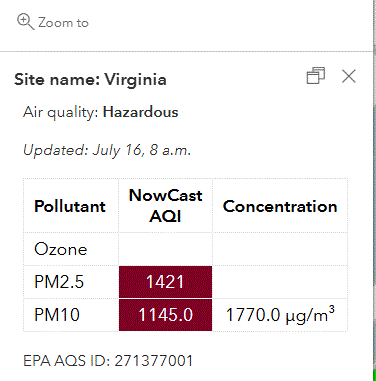
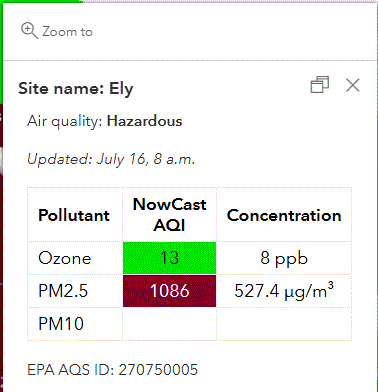
Radical. Hibbing /Virginia area just updated on the map. With HP overhead, air is stagnant atm.
-

2026-2027 Super El Nino
LakePaste25 replied to Stormchaserchuck1's topic in Weather Forecasting and Discussion
I mean this goes into the discussion with @40/70 Benchmark that past super Ninos were not torches for the Northeast due to “clean forcing” as in, less competing Nina-like convection in the Maritime Continent. It used to be more of a torch signal for the upper Midwest. Only modern super Ninos have been torchy in the NE. -

2026-2027 Super El Nino
GaWx replied to Stormchaserchuck1's topic in Weather Forecasting and Discussion
This map agrees with many of the official SE station temps being NN (and even BN in FL as Jacksonville and other official temps confirm). It also shows that the torch was centered in the Midwest and Plains with no torch near the E coast (ex: NYC was ~+1.3F, not a torch). Much of NE coast was only 1-2 F AN per the city by city official temps. -
Rode my motorcycle to/from the gym this morning. Definitely a hazy, orange sunrise. But I couldn't smell any smoke or anything, even on my bike, so it didn't really bother me.
-
(002).thumb.png.6e3d9d46bca5fe41aab7a74871dd8af8.png)
Central PA Summer 2026 Discussion/Obs Thread
ChescoWx replied to Voyager's topic in Upstate New York/Pennsylvania
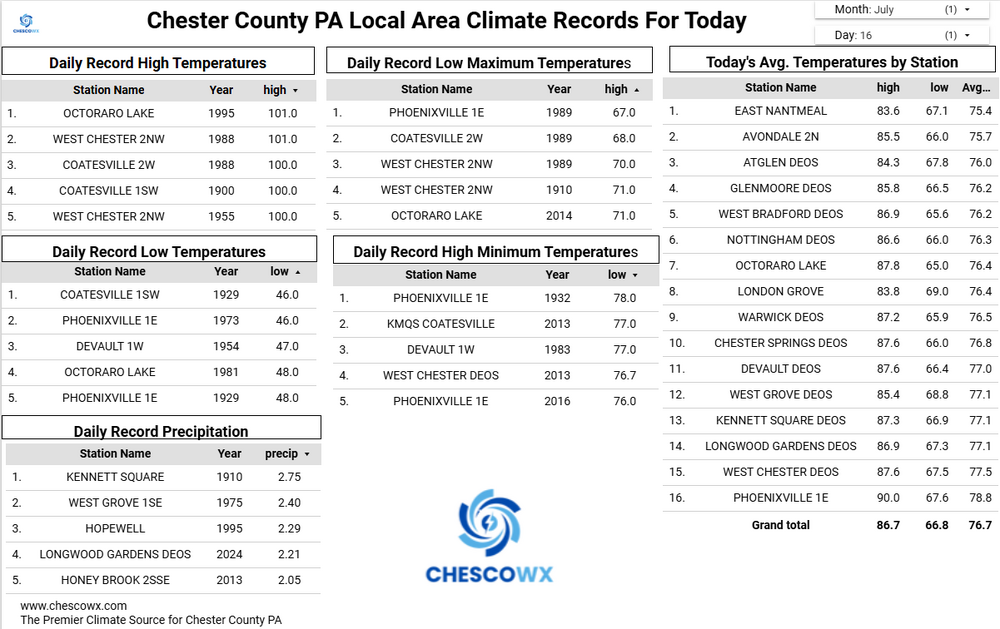
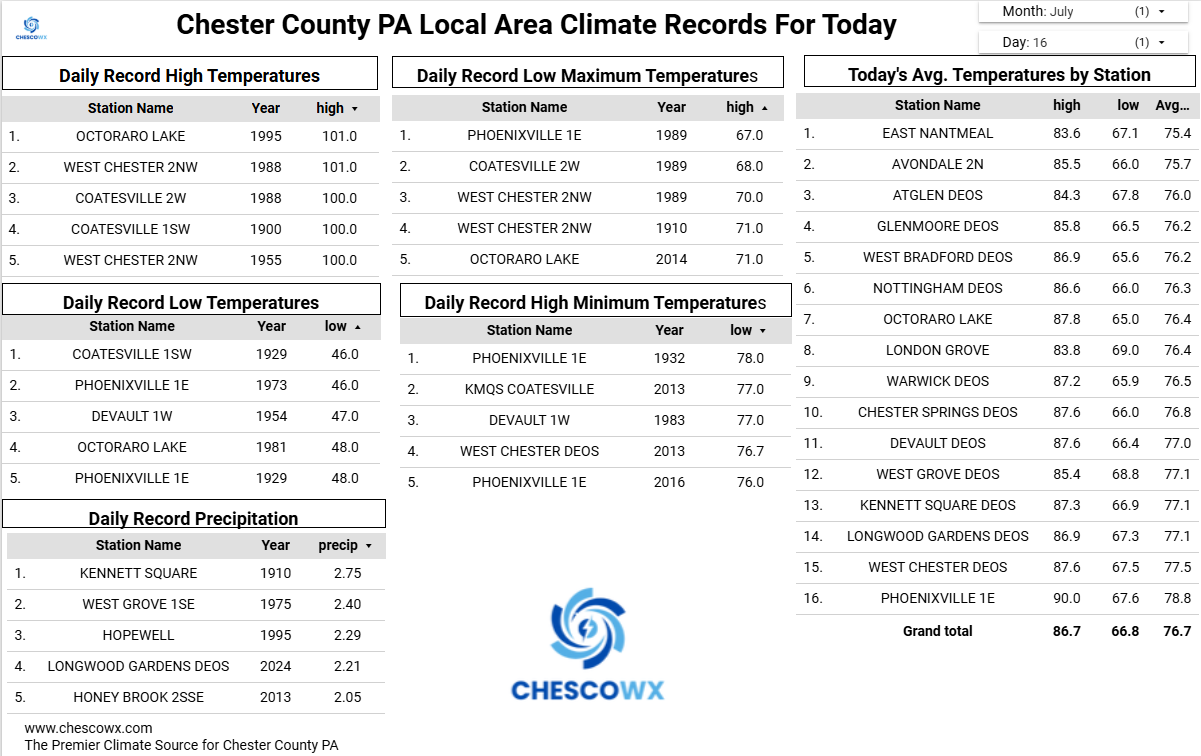
Yesterday was the 5th day this month and season that I recorded a 90+ temperature here in East Nantmeal. This is the 6th most 90+ days I have recorded in a summer season over the last 23 summers. The most being 10 in 2011 with the summers of 2004/2014/2015/2022/2023 seeing no days touching 90 degrees at all. Many spots maybe not the higher ridge locations like EN should reach 90 again although the well-advertised smoke from the Ontario fires could potentially limit daytime heating a bit. We cool back to near normal on Friday and below normal over the weekend and through Monday. Some small rain chances are around this evening but much better chances of widespread rain on Saturday into Saturday Night. We could see widespread totals of much needed rain of at least an inch.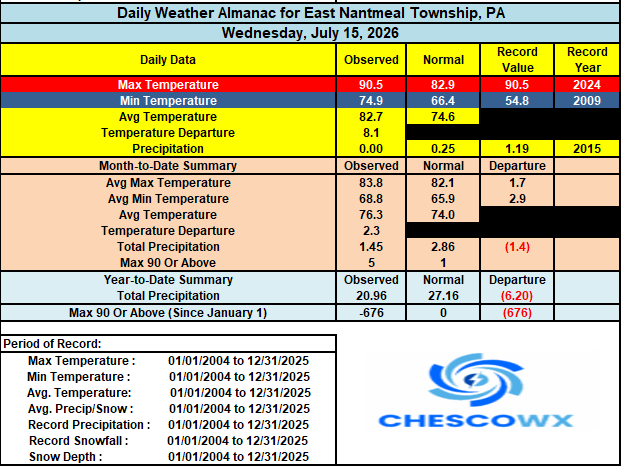
-
E PA/NJ/DE Summer 2026 Obs/Discussion
ChescoWx replied to PhiEaglesfan712's topic in Philadelphia Region
Yesterday was the 5th day this month and season that I recorded a 90+ temperature here in East Nantmeal. This is the 6th most 90+ days I have recorded in a summer season over the last 23 summers. The most being 10 in 2011 with the summers of 2004/2014/2015/2022/2023 seeing no days touching 90 degrees at all. Many spots maybe not the higher ridge locations like EN should reach 90 again although the well-advertised smoke from the Ontario fires could potentially limit daytime heating a bit. We cool back to near normal on Friday and below normal over the weekend and through Monday. Some small rain chances are around this evening but much better chances of widespread rain on Saturday into Saturday Night. We could see widespread totals of much needed rain of at least an inch.
-

July 2026 General Discussion
SchaumburgStormer replied to Chicago Storm's topic in Lakes/Ohio Valley
Hello stinky haze my old friend -
I recorded a refreshing 62 at 6:45.
-
Theme of the last two years. Hot frontloaded summer, cooler the latter half
-
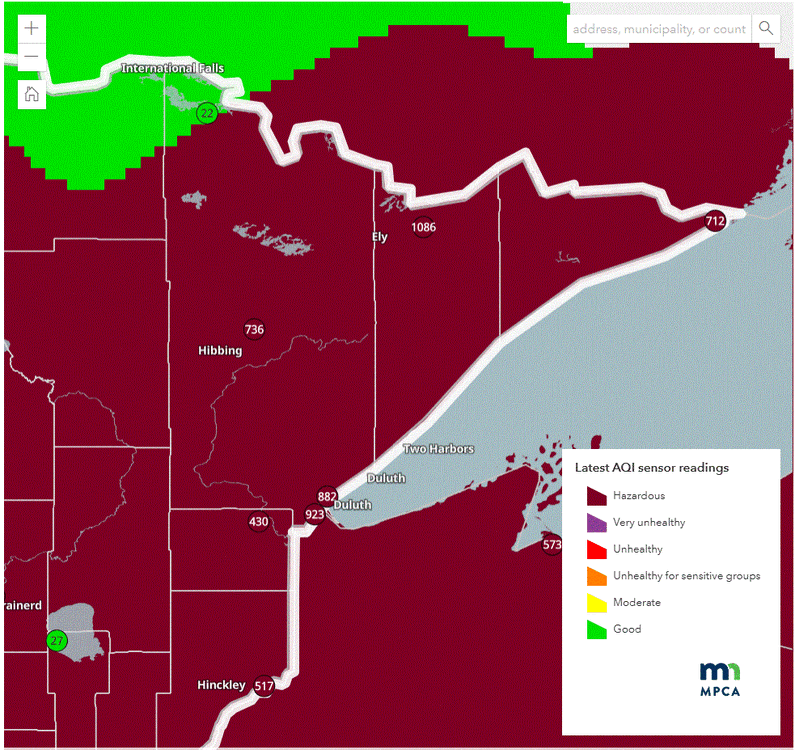
AQI is 590 at the closest reporting spot I could find. Just flat out nasty and not getting better any time soon.
-
Horrible AQI in NE MN. Similar to yesterday.
-
85/73 with no wind at all and the air is getting smoky. I feel bad for the guys building my neighbor's new deck out in this
-
2026-2027 Super El Nino
snowman19 replied to Stormchaserchuck1's topic in Weather Forecasting and Discussion
With the last 3 super El Niños, (1982-83, 1997-98, 2015-16), the last region to go back to ENSO neutral was region 1+2. That region stayed in a strong El Niño until spring in all 3, while the other regions went back to neutral first -
Yeah only down to 81F on the day so far. If no rogue storm pops up later we could at least tie the all-time or have the first 80+ daily low there. (You, of course, know this. I just like talking sometimes. ) ETA: LOL! I should've read the post above before commenting. I was still on the last page.
-
And it continues. "Sigh"
-

2026-2027 Super El Nino
csnavywx replied to Stormchaserchuck1's topic in Weather Forecasting and Discussion
Here's the continental composite using the 1861-1900 average to detrend. Note that a simple detrend, while helpful, still assumes that SST changes since then will scale linearly in terms of forcing (almost certainly not going to be the case). Nevertheless, the overall pattern makes it clear that the continent will mostly suffer from high frequency intrusion of downslope events, enhanced by anomalous moisture transport and a surplus moist static energy.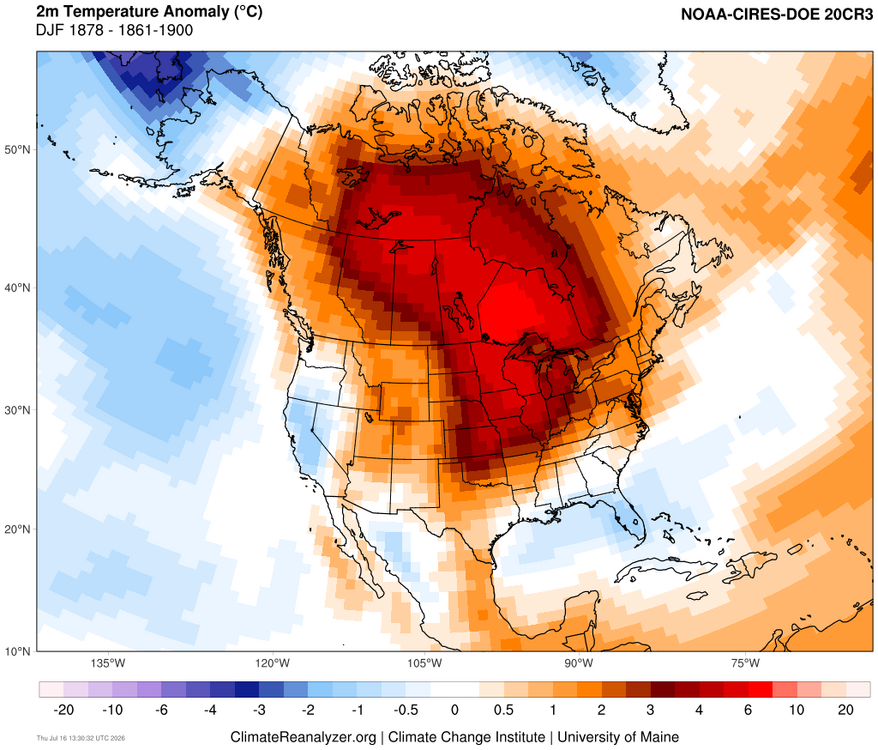
-
Despite the clouds / smoke still to 79 and a chance to extend the 90+ readings here.
-
Meanwhile Texas is getting absolutely crushed again
-

E PA/NJ/DE Summer 2026 Obs/Discussion
Hurricane Agnes replied to PhiEaglesfan712's topic in Philadelphia Region
Fell short of any triple digits here in NW Philly yesterday but did make it up to 96 after a 73 low. it was still brutal with the humidity and dps into the upper 70s... until some convective outflow boundary from the upstate storms, washed down over the city and knocked the dps down almost 10 degrees. Currently hazy, smokey and 80 with dp 72, -
July 16 2006: A heat burst occurs over west central and central Minnesota. The temperature at Canby jumped from 91 degrees to 100 degrees in 40 minutes from 10:35pm to 11:15pm. At the same time the dew point temperature dropped from 63 to 32 degrees. Heat bursts are caused by dying thunderstorms with very warm air aloft. 1963: A downpour falls at St. Charles, where half a foot of rain accumulates in one day. For Thursday, July 16, 2026 1920 - A severe hailstorm over parts of Antelope and Boone counties in Nebraska stripped trees of bark and foliage, ruined roofs, and broke nearly every window facing north. (The Weather Channel) 1946 - The temperature at Medford, OR, soared to an all-time high of 115 degrees to begin a two week heat wave. During that Oregon heat wave the mercury hit 100 degrees at Sexton Summit for the only time in forty years of records. (David Ludlum) (The Weather Channel) 1975 - An early afternoon thunderstorm raked the east side of Tucson, AZ, with gale force winds, heavy rain, and numerous lightning strikes. A thirteen year old boy was swept through a forty foot long culvert by raging waters before being rescued. (The Weather Channel) 1987 - Showers and thunderstorms in the southwestern U.S. ended a record string of thirty-nine consecutive days of 100 degree heat at Tucson, AZ. A thunderstorm at Bullhead City, AZ, produced wind gusts to 70 mph reducing the visibility to near zero in blowing dust. Southerly winds gusting to 40 mph pushed temperature readings above 100 degrees in the Northern Plains. Rapid City, SD, reported a record high of 106 degrees, following a record low of 39 degrees just three days earlier. (The National Weather Summary) (Storm Data) 1988 - Thirty-seven cities in the eastern U.S. reported record high temperatures for the date. Highs of 96 degrees at Bluefield, WV, and 104 degrees at Charleston WV were all-time records, and afternoon highs of 98 degrees at Binghamton, NY, 99 degrees at Elkins, WV, and 103 degrees at Pittsburgh PA, tied all- time records. Highs of 104 degrees at Baltimore, MD, and 105 degrees at Parkersburg WV were records for July, and Beckley, WV, equalled their record for July with a high of 94 degrees. Martinsburg, WV, was the hot spot in the nation with a reading of 107 degrees. Afternoon and evening thunderstorms raked the northeastern U.S. with large hail and damaging winds. (The National Weather Summary) 1989 - Showers and thunderstorms developing along a stationary front drenched the Middle Atlantic Coast States with heavy rain, causing flooding in some areas. More than five inches of rain was reported near Madison and Ferncliff, VA. Hot weather prevailed in Texas. San Angelo reported a record high of 106 degrees. (The National Weather Summary) Observances: 16 Thu National Cherry Day 16 Thu World Snake Day 16 Thu Artificial Intelligence Appreciation Day 16 Thu Manu’a Cession Day (in lieu) 16 Thu National Atomic Veterans Day 16 Thu National Corn Fritters Day 16 Thu National D.R.E.S.S. Syndrome Day 16 Thu National Personal Chef Day 16 Thu National Wedding Invitation Day 16 Thu Our Lady of Mount Carmel 16 Thu Rural Transit Day 16 Thu The Feast of Our Lady of Mount Carmel 16 Thu Guinea Pig Appreciation Day 16 Thu Fresh Spinach Day





.thumb.jpeg.f5c6ba9d911ec96b3b124f8606aee58e.jpeg)