All Activity
- Past hour
-

September 2025 OBS-Discussion centered NYC subforum
donsutherland1 replied to wdrag's topic in New York City Metro
September is ending on an unseasonably warm note. Many parts of the region saw high temperatures in the 80s. Highs included: Bridgeport: 81° Islip: 82° (tied record set in 1986) New York City-Central Park: 81° New York City-JFK Airport: 81° New York City-LaGuardia Airport: 80° Newark: 83° The start of October will coincide with arrival of the coolest air mass so far this season, but temperatures will likely quickly moderate, rising to above normal levels within a few days. High temperatures will reach only the middle 60s tomorrow and Thursday. New York City will see the low temperature bottom out in the lower 50s on Thursday morning. Outside the City, widespread 40s are likely with a few of the colder locations dipping into the 30s. A rapid warmup will commence on Friday and a warm weekend lies ahead. The guidance and historical experience following a second half September mean temperature of 70° or above suggest that October will be warmer than normal in the New York City area. The two most recent Octobers with a cooler than normal first half like 2025 and a second half with a mean temperature of 70° or above were: 2017 (October mean temperature: 64.1° and October 2019: October mean temperature 59.9°). The ENSO Region 1+2 anomaly was -0.1°C and the Region 3.4 anomaly was -0.5°C for the week centered around September 24. For the past six weeks, the ENSO Region 1+2 anomaly has averaged -0.12°C and the ENSO Region 3.4 anomaly has averaged -0.42°C. La Niña conditions will likely develop during mid- or late-autumn. The SOI was +3.63 today. The preliminary Arctic Oscillation (AO) was -0.436 today. -

September 2025 OBS-Discussion centered NYC subforum
uofmiami replied to wdrag's topic in New York City Metro
It's an airport, I don't live at it thankfully. Only 78.3 in Muttontown & 77.4 in Syosset today. -

Spooky Season (October Disco Thread)
tamarack replied to Prismshine Productions's topic in New England
At the time, the 2.54" on 12/25 was the greatest calendar day precip I'd measured in December here. The low of 43 was 14° higher than the average high for the date. It's now in 3rd place. We had 3.25" on 12 23/2022, less than a week after getting a 22" dump of 9:1 snow. That latter storm began as SN/IP and 2/3 of precip came at temps 30-35. The RA fell atop a solid 15" pack and only brought it down to 12". Tops now came on 12/18/2023 with 4.08", most falling at 45-55°. The 2" pack quickly disappeared, rivers were fairly high due to 2.3" RA a week earlier, and the 4.21" 2-day total produced the 2nd highest peak flow (only 1987 had more) on both the Sandy and Carrabassett Rivers. Had the 2023 storm fallen on that 15" pack of 2022, the 1987 record might now be #2. -

September 2025 OBS-Discussion centered NYC subforum
psv88 replied to wdrag's topic in New York City Metro
@uofmiami drives to islip to protest the inaccurate sensor. -
This forum in the 1800s…

-

Spooky Season (October Disco Thread)
Damage In Tolland replied to Prismshine Productions's topic in New England
Nice!! -
August was alright. September has been great—though I think this is the first one in a while where I didn’t have a chase opportunity. It’s coming in October though.
-

Pittsburgh PA Fall 2025 Thread
TimB replied to TheClimateChanger's topic in Upstate New York/Pennsylvania
Today is the 15th day with a high of 80+ this September. Septembers with 14+ days of 80+, 1952-2014 (63 years): 9 Septembers with 14+ days of 80+, 2015-2025 (11 years): 7 Crazy that something that used to happen about once every 7 years is now happening more years than not. -

2025-2026 ENSO
michsnowfreak replied to 40/70 Benchmark's topic in Weather Forecasting and Discussion
Yet another example how we were so spoiled back then lol. For Detroit- 2002-2015 avg- 52.4” 2016-2025 avg- 39.1” POR avg- 40.9” -

Spooky Season (October Disco Thread)
Torch Tiger replied to Prismshine Productions's topic in New England
small brush fire on I93 earlier! -
2025-2026 ENSO
michsnowfreak replied to 40/70 Benchmark's topic in Weather Forecasting and Discussion
Yeah that makes sense. Not terribly different from my avg temps. But yet another example of how snowfall is localized and very subject to other things than just the avg temp. I wonder what a REASONABLE line or latitude is to draw a line and assume below that line is where you really need seasonable to colder than avg temps to get snow. Based on a quick calculation, I get your DJF avg high/low as 38/20. Mine is 34/21. - Today
-
Spooky Season (October Disco Thread)
Damage In Tolland replied to Prismshine Productions's topic in New England
Let’s get the burning going The prolonged dry conditions will only exacerbate fire weather concerns, especially as leaves start to fall. It would not take much wind to increase this risk further. -

2025-2026 ENSO
so_whats_happening replied to 40/70 Benchmark's topic in Weather Forecasting and Discussion
Although it does look like the 850mb wind field may be trying to change up. Lets see how it plays out Last 90days and then the next 2 weeks potential.

-
Best September for anything. Best August for anything. Come on October you can do it!
-
Had rain last night and getting rain currently with a high of 62 beautiful degrees.
-
.thumb.jpg.6a4895b2a43f87359e4e7d04a6fa0d14.jpg)
Central PA Fall Discussions and Obs
Yardstickgozinya replied to ChescoWx's topic in Upstate New York/Pennsylvania
One of the first things that popped up on the search so take it with a grain of salt. Harrisburg Rank Temperature Date 1 97 °F October 7, 1941 1 97 °F October 5, 1941 3 93 °F October 2, 2019 3 93 °F October 6, 1941 5 90 °F October 5, 1959 5 90 °F October 1, 1927 7 89 °F October 9, 2007 7 89 °F October 6, 1997 7 89 °F October 5, 1951 7 89 °F October 5, 1922 11 88 °F October 8, 2007 11 88 °F October 6, 1959 11 88 °F October 12, 1954 11 88 °F October 10, 1949 11 88 °F October 4, 1941 11 88 °F October 3, 1919 11 88 °F October 6, 1900 18 87 °F October 1, 2019 18 87 °F October 7, 1963 18 87 °F October 4, 1959 18 87 °F October 2, 1927 18 87 °F October 6, 1922 -
2025-2026 ENSO
so_whats_happening replied to 40/70 Benchmark's topic in Weather Forecasting and Discussion
To me it just shows that forcing, namely maritime, is not ever omnipotent. Could it go back to being continuously 4-6 absolutely but currently regardless of what phase we seem to be globally open although weak in most locations, every single basin is firing off tropical activity right now. While it is something we don't see all that often and for this persistent I don't see it more than that. -
I don’t have the answer though it may not. But regardless, I just find it absolutely fascinating that it has and will continue to be dominated by the “wrong” way for 6 weeks. I can’t find any longer than about 1/2 month like this over the last 50 years in Jul-Dec. (I haven’t checked Jan-June.) What I’ve love to know is what unique set of factors is allowing this to happen?
-
Definitely unusual as you noted, but does it matter if the forcing is propagating the "wrong" direction? Off hand I am not sure why it necessarily matters directly, but indirectly it implies a weakness in potential analog forecasts.
-
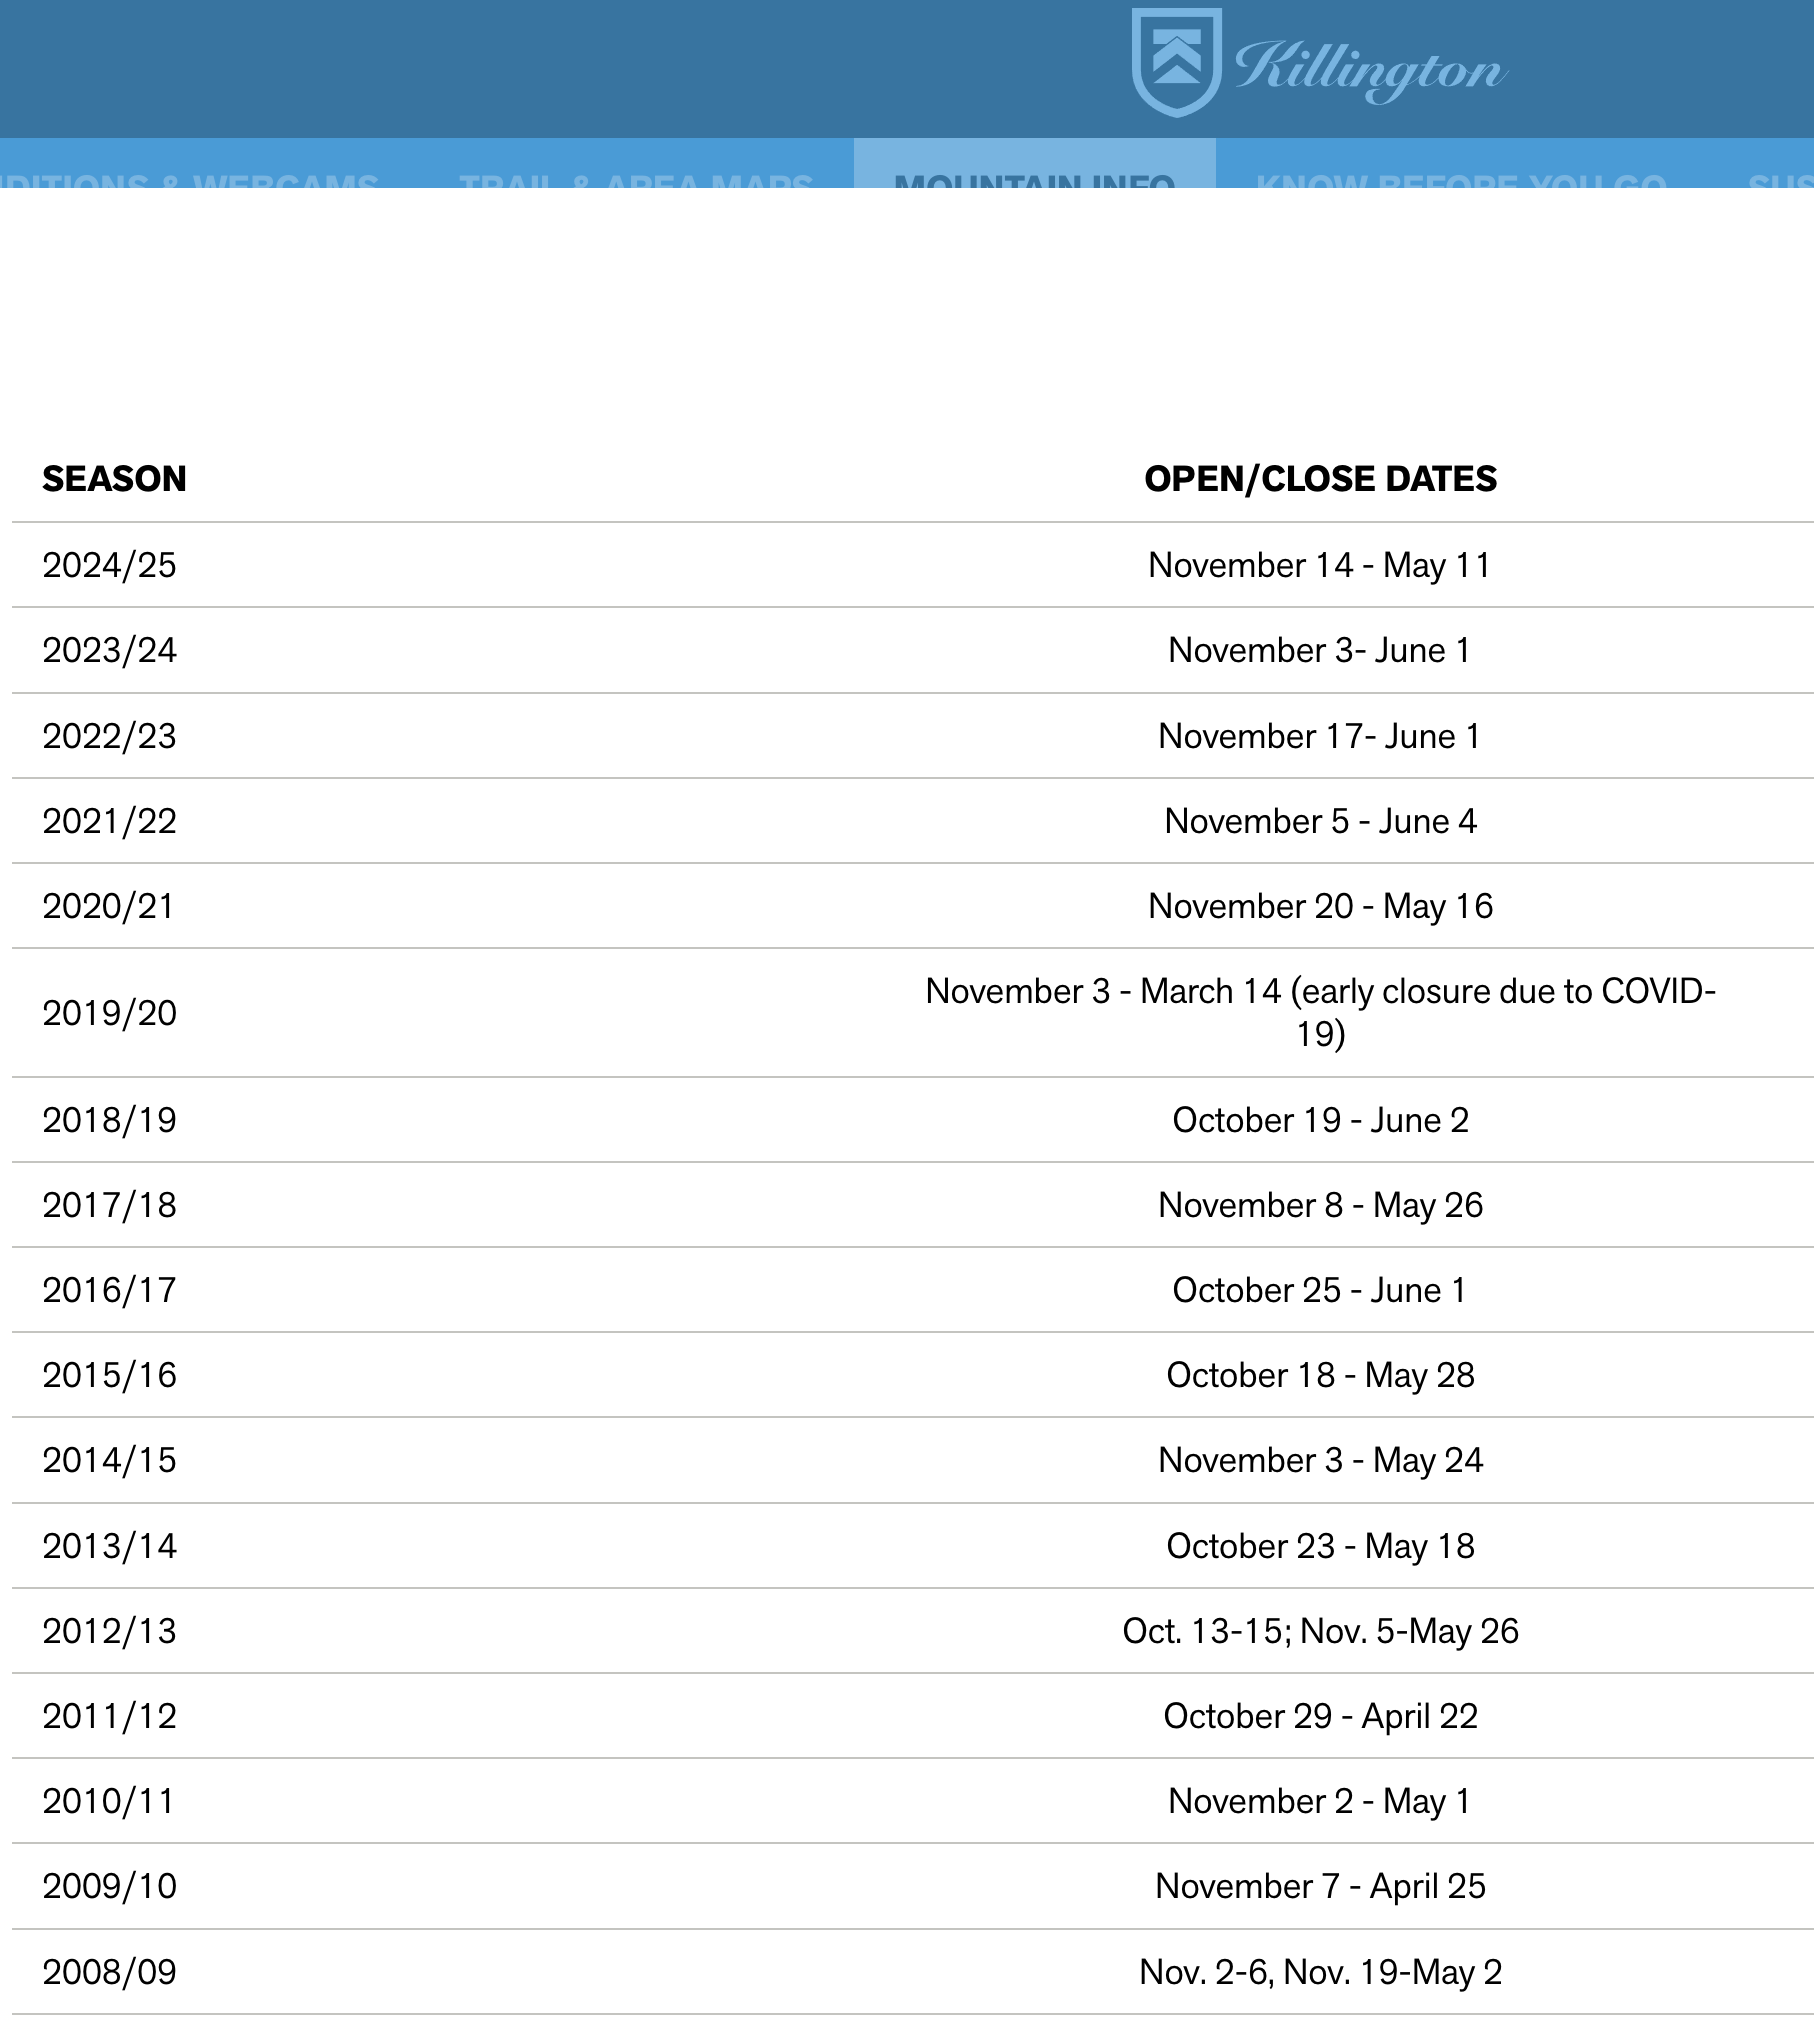
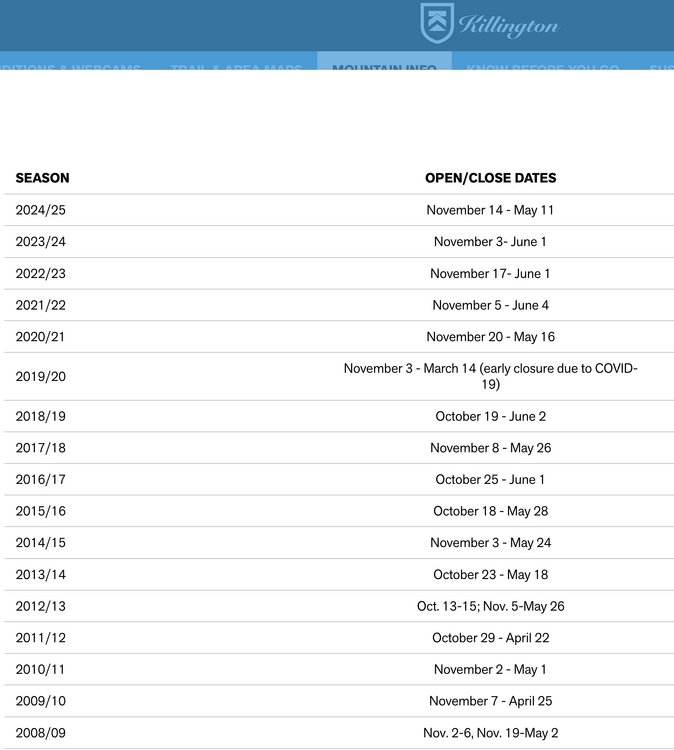
Any guesses where Kilington is going to fall this year? It's been a warm one!
-
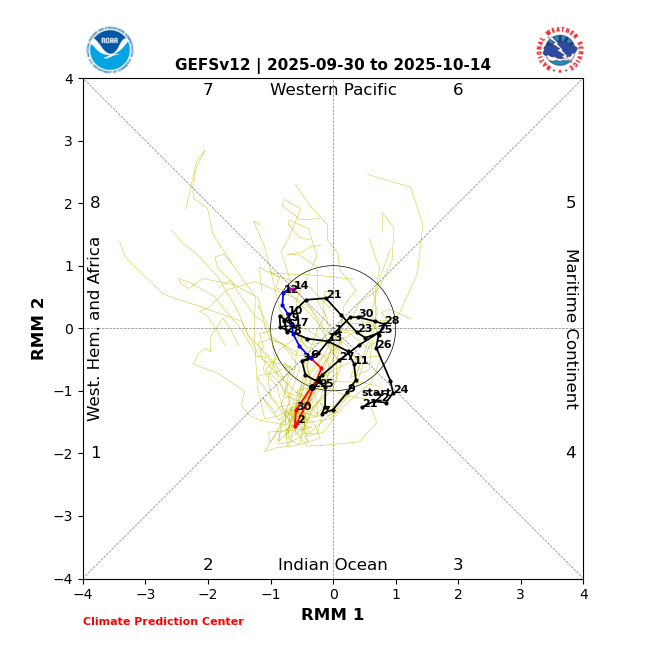
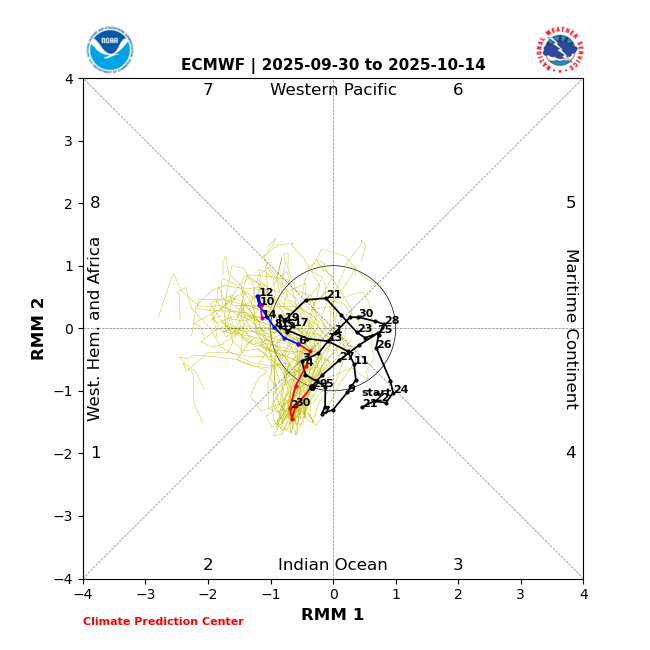
The unptecedented for the 2nd half of the year (since MJO records started in 1974) very lengthy clockwise dominated track continues with still no end yet in sight. It started Sept 1st and is projected to continue at least through Oct 12th, which would mean 6 weeks long! GEFS: clockwise at least through Oct 14th EPS: clockwise at least through Oct 12th @snowman19Has Roundy said anything about this?
-
(002).thumb.png.6e3d9d46bca5fe41aab7a74871dd8af8.png)
E PA/NJ/DE Autumn 2025 Obs/Discussion
ChescoWx replied to PhiEaglesfan712's topic in Philadelphia Region
10/30/2011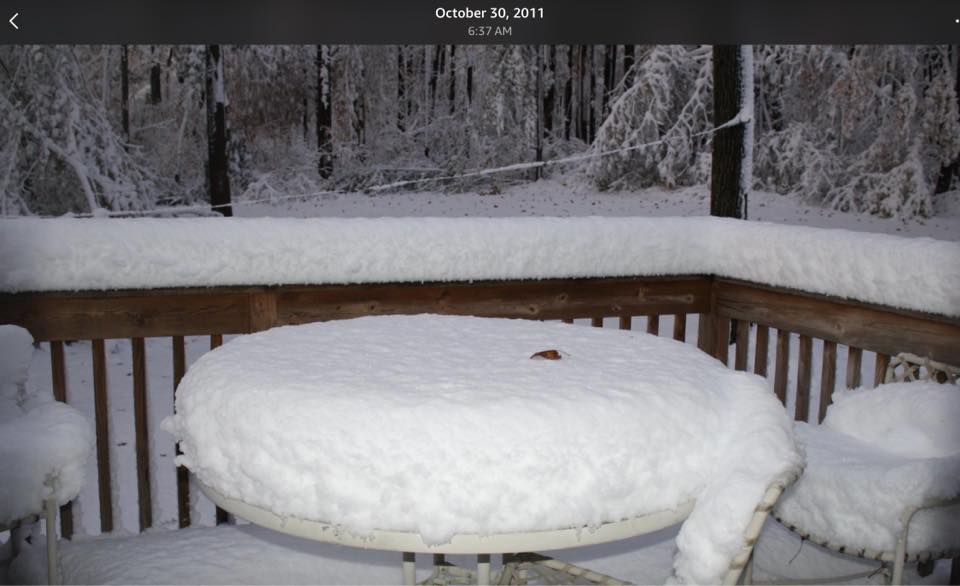
-
Favorable ACE looks to continue through the foreseeable future: (note that favorable phase 2 just produced Humberto and Imelda) GEFS: going backwards through 2/1/8 EPS: going backwards through 2/1/8


-
Up to 75 knots. Visible reveals a possible eye feature forming
-
I would play Huntley. Houston can bring the pressure, and Rush isn't mobile. He also looked terrible throwing the ball last week. No idea why they signed this guy to a 2 year, multi-million dollar deal.