All Activity
- Past hour
-

Septorcher 2026 Discussion - Endless Summer
dendrite replied to Damage In Tolland's topic in New England
This winter is already delivering anger and we haven’t reached the equinox yet. -

Septorcher 2026 Discussion - Endless Summer
kdxken replied to Damage In Tolland's topic in New England
So far so good. A nor'easter at the wrong time can turn that on a dime. -

Septorcher 2026 Discussion - Endless Summer
weatherwiz replied to Damage In Tolland's topic in New England
Just sat down with some pizza and was going to do some reading or a lecture video but this is more fun. Fight time LFG!!!!!! -

Occasional Thoughts on Climate Change
LibertyBell replied to donsutherland1's topic in Climate Change
It's interesting that the records set on the 2nd and 6th are included but not the 3rd I wonder why? Either way you can see from the sheer number of records set in that historic heatwave that was a heatwave of unparalleled proportions the kind of long duration heat wave we simply do not see anymore. The last time we had a something like that was in 1993. What other records can you find from that historical heatwave? Im shocked that Mount Pocono got into the mid 90s as early as late May and as late as mid August, was that entire summer just one long massive heatwave? Also both Newark and Boston set records, why didn't Central Park? About elevation, the Poconos are a Plateau not a mountain range so I can't see its elevation being much less. I actually developed something called relative temperature as an analog to relative temperature to convert temperature to sea level. 103 would be around 114 at sea level. I'm perfectly fine with accepting that because I know climate change is nuanced especially in the East. Our heatwaves have become shorter and we have less extremely high record temperatures. The average temperature rise is mostly driven by higher minimum temperatures, not higher maximums. I've had my heat running for about a month already and it's not a pleasant feeling. I would have thought climate change would have occurred faster but here we are. Most people enjoy heat much more than cold so we dont see climate change as an altogether bad thing the way we view tobacco causing cancer. Obviously it's not a good thing but there are some positives to it like not spending a thousand plus on heating every month in the winter when it impacts us the most and not having to use the heat in the summer which I had to use starting in August. -

2026-2027 Record-breaking El Nino
GaWx replied to Stormchaserchuck1's topic in Weather Forecasting and Discussion
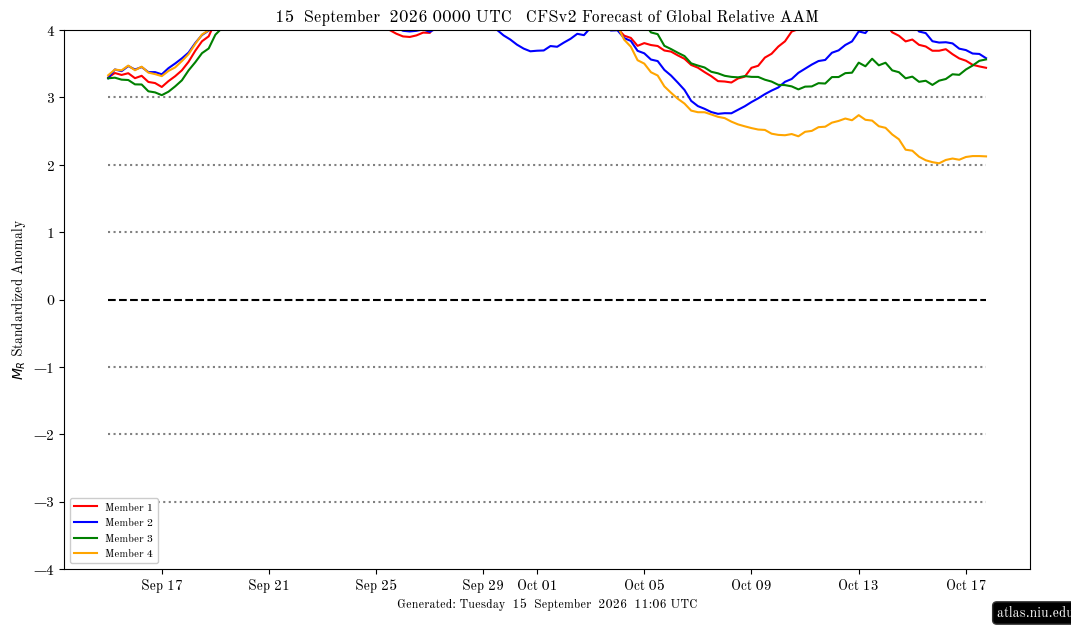
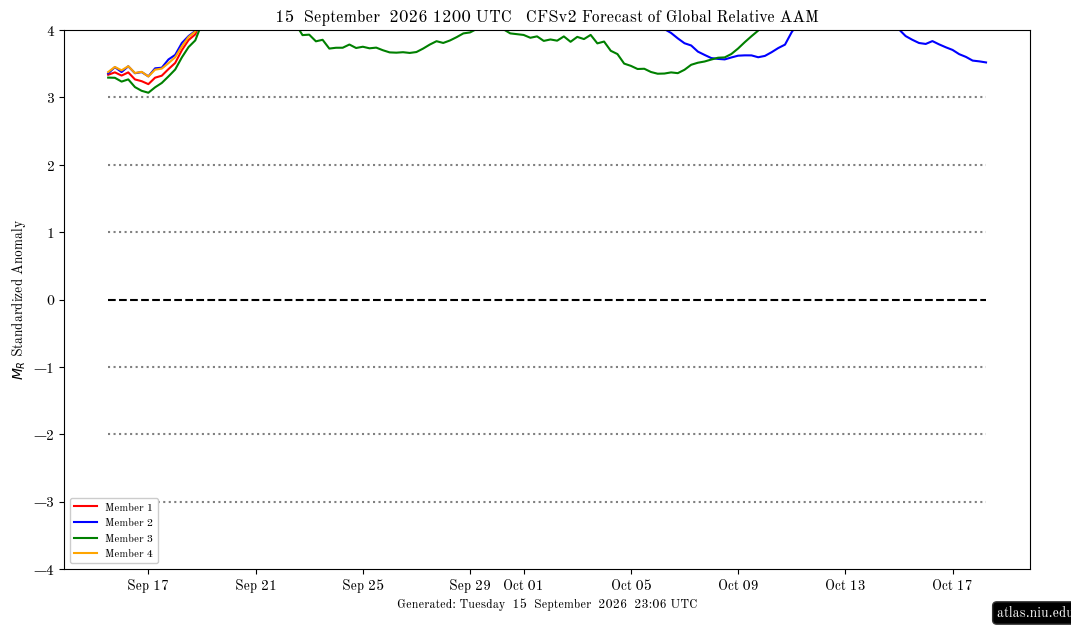
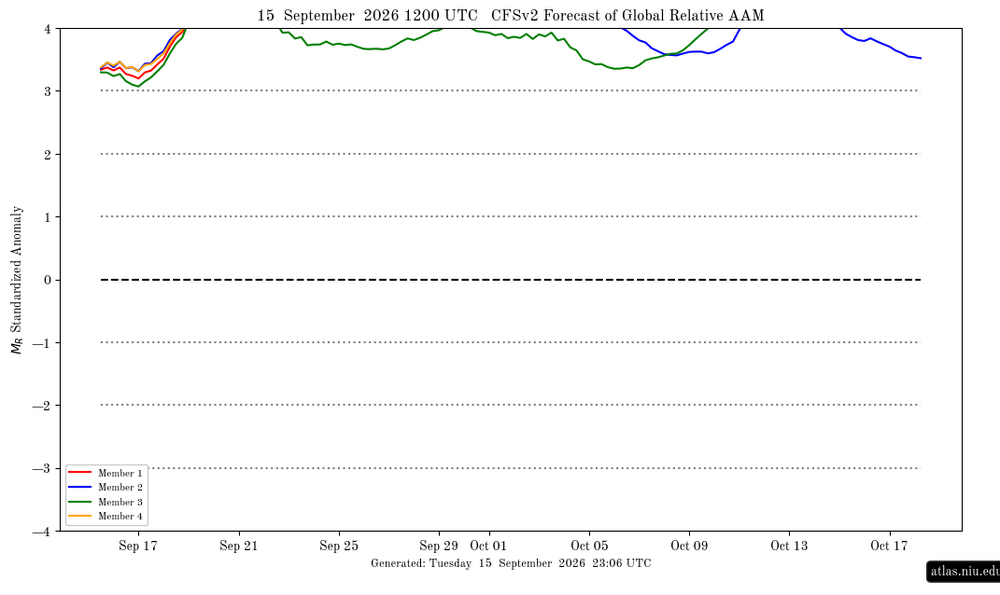
9/15 12Z CFSv2 consistent with 0Z run having AAM on Sep 19th go to a historical extreme level (+4+):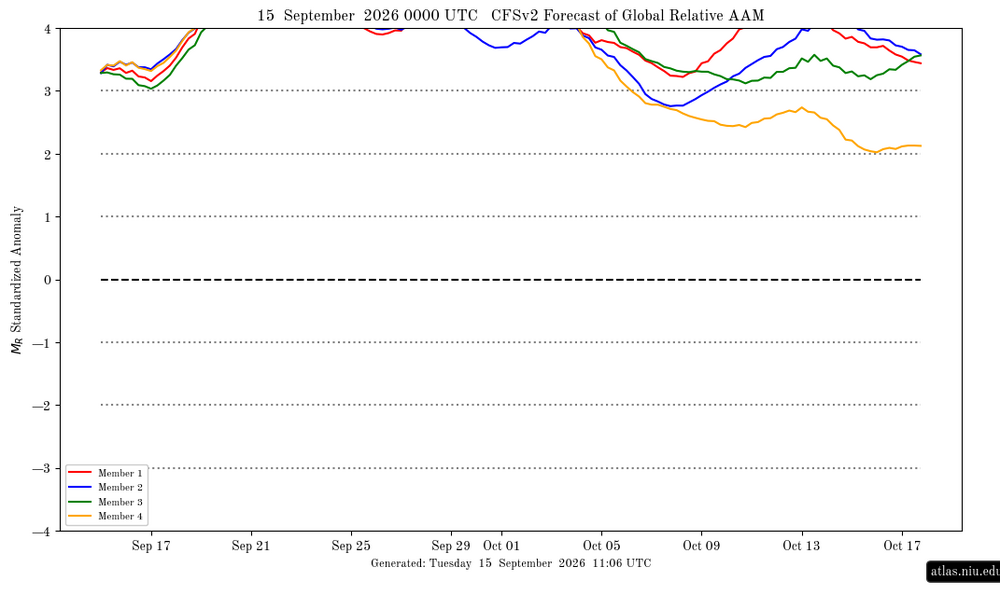
-
1.29" here today. It was yet another cool, dreary, wet day.
-

Septorcher 2026 Discussion - Endless Summer
JACKASS replied to Damage In Tolland's topic in New England
Fuck you trumper! -
Septorcher 2026 Discussion - Endless Summer
kdxken replied to Damage In Tolland's topic in New England
58° here. Uniform temperatures. -
 online canadian drugstore and best canadian online pharmacy canada pharmacy store https://www.google.mu/url?q=https://northrxcanada.shop online pharmacy canadaand http://www.sportchap.ru/user/kajrjfrxfy/ reliable canadian pharmacy [url=http://urlxray.com/display.php?url=https://northrxcanada.shop/]canadian pharmacies[/url] canadian pharmacy 365or [url=http://ussher.org.uk/user/tvwpathijg/?um_action=edit]canadian drugstore online[/url] canadian mail order pharmacy
 -
online canadian drugstore and best canadian online pharmacy canada pharmacy store https://www.google.mu/url?q=https://northrxcanada.shop online pharmacy canadaand http://www.sportchap.ru/user/kajrjfrxfy/ reliable canadian pharmacy [url=http://urlxray.com/display.php?url=https://northrxcanada.shop/]canadian pharmacies[/url] canadian pharmacy 365or [url=http://ussher.org.uk/user/tvwpathijg/?um_action=edit]canadian drugstore online[/url] canadian mail order pharmacy
- Yesterday
-

Septorcher 2026 Discussion - Endless Summer
powderfreak replied to Damage In Tolland's topic in New England
I saw $4.59 for gas today up here and almost passed out, lol. 57F to keep it on topic. -

Septorcher 2026 Discussion - Endless Summer
SouthCoastMA replied to Damage In Tolland's topic in New England
lol -
Interesting read/analysis: https://www.severe-weather.eu/global-weather/super-el-nino-builds-atmospheric-hurricane-shield-winter-2026-2027-connections-united-states-canada-fa/
-

Septorcher 2026 Discussion - Endless Summer
Damage In Tolland replied to Damage In Tolland's topic in New England
Get a grip on life . Wow Do you have a budget ? Do you have someone that can understand and manage your finances? With this nasty , ban / suspension worthy tantrum , it seems like you probably do not . Recommendation.. find someone -
Septorcher 2026 Discussion - Endless Summer
kdxken replied to Damage In Tolland's topic in New England
Right? Bunch of whiners. $5,000 Doge check plus another $5,000 Republican vote rebate and most folks should be able to afford heat for at least half the winter. -
Septorcher 2026 Discussion - Endless Summer
JACKASS replied to Damage In Tolland's topic in New England
FUCK YOU! -
Yeah, nasty. High was 96. Might as well live in Texas.
-
reputable mexican pharmacy or cheapest mexican prescription drugs buy from mexico pharmacy https://cse.google.lu/url?sa=t&url=https://mexicogenerics.com purple pharmacy mexico or http://georgiantheatre.ge/user/qbtbhbzxja/ mexican mail order pharmacy [url=http://7ba.org/out.php?url=http://mexicogenerics.com]mexican online pharmacy[/url] mexican prescription drug imports and [url=http://www.sportchap.ru/user/foymeykjit/]mexico pharmacy order online birth control[/url] order meds from mexico
-
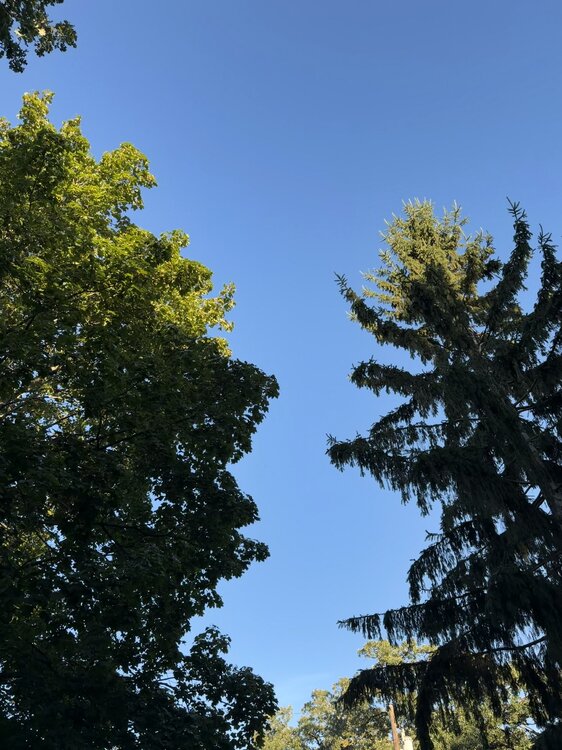
72/46 Peak early fall vibes, view from the hammock.
-
50.7 this morning, 75 earlier, 63 now. Fall.
-
The dew points are now 70 at Toledo, but recently as low as 51 degrees. The 50's dew points are average for this time of year.
-
Tuff
-
Septorcher 2026 Discussion - Endless Summer
Damage In Tolland replied to Damage In Tolland's topic in New England
Nah..Just follow the budget your advisor has for you . This should all be factored in and planned for . -
To me, Superstorm of 93 kind of kicked off the snowy epoch that followed. Also got me interested in meteorology.
-
Records: Highs: EWR: 94 (1983) NYC: 92 (1927) LGA: 91 (1993) JFK: 85 (2008) Lows: EWR: 47 (1975) NYC: 44 (1873) LGA: 49 (1975) JFK: 45 (1975) Historical: 1747: Some historical accounts of a hurricane caused flooding on the Rappahannock River in Virginia. A slave ship was overturned, and several fatalities were reported. 1752 - A great hurricane produced a tide along the South Carolina coast which nearly inundated downtown Charleston. However, just before the tide reached the city, a shift in the wind caused the water level to drop five feet in ten minutes. (David Ludlum) 1910 - Rains of .27 inch on the 14th and .73 inch on the 15th were the earliest and heaviest of record for Fresno CA, which, along with much of California, experiences a ""rainy season"" in the winter. (The Weather Channel) 1916: St. Paul's earliest snow ever. (Ref. AccWeather Weather History) 1922: The noon wet bulb temperature of 79.3°F was the highest ever-recorded in Washington, DC until this date. (Ref. Washington Weather Records - KDCA) 1939 - The temperature at Detroit MI soared to 100 degrees to establish a record for September. (The Weather Channel) 1939" The temperature at Detroit MI soared to 100 °F to establish a record for September. (The Weather Channel) (Ref. WxDoctor) (Ref. Many Additional Temperatures Listed On This Link) 1944: Boston, Massachusetts recorded its lowest September pressure of 28.62 inches of mercury from the "Great Atlantic Hurricane". (Ref. NOAA Boston Weather Events) 1945: A hurricane entered the south Florida coast at Homestead, curving northward right up through the center of Florida, remaining over land, and exited near Jacksonville Beach with winds gusting to 170 mph. The following is from the Homestead Air Reserve Base. “On Sept. 15, 1945, three years to the day after the founding of the Homestead Army Air Field, a massive hurricane roared ashore, sending winds of up to 145 miles per hour tearing through the Air Field's buildings. Enlisted housing facilities, the nurses' dormitory, and the Base Exchange were all destroyed. The roof was ripped from what would later become building 741, the Big Hangar. The base laundry and fire station were both declared total losses. The few remaining aircraft were tossed about like leaves.” 1965: Heavy snow across parts of Wyoming from the 13th through the 15th was by far the heaviest for so early in the season, resulting in 23 inches in Rawlins and 20.7 inches in Lander. (Ref. AccWeather Weather History) 1977: Sioux Falls, SD residents received a rude awakening during the morning hours as thunderstorms rolled through the city. Over 2.5 inches of rain fell in the city in an hour and 15 minutes. The large amount of rain in a short period of time led to street flooding in some areas. Lightning strikes from the storms also started several fires. (Ref. Wilson Wx. History) 1982 - A snowstorm over Wyoming produced 16.9 inches at Lander to esablish a 24 hour record for September for that location. (13th-15th) (The Weather Channel) 1987 - The first snow of the season was observed at the Winter Park ski resort in Colorado early in the day. Eight inches of snow was reported at the Summit of Mount Evans, along with wind gusts to 61 mph. Early morning thunderstorms in Texas produced up to six inches of rain in Real County. Two occupants of a car drowned, and the other six occupants were injured as it was swept into Camp Wood Creek, near the town of Leakey. Late afternoon and evening thunderstorms produced severe weather in central and northeastern Oklahoma. Wind gusts to 70 mph and golf ball size hail were reported around Oklahoma City OK. (National Weather Summary) (Storm Data) 1988 - Thunderstorms brought much needed rains to parts of the central U.S. Rainfall totals of 2.87 inches at Sioux City IA and 4.59 inches at Kansas City MO were records for the date. Up to eight inches of rain deluged the Kansas City area, nearly as much rain as was received the previous eight months. Hurricane Gilbert, meanwhile, slowly churned toward the U.S./Mexican border. (The National Weather Summary) 1989 - Showers and thunderstorms produced locally heavy rain in the Central Appalachians. Virgie VA received 2.60 inches of rain during the evening hours, and Bartlett TN was deluged with 2.75 inches in just ninety minutes. Heavy rain left five cars partially submerged in high water in a parking lot at Bulls Gap TN. Thunderstorms over central North Carolina drenched the Fayetteville area with four to eight inches of rain between 8 PM and midnight. Flash flooding, and a couple of dam breaks, claimed the lives of two persons, and caused ten million dollars damage. Hugo, churning over the waters of the Carribean, strengthened to the category of a very dangerous hurricane, packing winds of 150 mph. (Storm Data) (The National Weather Summary) 1975: Marilyn struck the Virgin Islands as a Category 3 Hurricane with maximum sustained winds of 115 mph and an estimated minimum central pressure of 952 millibars or 28.11 inches of mercury. The strongest, most damaging part of the storm passed directly over the island of St. Thomas. The island of Culebra reported an unofficial wind gust of 125 mph. Storm surge was generally 6 to 7 feet with an isolated 11.7 storm surge in St. Croix. 80% of the homes and business on St. Thomas were destroyed and 10,000 people were left homeless. 30% of the homes on St. John were destroyed and 60% were left roofless. Marilyn caused 8 deaths and $1.5 billion dollars in damage. (Ref. Wilson Wx. History) 1995: Hurricane Marilyn strikes Virgin Islands. It hit the U.S. Virgin Islands as a strong category 2 storm with top winds of 115 mph. The strongest, most damaging part of the storm passed directly over St. Thomas Island. It caused 8 deaths and $1.5 billion in damages. (Ref. AccWeather Weather History) 2004: (Sep. 13th-16th) Hurricane Ivan affected coastal AL/W FL Panhandle; landfall occurred near Gulf Shores, AL, early on 16th. A buoy just S of the AL coastal waters reported an incredible peak wave height of 52 feet today before breaking loose of its mooring. (Ref. Weather Guide Calendar with Pheno 2010: The largest hailstone in Kansas was found in southwest Wichita. It measured 7.75 inches in diameter. 2011: An EF0 Waterspout moved ashore in Ocean City, Maryland.