All Activity
- Past hour
-
Some context on La Nina ACE through August. We finished at 39 in the Atlantic. 30-50 La Nina ACE, through Aug 31 since 1930 () and then final ACE after the slash. 1942 (36.1) / 62.5 1956 (32.5) / 56.7 1964 (39.7) / 153 1998 (44.7) / 181.8 2000 (43.7) / 119.1 2007 (38.0) / 73.9 2010 (45.1) / 165.5 2011 (36.7) / 126.3 2016 (31.5) / 141.3 excluding the Jan 2016 system 2017 (30.4) / 224.9 2020 (43.0) / 179.8 2021 (44.4) / 145.7 Blended final total - 135.9. Ten most recent La Ninas average 146 ACE (2007-2024). October is almost always below 70 ACE even in hyper-active seasons, and Nov is almost always under 35 ACE even in hyper-active seasons. So the quiet September days start to add up pretty quick if you're behind with nothing active. If you throw out 2017 (since we're very unlikely to be anywhere near 175 ACE in Sept), you end up with a map consistent with my research showing the low ACE La Nina hurricane seasons have more frequent cold snaps in the Southwest. 2020 had the mid Sept/late Oct/Feb severe cold, Feb-Apr 2022 (and 2023) was very cold locally. Feb 2011 very cold. Jan 2008 is very cold. Nov-Jan 2000-01 is very cold. Dec 2011 very cold locally. September should be quite clarifying for which years in the group are the good matches. The Summer temperature pattern was fairly close to some kind of blend of 2007, 2020, 2021
-

September 2025 OBS-Discussion centered NYC subforum
jm1220 replied to wdrag's topic in New York City Metro
Definitely an orange tint to it tonight. -
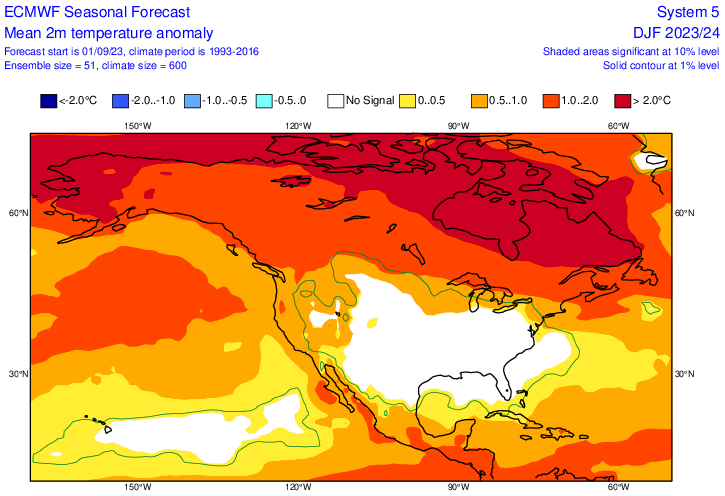
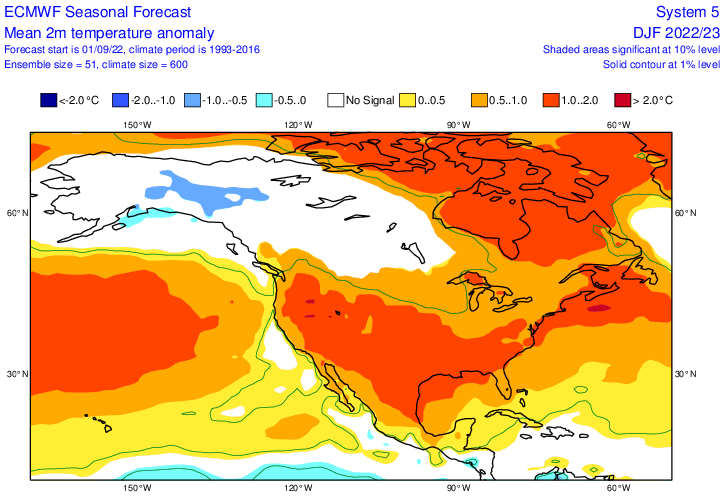
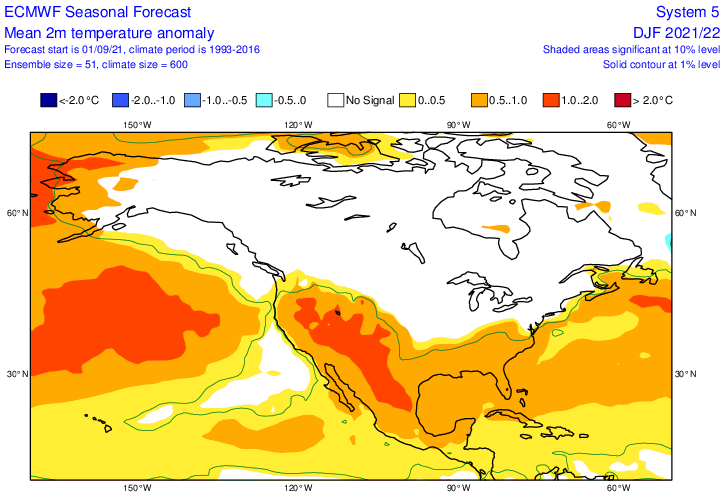
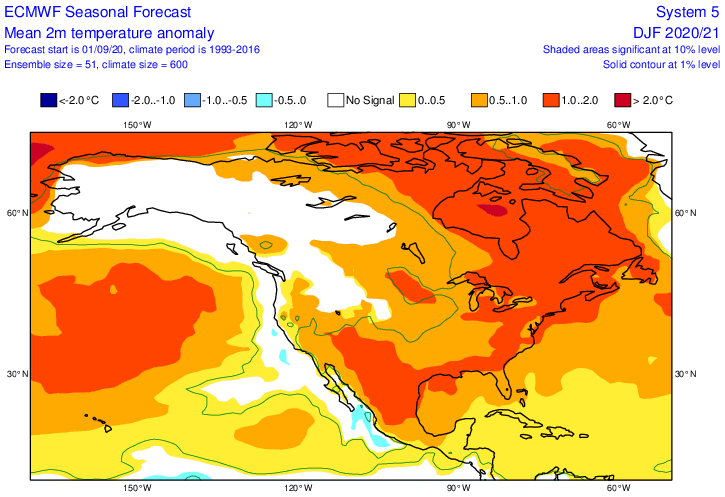
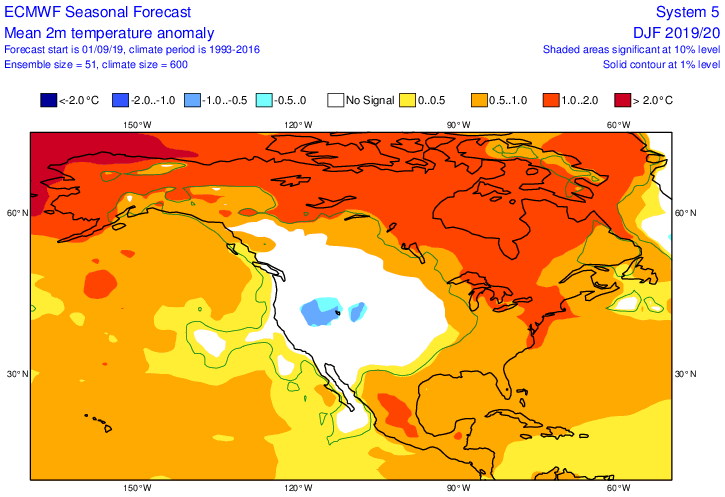
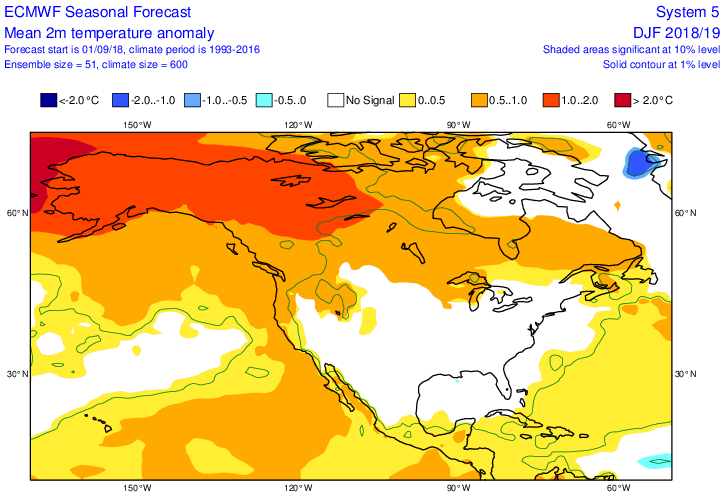
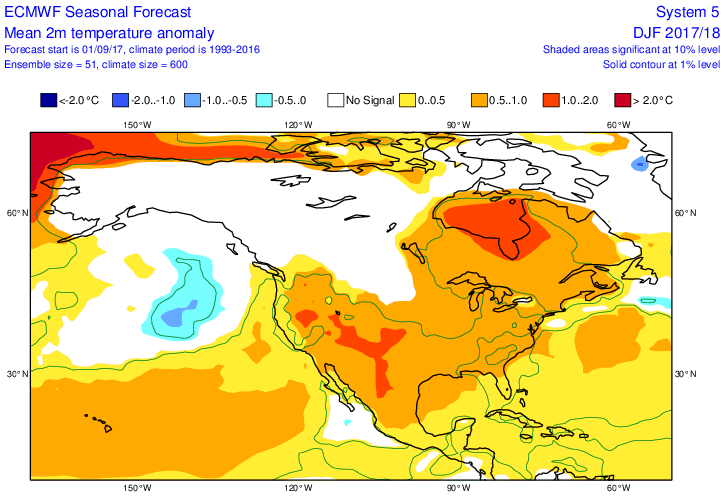
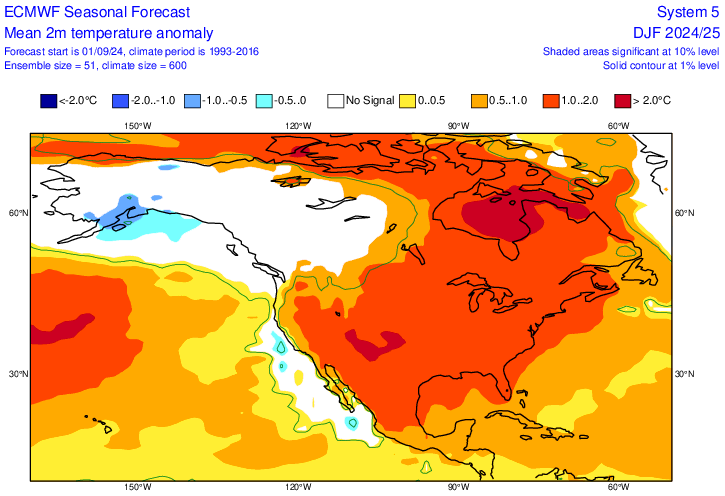
Here are the Sept Euro forecasts for DJF 2024-5 back to 2017-8 vs actual 2024-5 prog: avg 4F too warm much of US but SW close; grade: F 2024-5 actual https://psl.noaa.gov/cgi-bin/data/usclimdivs/climdiv.pl?variab=Temperature&type=1&base=7&mon1=12&mon2=2&iy[1]=2024&iy[2]=&iy[3]=&iy[4]=&iy[5]=&iy[6]=&iy[7]=&iy[8]=&iy[9]=&iy[10]=&iy[11]=&iy[12]=&iy[13]=&iy[14]=&iy[15]=&iy[16]=&iy[17]=&iy[18]=&iy[19]=&iy[20]=&iy[21]=&iy[22]=&iy[23]=&iy[24]=&iy[25]=&iy[26]=&iy[27]=&iy[28]=&iy[29]=&iy[30]=&irange1=&irange2=&xlow=-10&xhi=10&xint=1&iunits=1&scale=100&iwhite=1&iswitch=0&Submit=Create+Plot 2023-4 prog: MW 5-8 too cold, NE 3-4 too cold, SE 1-3 too cold, W close; grade D 2023-4 actual https://psl.noaa.gov/cgi-bin/data/usclimdivs/climdiv.pl?variab=Temperature&type=1&base=7&mon1=12&mon2=2&iy[1]=2023&iy[2]=&iy[3]=&iy[4]=&iy[5]=&iy[6]=&iy[7]=&iy[8]=&iy[9]=&iy[10]=&iy[11]=&iy[12]=&iy[13]=&iy[14]=&iy[15]=&iy[16]=&iy[17]=&iy[18]=&iy[19]=&iy[20]=&iy[21]=&iy[22]=&iy[23]=&iy[24]=&iy[25]=&iy[26]=&iy[27]=&iy[28]=&iy[29]=&iy[30]=&irange1=&irange2=&xlow=-10&xhi=10&xint=1&iunits=1&scale=100&iwhite=1&iswitch=0&Submit=Create+Plot 2022-3 prog: W MW 3 too warm; E MW and NE 3 too cold, SE 1-2 too cold, W 6 too warm; grade D 2022-3 actual https://psl.noaa.gov/cgi-bin/data/usclimdivs/climdiv.pl?variab=Temperature&type=1&base=7&mon1=12&mon2=2&iy[1]=2022&iy[2]=&iy[3]=&iy[4]=&iy[5]=&iy[6]=&iy[7]=&iy[8]=&iy[9]=&iy[10]=&iy[11]=&iy[12]=&iy[13]=&iy[14]=&iy[15]=&iy[16]=&iy[17]=&iy[18]=&iy[19]=&iy[20]=&iy[21]=&iy[22]=&iy[23]=&iy[24]=&iy[25]=&iy[26]=&iy[27]=&iy[28]=&iy[29]=&iy[30]=&irange1=&irange2=&xlow=-10&xhi=10&xint=1&iunits=1&scale=100&iwhite=1&iswitch=0&Submit=Create+Plot 2021-2 prog: pretty close except 2 too warm W; grade A 2021-2 actual https://psl.noaa.gov/cgi-bin/data/usclimdivs/climdiv.pl?variab=Temperature&type=1&base=7&mon1=12&mon2=2&iy[1]=2021&iy[2]=&iy[3]=&iy[4]=&iy[5]=&iy[6]=&iy[7]=&iy[8]=&iy[9]=&iy[10]=&iy[11]=&iy[12]=&iy[13]=&iy[14]=&iy[15]=&iy[16]=&iy[17]=&iy[18]=&iy[19]=&iy[20]=&iy[21]=&iy[22]=&iy[23]=&iy[24]=&iy[25]=&iy[26]=&iy[27]=&iy[28]=&iy[29]=&iy[30]=&irange1=&irange2=&xlow=-10&xhi=10&xint=1&iunits=1&scale=100&iwhite=1&iswitch=0&Submit=Create+Plot 2020-1 prog: 0-4 too warm MW, 3 too warm NE/SE, SC 4-6 too warm, W 1-2 too warm; Grade D 2020-1 actual https://psl.noaa.gov/cgi-bin/data/usclimdivs/climdiv.pl?variab=Temperature&type=1&base=7&mon1=12&mon2=2&iy[1]=2020&iy[2]=&iy[3]=&iy[4]=&iy[5]=&iy[6]=&iy[7]=&iy[8]=&iy[9]=&iy[10]=&iy[11]=&iy[12]=&iy[13]=&iy[14]=&iy[15]=&iy[16]=&iy[17]=&iy[18]=&iy[19]=&iy[20]=&iy[21]=&iy[22]=&iy[23]=&iy[24]=&iy[25]=&iy[26]=&iy[27]=&iy[28]=&iy[29]=&iy[30]=&irange1=&irange2=&xlow=-10&xhi=10&xint=1&iunits=1&scale=100&iwhite=1&iswitch=0&Submit=Create+Plot 2019-20 prog: MW 2 too cold, NE close; SE 2-3 too cold, W 0-2 too cold; grade A 2019-20 actual: https://psl.noaa.gov/cgi-bin/data/usclimdivs/climdiv.pl?variab=Temperature&type=1&base=7&mon1=12&mon2=2&iy[1]=2019&iy[2]=&iy[3]=&iy[4]=&iy[5]=&iy[6]=&iy[7]=&iy[8]=&iy[9]=&iy[10]=&iy[11]=&iy[12]=&iy[13]=&iy[14]=&iy[15]=&iy[16]=&iy[17]=&iy[18]=&iy[19]=&iy[20]=&iy[21]=&iy[22]=&iy[23]=&iy[24]=&iy[25]=&iy[26]=&iy[27]=&iy[28]=&iy[29]=&iy[30]=&irange1=&irange2=&xlow=-10&xhi=10&xint=1&iunits=1&scale=100&iwhite=1&iswitch=0&Submit=Create+Plot 2018-9 prog: MW 1 too warm, NE close, SE 2-3 too cold, W 2-3 too warm; grade B 2018-9 actual https://psl.noaa.gov/cgi-bin/data/usclimdivs/climdiv.pl?variab=Temperature&type=1&base=7&mon1=12&mon2=2&iy[1]=2018&iy[2]=&iy[3]=&iy[4]=&iy[5]=&iy[6]=&iy[7]=&iy[8]=&iy[9]=&iy[10]=&iy[11]=&iy[12]=&iy[13]=&iy[14]=&iy[15]=&iy[16]=&iy[17]=&iy[18]=&iy[19]=&iy[20]=&iy[21]=&iy[22]=&iy[23]=&iy[24]=&iy[25]=&iy[26]=&iy[27]=&iy[28]=&iy[29]=&iy[30]=&irange1=&irange2=&xlow=-10&xhi=10&xint=1&iunits=1&scale=100&iwhite=1&iswitch=0&Submit=Create+Plot 2017-8 prog: MW 3 too warm, NE 2 too warm, SE/W close; Grade C 2017-8 actual https://psl.noaa.gov/cgi-bin/data/usclimdivs/climdiv.pl?variab=Temperature&type=1&base=7&mon1=12&mon2=2&iy[1]=2017&iy[2]=&iy[3]=&iy[4]=&iy[5]=&iy[6]=&iy[7]=&iy[8]=&iy[9]=&iy[10]=&iy[11]=&iy[12]=&iy[13]=&iy[14]=&iy[15]=&iy[16]=&iy[17]=&iy[18]=&iy[19]=&iy[20]=&iy[21]=&iy[22]=&iy[23]=&iy[24]=&iy[25]=&iy[26]=&iy[27]=&iy[28]=&iy[29]=&iy[30]=&irange1=&irange2=&xlow=-10&xhi=10&xint=1&iunits=1&scale=100&iwhite=1&iswitch=0&Submit=Create+Plot ——————— -GPA: 2.0 -Last 3 poor -Best 2019-20 and 2021-2; worst 2024-5 -2 A, 1 B, 1 C, 3 D, 1 F -The Sept ‘25 fcast for 2025-6 is for US as a whole the 2nd warmest to 2024-5 since 2017-8 -NE prog misses: +4, -3.5, -3, 0, +3, 0, 0, +2; so, NE prog was too warm thrice, too cold twice, and close thrice; So, NE prog on avg was only 0.3 F too warm vs actual meaning negligible bias vs actual though avg miss was by ~2 F -MW prog misses: +4, -6.5, 0, 0, +2, -2, +1, +3; so, MW prog was too warm 4 times, too cold twice, and close twice; So, MW prog on avg was only 0.2 F too warm meaning negligible bias vs actual though avg miss was by ~2 F -SE prog misses: +4, -2, -1.5, 0, +3, -2.5, -2.5, 0; so, SE prog was too warm twice, too cold 4 times, and close twice; So, SE prog on avg was only 0.2 F too cool vs actual meaning negligible bias vs actual though avg miss was by ~2 F -W prog misses: +2, 0, +6, +2, +1.5, -1, +2.5, 0; so, W prog was too warm 5 times, too cold once, and close twice; So, W prog on avg was 1.6 F too warm! Thus, there appears to be a notable Euro warm bias for the W for winter at least in Sept progs. Avg miss was ~2 F
-

Occasional Thoughts on Climate Change
gallopinggertie replied to donsutherland1's topic in Climate Change
It will almost definitely be too late, yeah. The current extinction rate of species is like 100 times above the typical background rate because of human activity (and honestly, climate change is just the tip of the iceberg). On some level, we like to think we’re separate from the rest of nature, but of course we aren’t… -
Quite warm out there tonight. The juice is back. Luckily we only have to endure the juice for another day or so, then back to more pleasant, less juicy air with a NW flow behind the front.
-

Saturday 9/6 Strong/Severe storm potential
Torch Tiger replied to Torch Tiger's topic in New England
Mine are bulletproof. Talk to me tomorrow when your roof is in Epsom -
I feel like the Gulf Coast has constant waterspouts, maybe frequency moving north due to AGW?
- Today
-
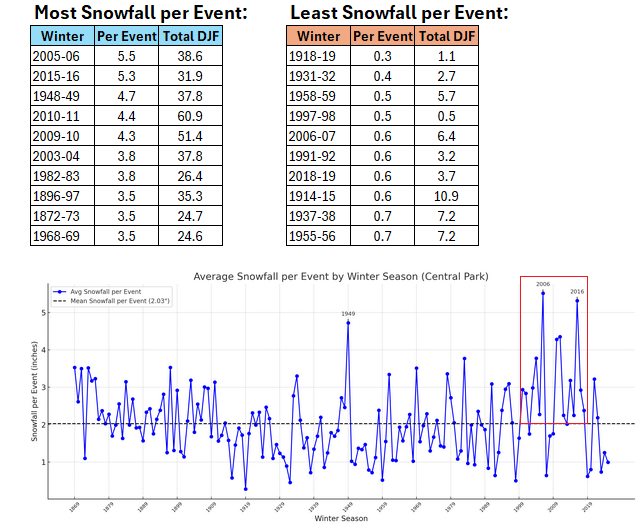
With ECMWF seasonal maps coming out, focus briefly turns to the coming winter. While it is far too soon to expect much skill from the models, recent winter outcomes suggest that New York City is beginning to put distance between the present and a golden snowfall era. The core of winter (December-February) was especially snowy for the most part from Winter 1999-00 through Winter 2017-18. Storms dumped an average of 2.9" per event and there were 30 days with 6" or more snow, including 9 with 10" or more. The December-February periods saw an average of 28.2" of snow. For all other winters, storms averaged 1.9" per event with the December-February period averaging 20.8".
-
You should all know that starting this thread is the kiss of death for anything exciting
-
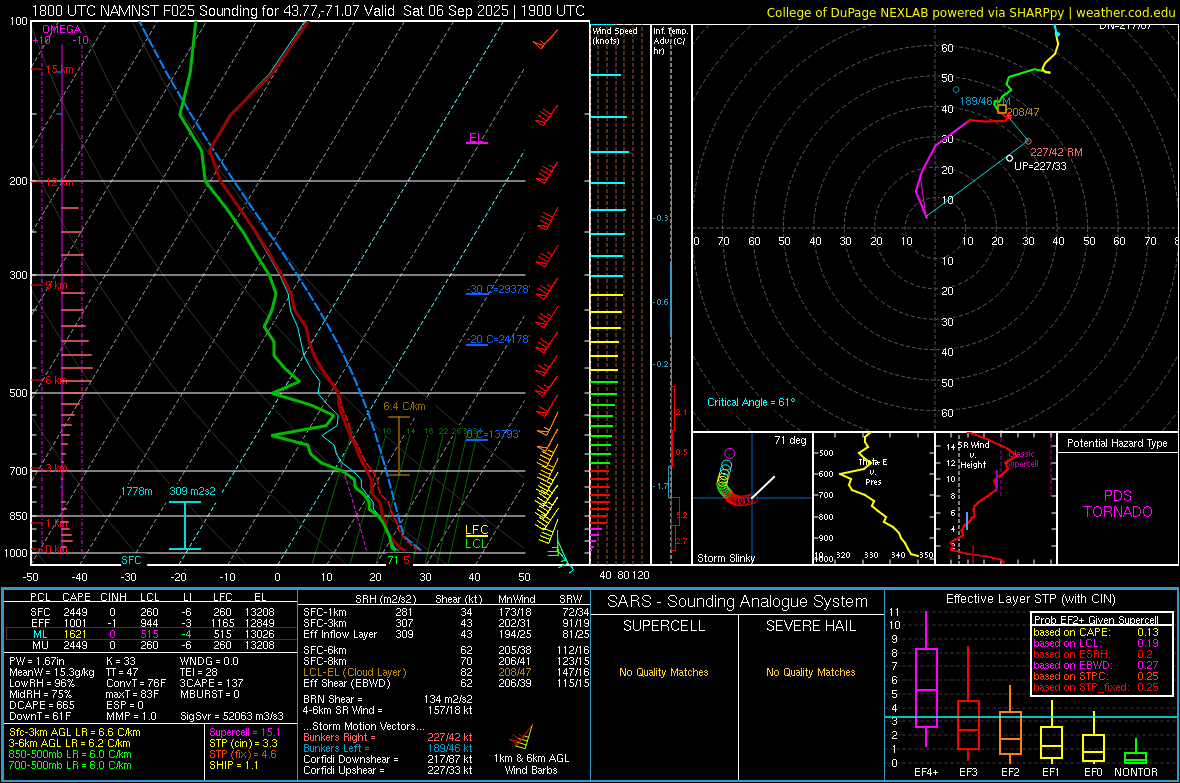
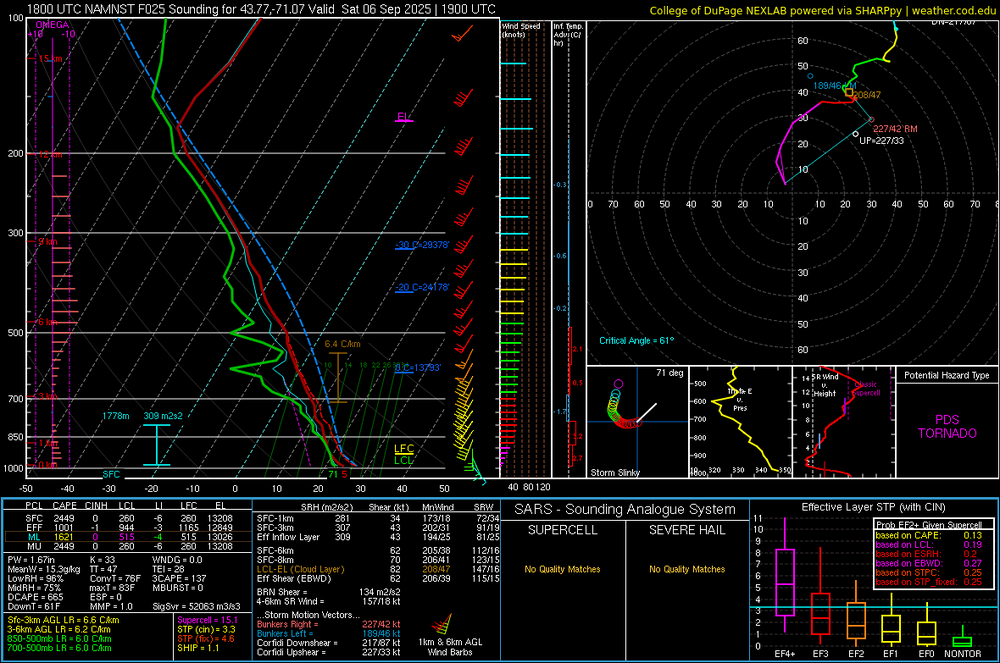
Checking out some soundings on the 0z NAM and don't see the funky profile in the lowest km anymore...so its much steeper with the llvl lapse rates. Hell this even looks better in terms of tornado risk, especially early on when storms are discrete and organizing into a line.
-
Up in the city for my wife's bday this weekend and was just out at crispus attucks for outdoor movie night and it's pretty gross out there. The moon is pretty cool though. Lots of mosquitoes. Looking forward to the front that's coming through this weekend.
-
We can always go higher
-
We pray for the 3k
-
It will be interesting to see how tomorrow pans out. I don't think we're looking at widespread severe weather but maybe we see something along the line of a concentrated swath of wind damage reports focused where any bowing segments occur. Even with poor mid-level lapse rates, I think if we had better and stronger shortwave forcing that could yield greater potential for a swath of wind damage across the region. The greatest severe weather potential may also be early on, which would favor far western sections as activity develops. LFC heights aren't too bad, so if parcels can get to the LFC easily the initial storms could be potent with risk for a tornado. But I could see this evolving more into a torrential rain/gusty wind on the leading edge ordeal very quickly. Probably Berkshire County, Litchfield County, Fairfield County into western Hartford/Hamden/Hampshire counties for best severe potential...which matches up well with where the slight risk is.
-
Seasonal snowfall model projecting most of the country well below normal like it did last year. Canada well above Snowfall.
-
moonrise shot
-
2025-2026 ENSO
Daniel Boone replied to 40/70 Benchmark's topic in Weather Forecasting and Discussion
Exactly. We averaged normal here. Model had us projected well below snowfall. -
.thumb.png.4150b06c63a21f61052e47a612bf1818.png)
Saturday 9/6 Strong/Severe storm potential
HIPPYVALLEY replied to Torch Tiger's topic in New England
Same -

Saturday 9/6 Strong/Severe storm potential
WxWatcher007 replied to Torch Tiger's topic in New England
Meh. -

September 2025 OBS-Discussion centered NYC subforum
Stormlover74 replied to wdrag's topic in New York City Metro
And the moon is orange -
Whoa....no more Jebwalks. I was quiet but read about them for years.
-
LOL. I used to set up the hurricane models on the supercomputers. Like every day. You posers think you're the cool kids. Silly, CAPE.
-

E PA/NJ/DE Autumn 2025 Obs/Discussion
MGorse replied to PhiEaglesfan712's topic in Philadelphia Region
I think it might be smoke from Canadian wildfires that rotated around the large closed low centered just north of the Great Lakes. -
Saturday 9/6 Strong/Severe storm potential
Torch Tiger replied to Torch Tiger's topic in New England
Hopefully a few tors to spice things up. -
E PA/NJ/DE Autumn 2025 Obs/Discussion
MGorse replied to PhiEaglesfan712's topic in Philadelphia Region
0.13” here yesterday. Better than nothing! Hopefully Saturday brings much more rain!