All Activity
- Past hour
-
Above freezing today and the blazing sun did its dirty work. I've seen every body of water completely frozen over. That's the first time in a very long time.
-
Bar is low, but itll probably produce more here than the last 90 storm page thread
-
minus the "great" part.
-
Total or near-total snowfall shutouts at NYC from Feb 1 to Apr 30 include 2002 and 2020 (Tr amounts, and 2012 (0.2"). These were after poor starts of 3.5" (Jan 2002), 4.8" (Dec 2019, Jan 2020) and 7.2" (Oct 2011 and Jan 2012). 1878 was also quite poor, 2.0" in Feb and no snow in March or April followed just 6.1" in Jan 1878. 1953-54 was not much better with 0.9" in total Feb-Apr following 14.9" (Nov 1953 and Jan 1954; Dec 1953 also had no snow). 1931-32 and 1972-73 were low-snowfall throughout. In 1932, 2.4" followed just 2.9" earlier, and in 1973, 1.0" followed 1.8". Recent dud winters 2022-23 and 2023-24 had most of their small totals in February so they don't make this list. Other low producers include some better winters overall ... These are the winters that had less than 2.0" in total from Feb 1 on (in addition to the above seven generally low-snowfall winters) ... 1924-25 ... 1.3" followed 28.3" mostly in Jan 1924. 1952-53 ... 1.3" followed 13.8" from Oct 1952 to Jan 1953 1970-71 ... 1.7" followed 13.8" from Dec 1970 and Jan 1971. 1987-88 ... 1.5" followed 17.6" from Nov 1987 to Jan 1988. If this winter produces less than 2" more snow, it would be the second largest winter snowfall to include that level of snow drought (1924-25 would remain ahead) Conversely, the highest winter snowfall following 22" or less to Jan 31 appears to be 1993-94, starting Feb with 18.9" and ending the winter at 53.4" ... second is 1906-07, going from 12.3" after Jan 1907 to 53.2" by end of April 1907. Third place goes to 1933-34 (15.5" to 52.0"), then fourth was 1966-67 when 10.5" expanded to 51.5" after a snowy Feb and Mar 1967, next fifth place 2009-10 when 14.9" ended up at 51.4", followed by (tied) sixth place 1915-16 going from 8.8" to 50.7" matched the next year (1916-17) when 14.3" went to 50.7" ... 8th was 2014-15 (17.9" to 50.3") then 9th 2002-03 (15.9" to 49.3") and 10th 1919-20 going from 17.0" to 47.6", then 11th 1895-96, at only 3.0" to end of Jan, adding 43.0" in Feb to Apr 1896 for a total of 46.0" (after which it turned record hot for about a month mid-April to mid-May) ... and 12th place was 1887-1888 which got to 45.5" from 20.3" after Jan, adding just 3.0" in Feb and the Blizzard of 1888 plus a few other inches in March (22.2") (and none in April). 13th place is 1958 (went from 17.9" to 44.7" total). More recently 2020-2021 added more than half of its total of 38.6" after Feb 1st (barely). It would be nice if 2026 could find a place in this rather extensive list.
-

Winter 2025-26 Medium/Long Range Discussion
mimillman replied to michsnowfreak's topic in Lakes/Ohio Valley
Revenge of the west. Pacific angry. Torch and Feb thunderstorm pattern ahead -

Is we back? February discussion thread
40/70 Benchmark replied to mahk_webstah's topic in New England
See, this is what I mean...guidance is constantly biased too great in both amplitude and residence time in phase 8 the past decade, but it's been the opposite in the MC phases. Take the under on phase 8 and win every time. Last year and especially this year, we have seen the north Pacific flip to allow for more cold, but we are still falling short on east coast amplification...undoubtedly tied the aforementioned IMHO. I'm sure the faster flow is also a factor, but this is why other areas can still overcome it. -
Looks to me like euro ai got worse, more cutterish for 14-15th with strong primary Midwest and redevelopment later and on gulf of maine
-
60 miles.
-
Is we back? February discussion thread
40/70 Benchmark replied to mahk_webstah's topic in New England
Interesting is a subjective term, I guess. -
Is we back? February discussion thread
40/70 Benchmark replied to mahk_webstah's topic in New England
Cold definitely hasn't been meh...but seasonal snowfall has for a lot of us, and the expanse of meh in that respect is growing by the day. -

February 2026 Medium/ Long Range Discussion: Buckle Up!
Weather Will replied to Weather Will's topic in Mid Atlantic
Cape discussed this period several times. When the time is right, the ensemble guru can make the call... -
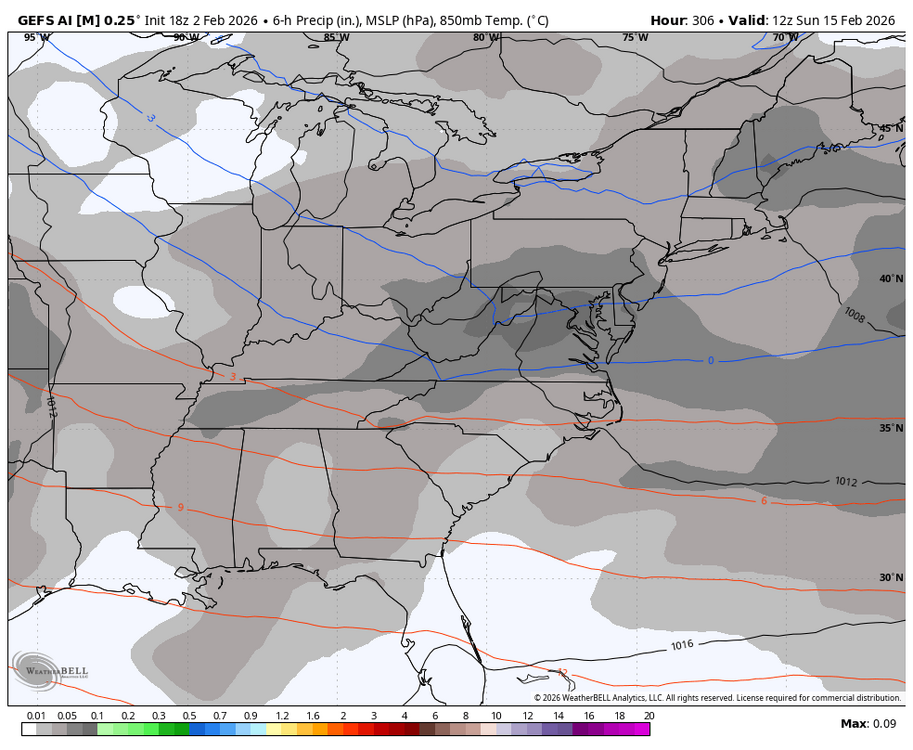
It's an ensemble mean, otherwise i wouldn't have mentioned it. But yeah still pretty far out there. I'm sure we'll get at least 1 or 2 threats in mid-late feb. AI is still in it's very early development but it's caught my eye to be at least worth watching and taking note of this winter. Especially Euro AI/AI EPS, it's done well from my perspective
-

Central PA Winter 25/26 Discussion and Obs
canderson replied to MAG5035's topic in Upstate New York/Pennsylvania
The moon is spectacular - took this driving down front street across the river -
18z euro is still on the more interesting side this weekend. Could be another higher end norlun setup, obviously favoring coastal ME
-
Yes. 2/13-14 on euro Skynet and GFS Skynet has a couple threats…one around 2/11 and another 2/15.
-
Got to 37F briefly in the neighborhood today, but was down to 33F when I left the house and falling. Expecting some black ice issues to crop up with some of this melting and subsequent refreezing. Stuff will take a small hit next few days, even with any refresher snow we receive before it settles back to pure concrete this weekend.
-
Yeah I noticed that too. Hopefully it’s right.
-
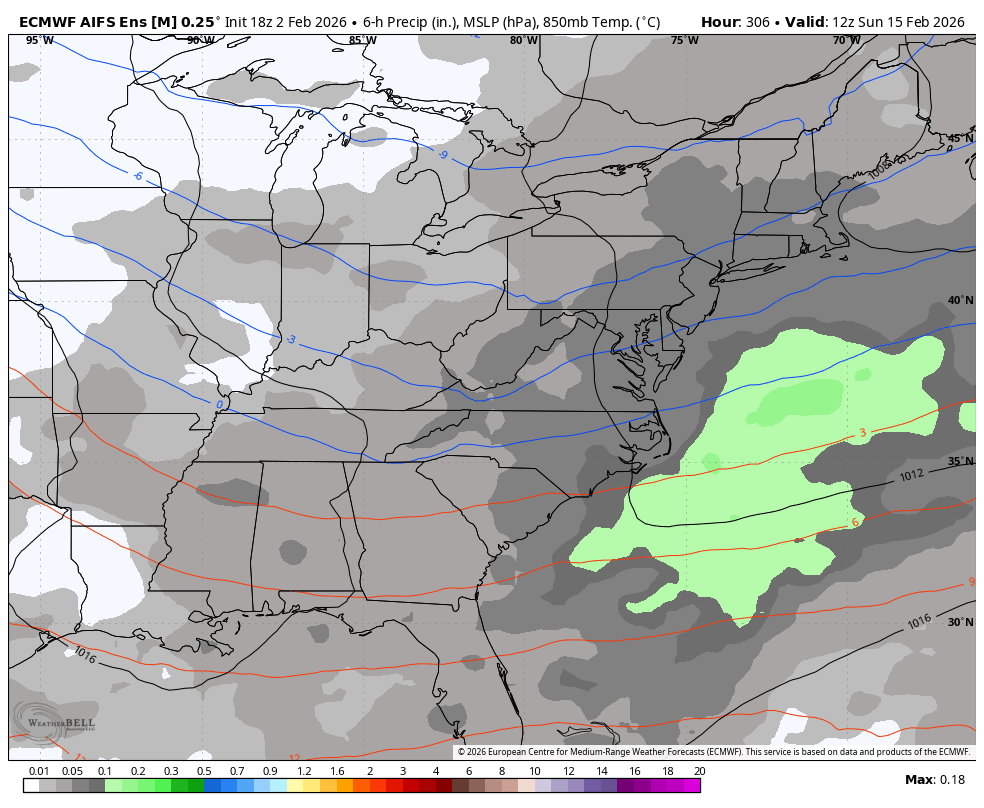
The Euro AI has been very consistent in showing a maximum along the VA border
-
Way out Clown range, but rather it look weenieish than not. Let’s get a storm in here on the 13th to start the long weekend early….
-

February 2026 Medium/ Long Range Discussion: Buckle Up!
BristowWx replied to Weather Will's topic in Mid Atlantic
Just details to be worked. Start a thread and see where is goes. -

Possible coastal storm centered on Feb 1 2026.
The 4 Seasons replied to Typhoon Tip's topic in New England
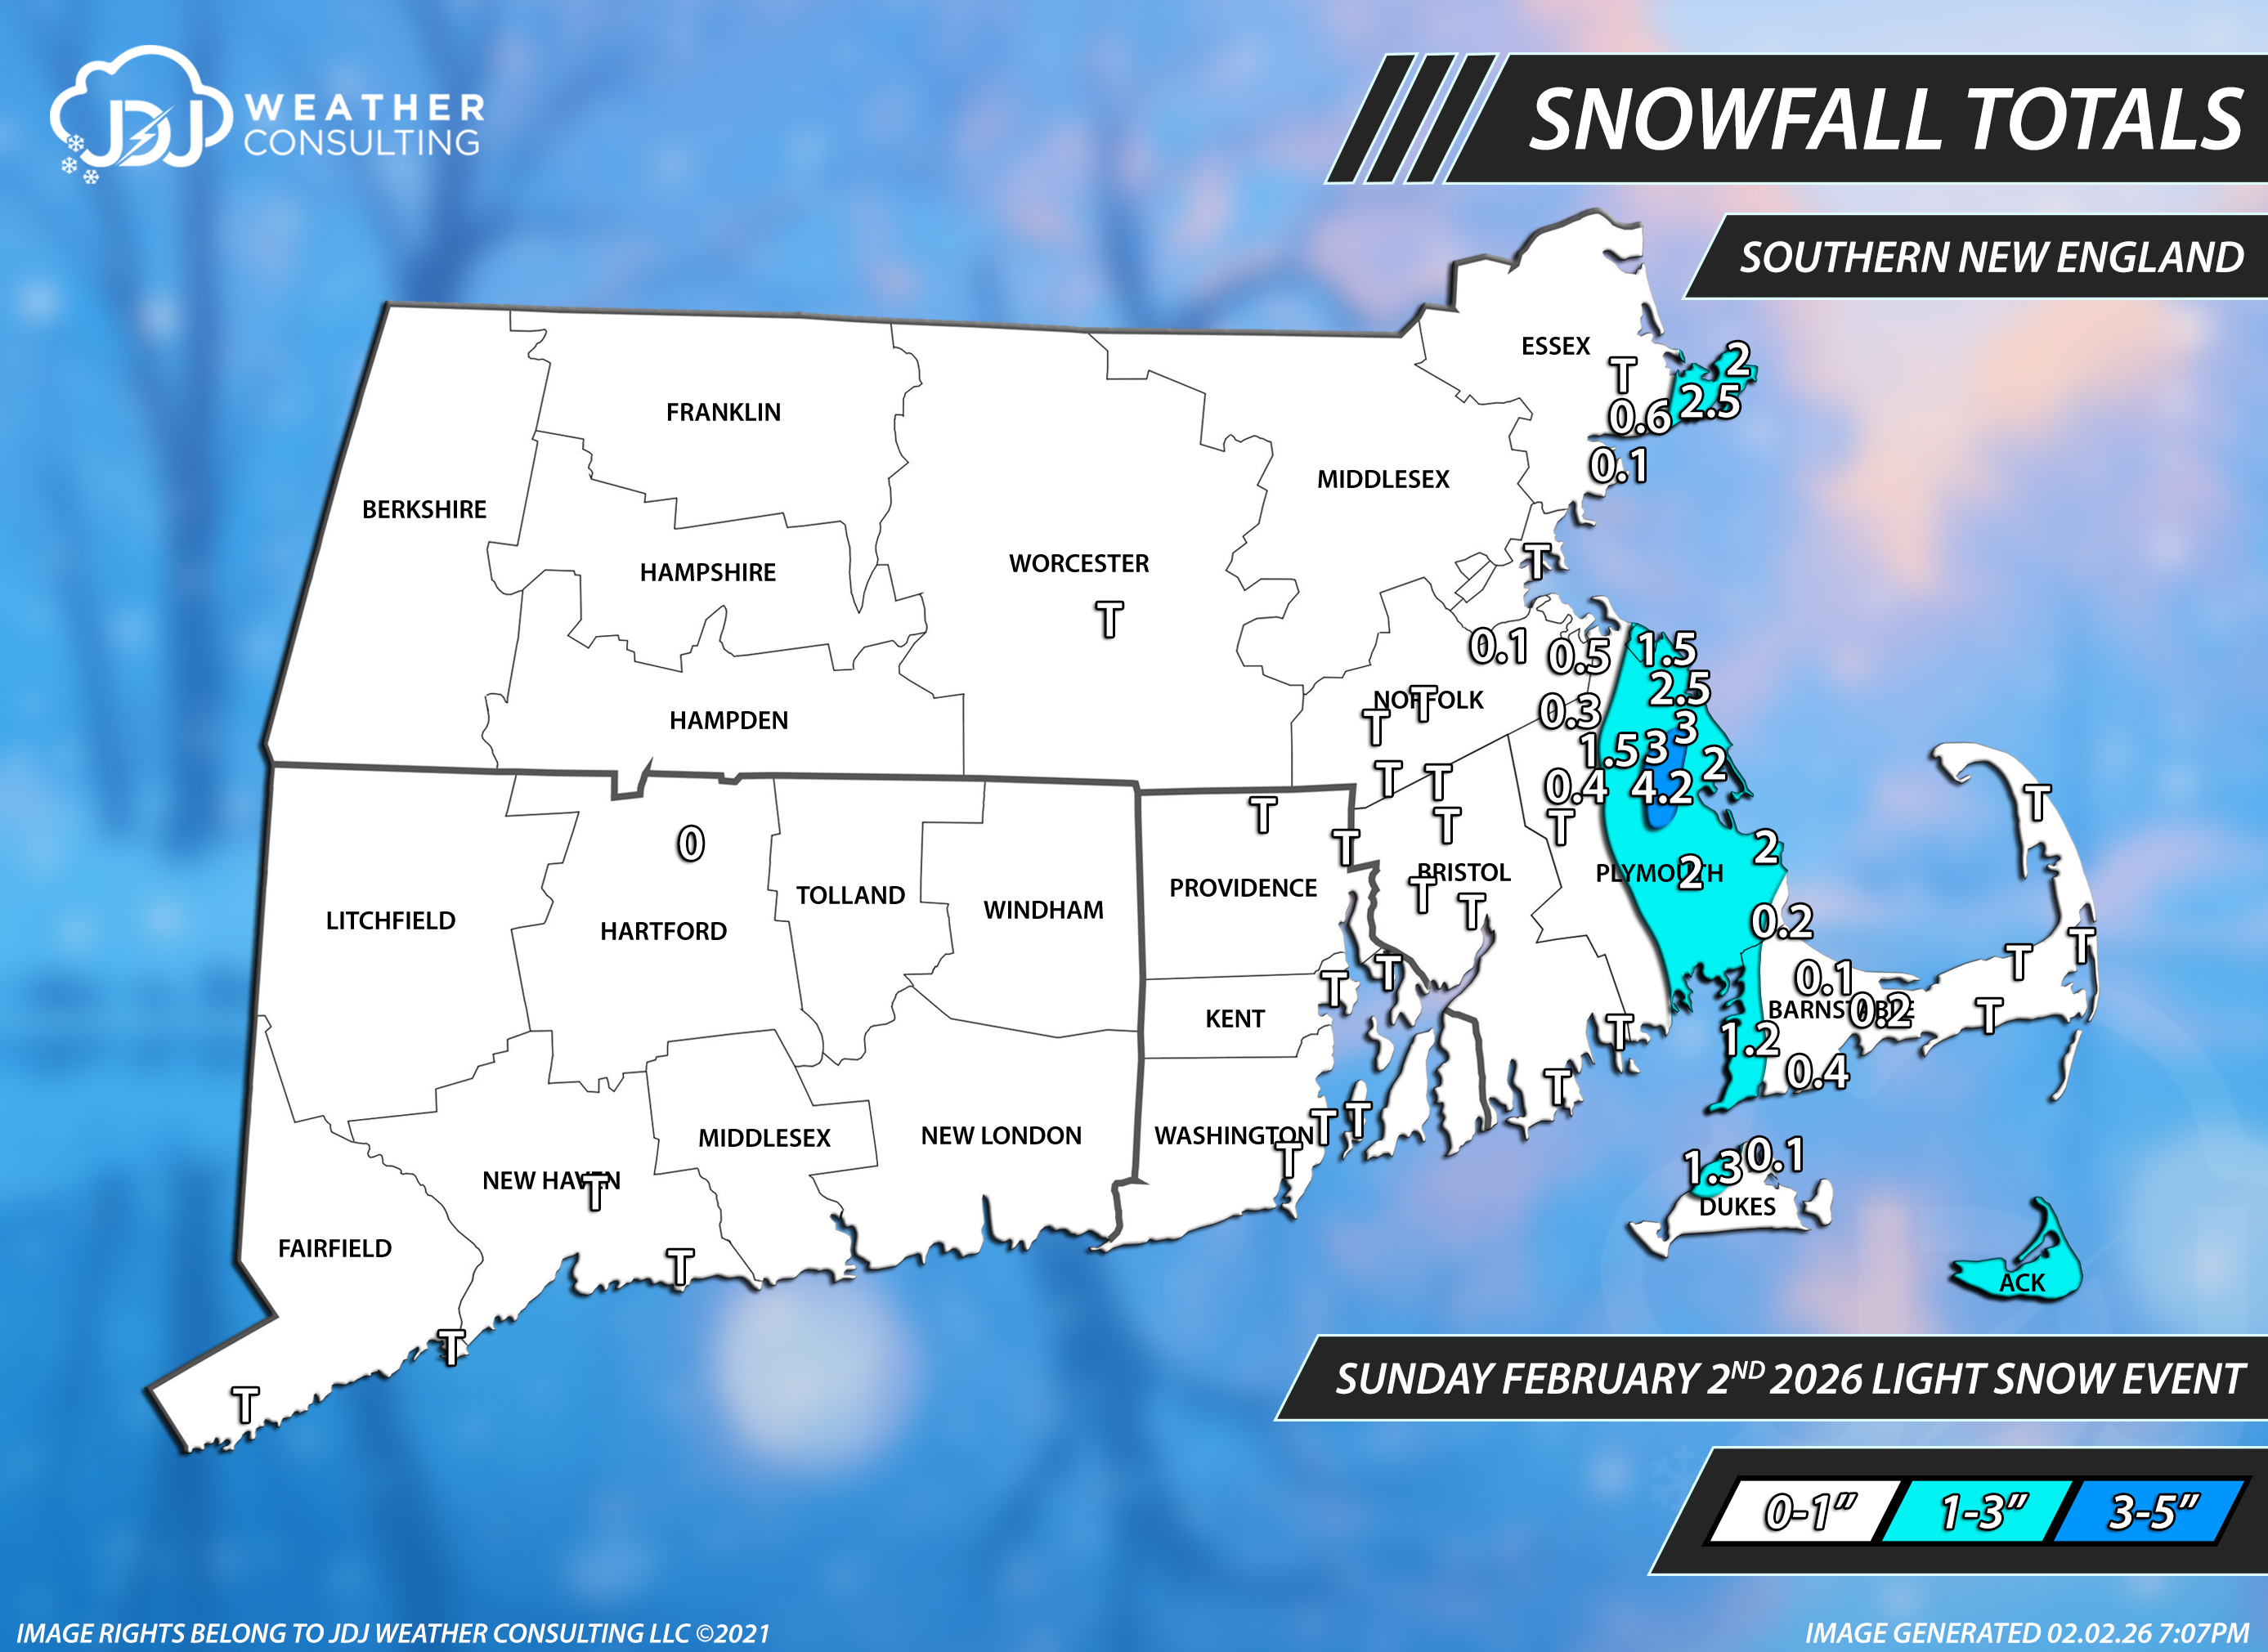
Snowfall totals from this "event". Decided to paint ACK with 1-3" range despite no reports from there based on radar and ACK ASOS obs.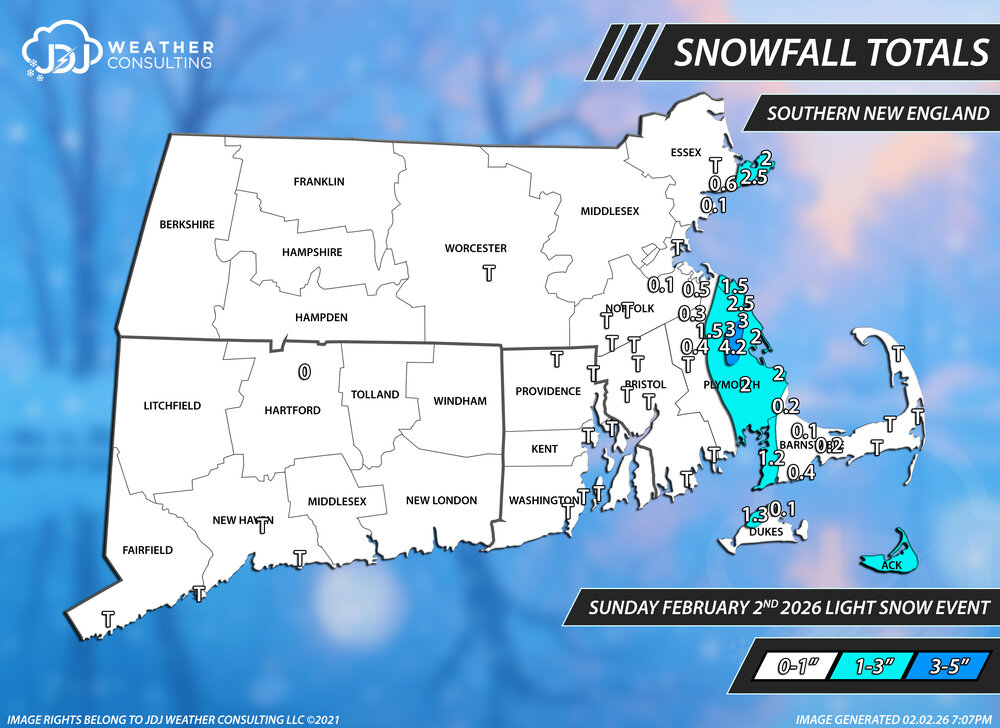
-

February 2026 Medium/ Long Range Discussion: Buckle Up!
EastCoast NPZ replied to Weather Will's topic in Mid Atlantic
Those went extinct in the 90s. -
February 2026 Medium/ Long Range Discussion: Buckle Up!
Weather Will replied to Weather Will's topic in Mid Atlantic
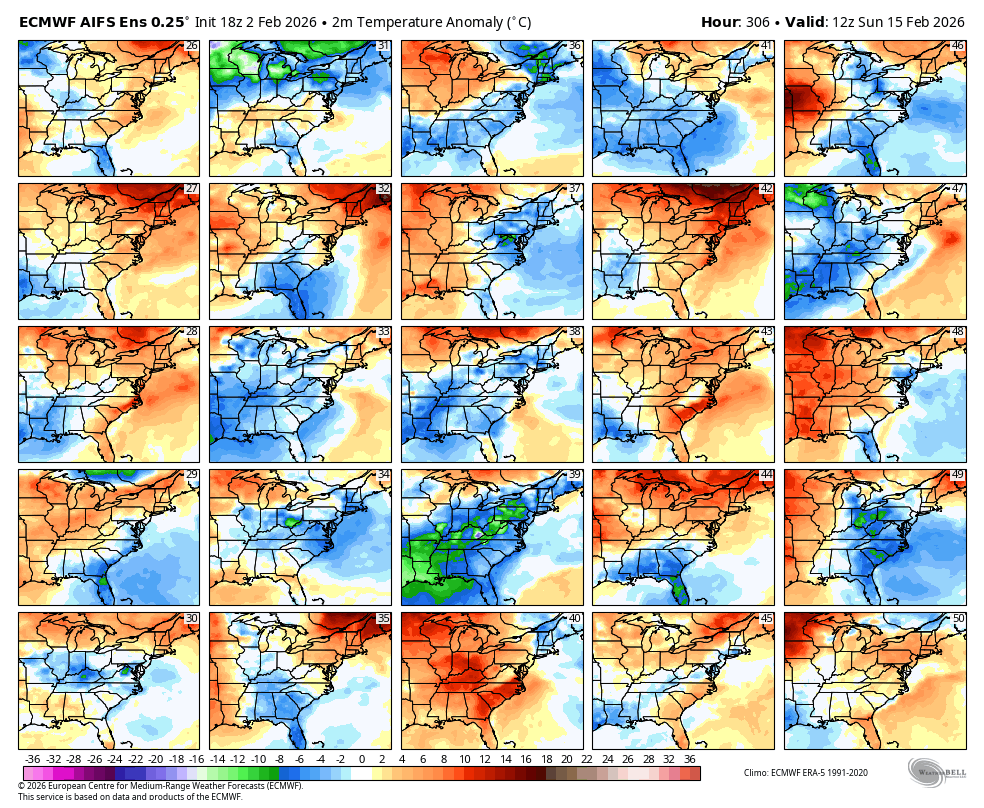
WB 18Z EPS AI actually has more cold members the weekend of the potential storm.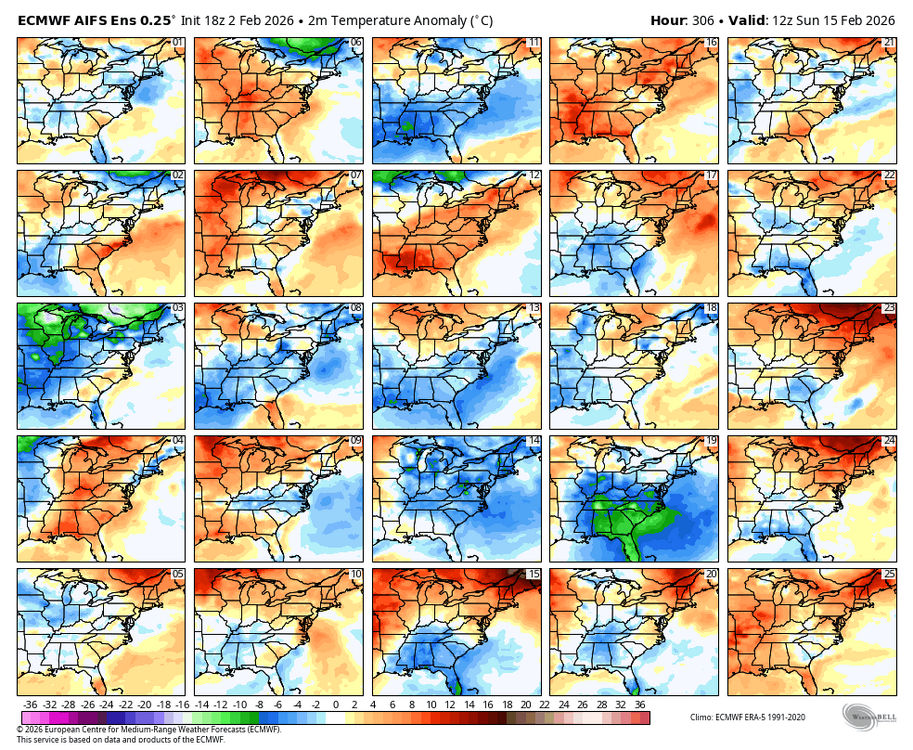

-
Possible coastal storm centered on Feb 1 2026.
The 4 Seasons replied to Typhoon Tip's topic in New England
first time i think ive ever seen someone talk about 2-3" drifts and not be a typo. -
February 2026 Medium/ Long Range Discussion: Buckle Up!
Weather Will replied to Weather Will's topic in Mid Atlantic
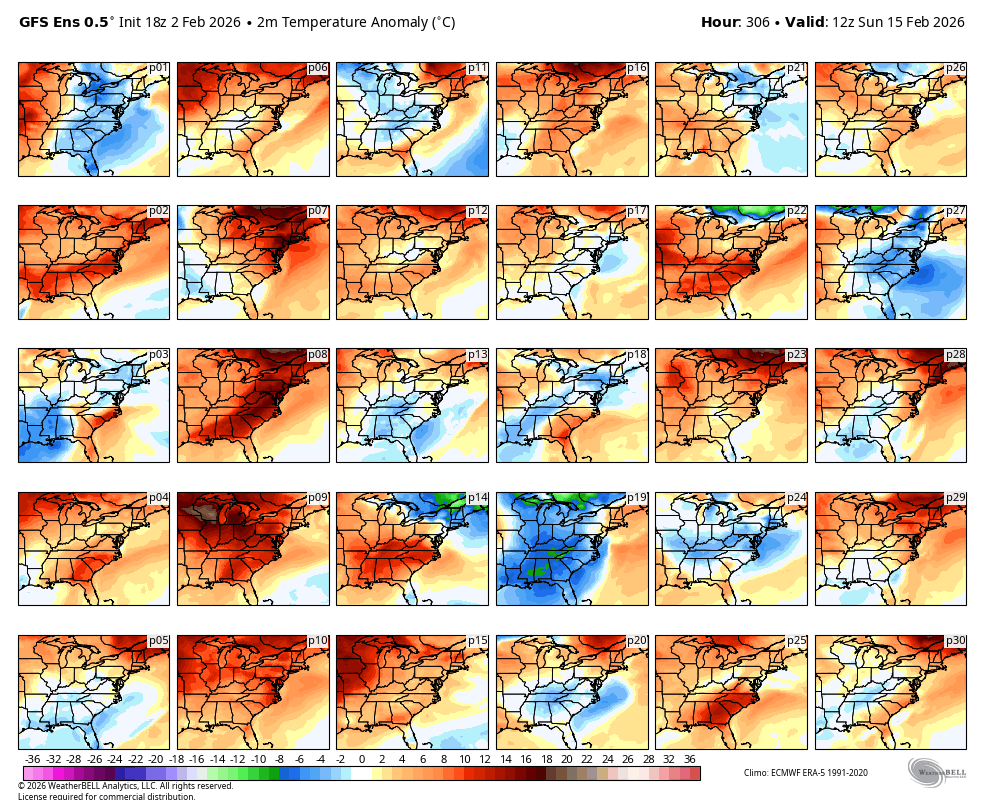
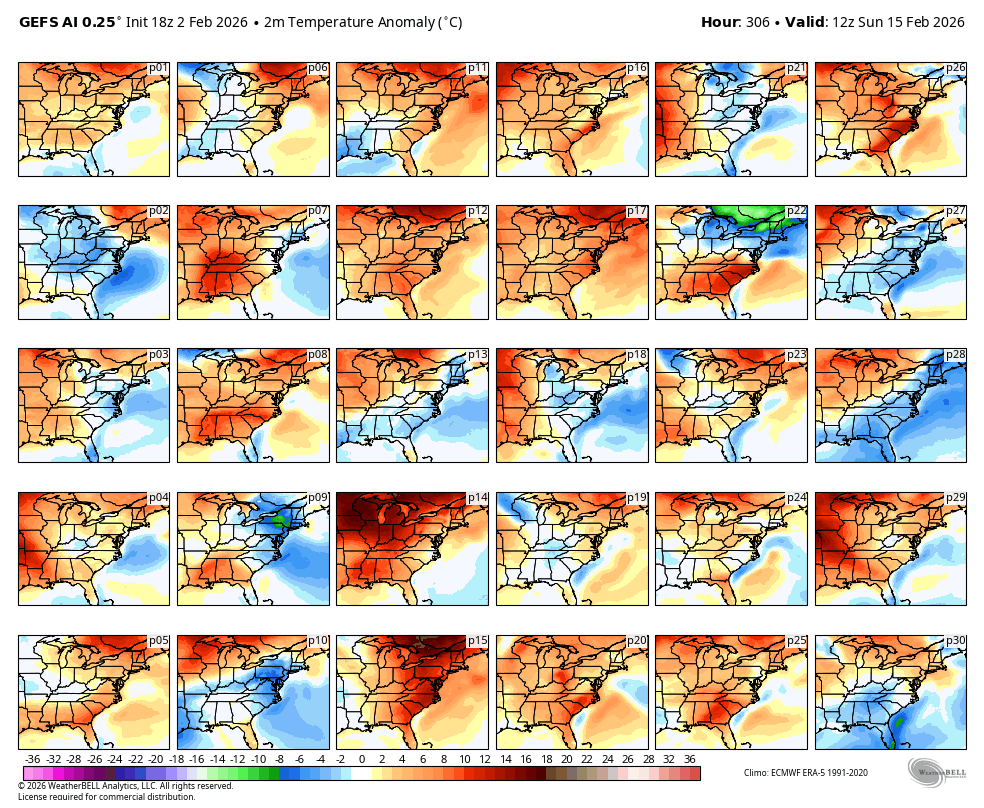
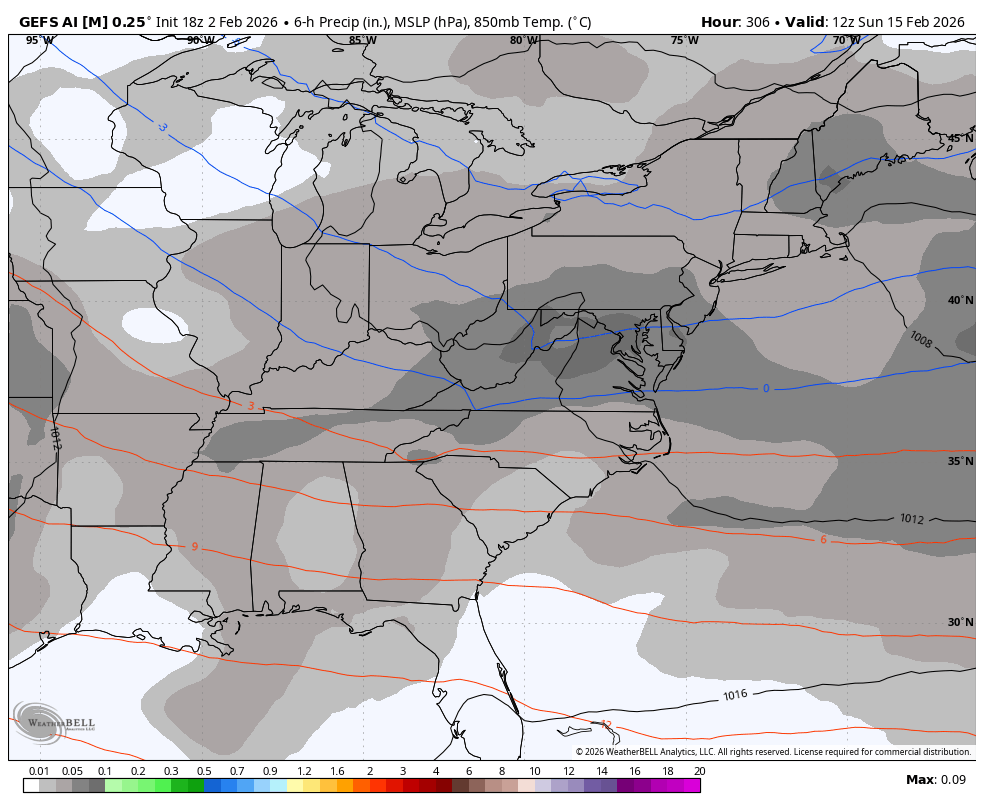
Neither the WB 18Z GEFS or its AI are showing cold enough air to support a snow storm on the weekend of the AI GFS blizzard on most of its members.