All Activity
- Past hour
-
Per yesterday’s Euro Weeklies, it’s overall looking to overall average mild from the Mid-Atlantic-OH Valley-lower Midwest south for most of the 4 week long period 12/22-1/18. Could it end up verifying well? Of course, especially the earliest portion, when statistically there’s more skill. Will it? Nobody could possibly know, of course! Notwithstanding the poor performance for the 3 weeks from just before Thanksgiving through mid Dec, the Euro Weeklies have been just good enough at foretelling general trends that they shouldn’t be ignored by any means. But could they largely end up failing, especially for the Jan portion? Of course they could.
-
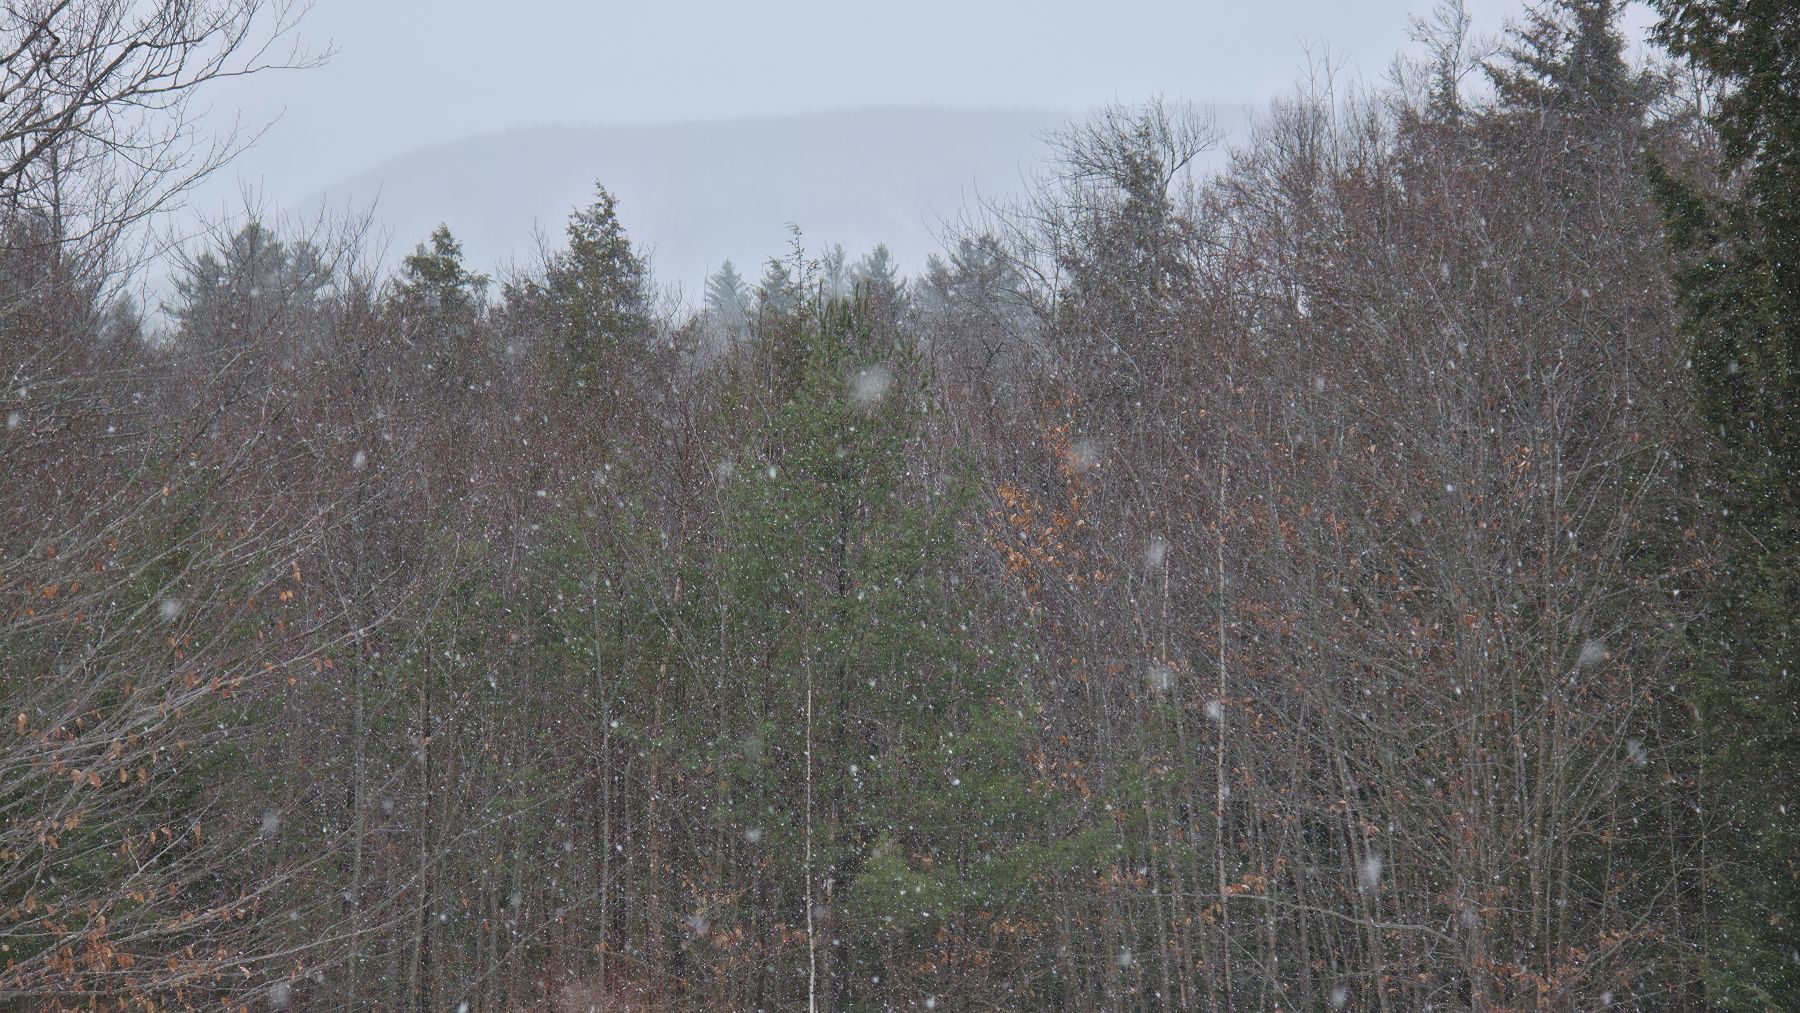
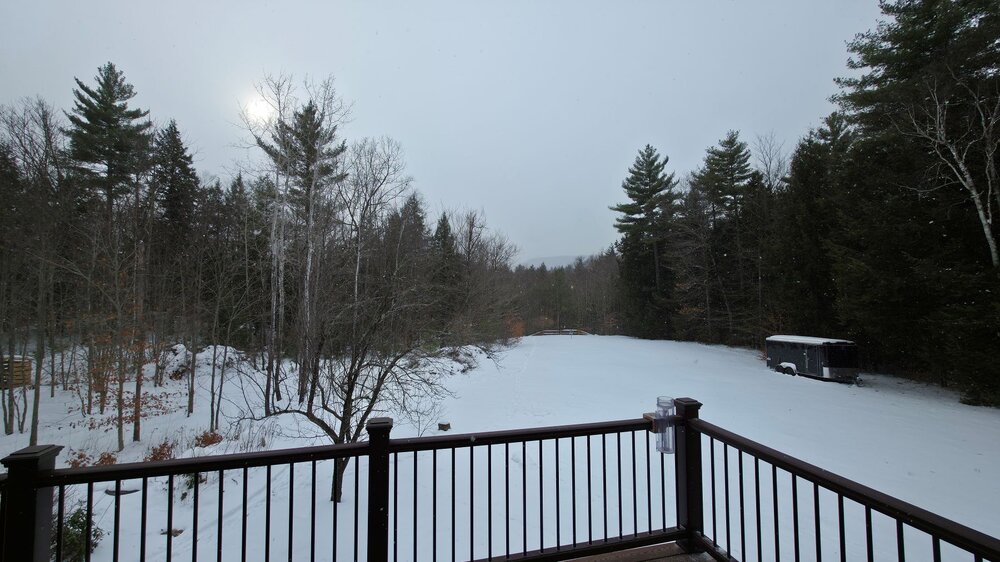
5.5” and still snowing. Not bad since we were never even under an advisory until most of this fell. Still snowing and looks like we could still get another 2-3”. .
-
Funnily enough, the last time we had a really cold xmas was in dec 2022. Torchapalooza afterward. So if there is going to be a torch, I’ll take one before prime climo.
-
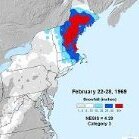
Since 1995-1996 we have had 15 La Niña winters as defined by the RONI index. 14 out of 15 of those winters followed a repeating pattern which has been common the last 30 years. EWR, NYC, and LGA December snowfall pattern repeated throughout the entire winter. The Decembers with under 4” of snowfall at those stations went on to below average seasonal snowfall. With the Decembers over 4” or snow featuring average to naive average snowfall. You might ask how can this work out over 90% of the time? My guess is that La Ninas tend to show what they are capable of early on in the season. Plus as our climate has warmed it has lead to more repeating and persistent patterns. So I view this December to winter snowfall relationship more as a marker of a deeper underlying shared pattern rather than something that is directly causing the outcome. What is misleading about showing the long term snowfall trend in NYC since the regular observations began in the late 1800s? As the long term climate has warmed, the snowfall has gone down. There have been shorter term up trends like from the 80s to 10s against the long term decline. Plus snowfall measurements prior to the 1980s would be higher if measurements were taken as frequently as we do today. They also substituted melted down snow gauge measurements at times like in 1888 blizzard which undercounted the higher ratios back in the much colder era. So the actual downward trend line is steeper if we correct for the different way we measure snow now.
-
Evergreen quote for this subforum.
-
Looks like the post-Xmas 1984 warm shot. ORH hit 70F in that. Latest 70F on record.
-
Its a wait and see type deal for the fence sitters.
-

12/12: The little Friday clipper that could? Or won't.
H2O replied to dailylurker's topic in Mid Atlantic
Is this thread for the Sunday event or Xmas warm up? -
I mentioned in the other thread I thought this might verify colder than modeled. Might not mean much in terms of sensible wx but could make a difference hyper locally
-
I got $20 that temps on Xmas will NOT be what a model two weeks before says it will be.
-

12/12: The little Friday clipper that could? Or won't.
WxUSAF replied to dailylurker's topic in Mid Atlantic
Gonna ignore the white dot over my house -
Uh, well it Fs us both pretty badly, but other people cash in
-
December 2025 regional war/obs/disco thread
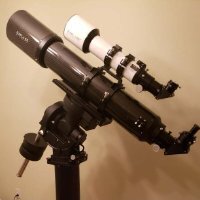
AstronomyEnjoyer replied to Torch Tiger's topic in New England
29.7°, light snow with the sun still coming through. Looks pretty. Hoping for an inch of glop 'round these parts. *edit: Android's stock compression algorithm is hot garbage. Moved to windows and fixed the images.
-

December 2025 regional war/obs/disco thread
TauntonBlizzard2013 replied to Torch Tiger's topic in New England
Looks like it would probably cut across NNE -

Pittsburgh/Western PA WINTER ‘25/‘26
ChalkHillSnowNut replied to Burghblizz's topic in Upstate New York/Pennsylvania
What happened to the Mark Model??! -

Winter 2025-26 Short Range Discussion
sbnwx85 replied to SchaumburgStormer's topic in Lakes/Ohio Valley
Clipper train going off the rails. -
2.5" here that got rained on so it was a sloppy mess. Back to the freezer for a few days
-
Icon has zero interest for Friday or Sunday.
-
The trend line is misleading. It compares the past couple of years to the 1800s. What does that look like if you start the chart in 1980?
-
12/12: The little Friday clipper that could? Or won't.
dailylurker replied to dailylurker's topic in Mid Atlantic
I'll make that thread tomorrow for the Sunday potential lol -
12/12: The little Friday clipper that could? Or won't.
clskinsfan replied to dailylurker's topic in Mid Atlantic
HRRR with a nice little NOVA/DC band.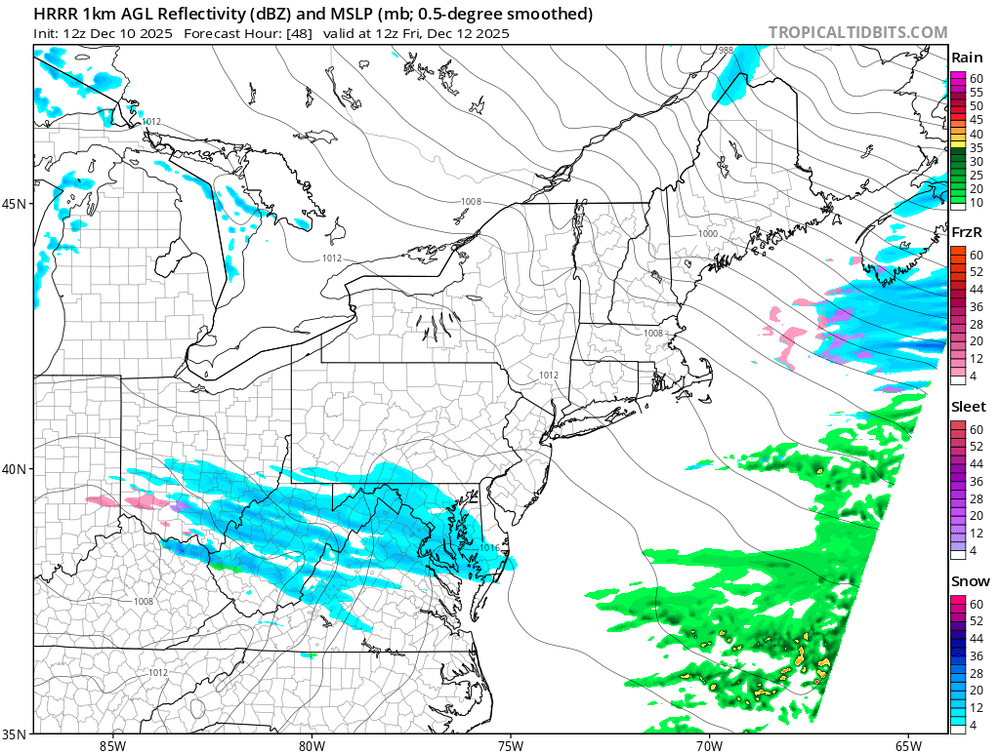
-

Winter 2025-26 Short Range Discussion
A-L-E-K replied to SchaumburgStormer's topic in Lakes/Ohio Valley
12z guidance going the wrong direction for most with these -
I'd say we wait until tomorrow for Sunday when the solution becomes a little bit clearer (or even more unclear with the way models are running nowadays lol)
-
What, specifically are you responding to? The statistical correlation between ENSO 3.4 and NYC seasonal snowfall falls well below statistically relevant skill. And, why, exactly is 4" a meteorologically significant threshold? If we magically get 3.87" of snow vs 4.03" inches of snow we are SCREWED! Sounds like overfitting to me, but what do I know.
-
Oh, ok. New Boston.