All Activity
- Past hour
-
 Vety popup isolated
 -
Gonna be close - clouds meandering in CNJ but plenty of breaks. made it to 86 here. tomorrow next shot at 90 and then we'll see if next Sat/Sun can get sneaky 90s in the hot areas, enhanced if the week continues dry.
-
 Yeah, pretty sure the warm spots away from the water in Queens would have recorded over 50 days reaching 90° back in 2010 since Mineola did. Data for January 1, 2010 through December 31, 2010 90° days Click column heading to sort ascending, click again to sort descending. NJ CANOE BROOK COOP 59 NJ NEWARK LIBERTY INTL AP WBAN 54 NY MINEOLA COOP 52 NJ RINGWOOD COOP 51 NJ HARRISON COOP 50 NY LAGUARDIA AIRPORT WBAN 48 NJ CRANFORD COOP 46 NY BRONX COOP 45 NJ TETERBORO AIRPORT COOP 41 NJ TETERBORO AIRPORT WBAN 40 NY NY CITY CENTRAL PARK WBAN 37 CT DANBURY COOP 37 NY WANTAGH CEDAR CREEK COOP 35 NY DOBBS FERRY-ARDSLEY COOP 34 NY WEST POINT COOP 33 NY JFK INTERNATIONAL AIRPORT WBAN 32 NJ CALDWELL ESSEX COUNTY AP WBAN 31 NJ PLAINFIELD COOP 27 NY MONTGOMERY ORANGE COUNTY AP WBAN 26 CT MERIDEN MARKHAM MUNICIPAL AP WBAN 25 NY FARMINGDALE REPUBLIC AP WBAN 24 CT NORWICH PUBLIC UTILITY PLANT COOP 24 NY PORT JERVIS COOP 22 CT ANSONIA 1 NW COOP 22 Data for January 1, 2010 through December 31, 2010 95° days Click column heading to sort ascending, click again to sort descending. NJ NEWARK LIBERTY INTL AP WBAN 21 NY MINEOLA COOP 20 NJ RINGWOOD COOP 18 NJ CANOE BROOK COOP 18 NY WANTAGH CEDAR CREEK COOP 17 NJ HARRISON COOP 16 NJ CRANFORD COOP 14 NJ TETERBORO AIRPORT WBAN 12 NJ TETERBORO AIRPORT COOP 12 NY BRONX COOP 11 NY LAGUARDIA AIRPORT WBAN 11 NY JFK INTERNATIONAL AIRPORT WBAN 10 CT DANBURY COOP 10 Data for January 1, 2010 through December 31, 2010 100° days Click column heading to sort ascending, click again to sort descending. NY MINEOLA COOP 6 NJ NEWARK LIBERTY INTL AP WBAN 4 NJ HARRISON COOP 4 NY WANTAGH CEDAR CREEK COOP 4 NJ CANOE BROOK COOP 3 NJ RINGWOOD COOP 3 NY JFK INTERNATIONAL AIRPORT WBAN 3 CT DANBURY COOP 3
 -
This also works for multi-quoting in the same thread unless you use a browser from 1997.
-
Hurricane Models continue with a W track. Now as far as 73.1 W 29.3 N The consistent Westward track continues (no panic yet) Tell you if I lived in New England its very concerning.
-
I imagine for folks who lust after high surf this week is your Christmas
-

Hurricane Erin: 160 MPH - 917mb - W @ 17
yoda replied to BarryStantonGBP's topic in Tropical Headquarters
Impressive https://x.com/Sekai_WX/status/1956739362927841415 -
Yea pretty large shift with major implications verbatim for SE Bahamas and would get some coastal flooding and sustained Tropical Storm force winds for Hatteras.
-
Except for the heat and humidity, it looks like a fall day here with people blowing and raking big piles of leaves. Trees are very stressed in this severe drought
-

Hurricane Erin: 160 MPH - 917mb - W @ 17
MJO812 replied to BarryStantonGBP's topic in Tropical Headquarters
Euro came well west with Erin. Outerbanks should watch this carefully -

2025-2026 ENSO
PhiEaglesfan712 replied to 40/70 Benchmark's topic in Weather Forecasting and Discussion
Highest Atlantic Hurricane ACE seasons (2016 and before uses NOAA and Wunderground data, 2017 and later uses NOAA data only): 1 2005 247.65 (winter of 2005-06: cold December, very warm January, near normal temps in February, but a large snowfall on the 11th) 2 1933 235.785 (winter of 1933-34: backloaded winter, snowy February and March, coldest February on record) 3 1893 231.0738 (winter of 1893-94: near normal temps, near normal snowfall, with the bulk in February) 4 1995 227.5513 (winter of 1995-96: wall-to-wall cold and snow, most famous for the Blizzard on January 7) 5 1950 227.1413 (winter of 1950-51: very low snow winter, near normal temps) 6 2004 226.94 (winter of 2004-05: slightly above average snowfall, with notable snowstorm on January 22nd, near normal temps) 7 1926 225.7788 (winter of 1926-27: near normal temps, below average snowfall) 8 2017 224.8775 (winter of 2017-18: slightly above average snowfall, due to snowiest March on record with slightly above average temps due to a near record warm February) 9 1961 196.95 (winter of 1961-62: backloaded winter, snowy February and March, below average temps) 10 1998 181.8838 (winter of 1998-99: above average temps, below average snowfall) 11 2020 180.3725 (winter of 2020-21: slightly above average temps, near normal snowfall, with th bulk in February) 12 1955 178.585 (winter of 1955-56: below average temps due to cold December, near normal snowfall, with March snowstorm) -
Huge shift west on the Euro NC probably gets in on some fun
-
Cat 7 we all go to heaven
-

2025-2026 ENSO
Stormchaserchuck1 replied to 40/70 Benchmark's topic in Weather Forecasting and Discussion
Hard to believe we ever had -AMO, but for 100 years the Atlantic did average 9 named storms per year.. We are already on number 5 with moderately above average SSTAs. This is the 3rd year in a row with top 1% Rapid Intensification where a certain storm jumped over 12-18 hours: 2023 was Lee 2024 was Milton 2025 Erin -
The only case I've seen that sort of supported it was in the Pacific in maybe 2014-2015 or so. I recall numerous fall typhoons directly helped to pump up a big western USA block that just kind of persisted most of the fall and winter after it set up. Of course, maybe that was going to happen anyway, but at least the connection was more obvious. To me, if the ACE connection is real, it would probably matter where the ACE is accumulating, as it could be indicative of something larger in the background state. That would mean its a symptom but not a cause. I could at least entertain that.
-
Hurricane Erin: 160 MPH - 917mb - W @ 17
Stormchaserchuck1 replied to BarryStantonGBP's topic in Tropical Headquarters
Beryl didn't go 75mph to 160mph overnight like those others did, but the strength at that time of year makes it the 4th major anomaly in the last 3 years. -
Thank you Rob. Pretty close to my own, except for the La and final a. As always …..
-
Immabout to detonate a pumpkin spice nuke
-
Coc
-
keep 'em hooked
-
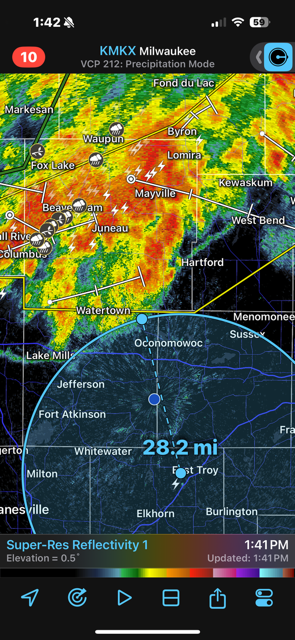
I don’t know if I’ve ever seen a lightning strike so far away from the actual storm.
-

2025 Short Range Severe Weather Discussion
sbnwx85 replied to Chicago Storm's topic in Lakes/Ohio Valley
If the MCS in Wisconsin can hold together that’s a classic Milwaukee to South Bend track. Some of the best storms in memory have taken that route. -
There was/is a very questionable theory that high Atlantic ACE with recurving hurricanes during a -ENSO results in -NAO blocking in winter. I have seen zero hard, convincing evidence that high Atlantic ACE with recurving hurricanes during -ENSOs (La Nina’s/cold-neutrals) cause -NAO blocking in winter. JB has been the biggest pusher of this unproven theory ever since the 1995-96 winter because of the ‘95 Atlantic hurricane season that preceded it
-
Hurricane Erin: 160 MPH - 917mb - W @ 17
Windspeed replied to BarryStantonGBP's topic in Tropical Headquarters
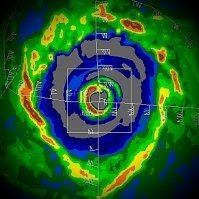
St. Maarten's radar is in closer proximity to Erin's core and, therefore, has better returns from the northern semicircle of Erin's outer circulation. As such, concentric banding is a little more evident here. Perhaps even with a moat forming in-between the northern outer band and Erin's northern eyewall. So we may not be long from an EWRC initiating now during peak intensity. Very thankful recon made those few final passes earlier.