All Activity
- Past hour
-
 sildenafil over the counter or Cheap generic Viagra online Buy generic 100mg Viagra online https://www.onlinefussballmanager.de/forward.php?tid=174752&url=medmennews.xyz Viagra Tablet price and https://mantiseye.com/community/vjklgudjfl Generic Viagra online [url=http://neurostar.com/en/redirect.php?url=http://medmennews.xyz/]Order Viagra 50 mg online[/url] buy Viagra over the counter or [url=http://www.freeworld.imotor.com/space.php?uid=206341]Viagra tablet online[/url] Viagra online price
 -
Viagra online price: Cheapest Sildenafil online - order viagra
- Today
-
buy Viagra online: order viagra - Generic Viagra online
-
Cheap Sildenafil 100mg and Cheap generic Viagra over the counter sildenafil http://images.google.com.pk/url?q=http://medmennews.com sildenafil 50 mg price or http://www.garmoniya.uglich.ru/user/tphfmhsqak/ sildenafil over the counter [url=https://maps.google.es/url?q=https://medmennews.com]Sildenafil 100mg price[/url] Viagra generic over the counter or [url=http://bbs.51pinzhi.cn/home.php?mod=space&uid=8151979]Viagra Tablet price[/url] Order Viagra 50 mg online
-
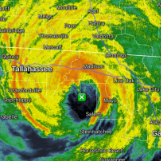
Nice downpour near Toms River heading towards NYC
-
cheapest viagra [url=http://medmennews.com/#]Med Men News[/url] Cheap Sildenafil 100mg
-
 I'm enjoying this Dolphin as the setup is fairly rum. If an eye size is nearing the top percentile I typically take the under but that means the same size remains or an awk transition to a smaller eye. I chuckle watching that wobbly lug of an eye saunter on for days. Those dry air slots are legendary like a whole moon crescent could fit in there
 -
Near record low arctic circle vortex occurring over the next few days. <5100 in the heart of Summer. Since the May 2024 aurora borealis way far south, 2024, 2025, and 2026 have all had the same +AO warm season pattern! It usually carries through Sept. Since 2012, it has flipped for the Winter almost every time. Would you guys take a repeat of 24-25 and 25-26 with a Super Nino STJ? I would. Should be interesting.
-
-PNA may seem out of context in an El Nino thread, but I'm just describing what's happening now - this is the highest El Nino on record for the date, and right now it's not acting like previous Nino's. Will that change for the Winter? perhaps, but I wouldn't expect a monster -150dm N. pacific low in the DJFM mean.
-
PDO is still around -3. 23-24 and 72-73 are the only analogs for both unless it starts rising fast.
-
Augdewst 2026: Summer's Last Stand
WxWatcher007 replied to Prismshine Productions's topic in New England
Bullseye right over mby. There’s a 0.0% chance of that happening. -

2026-2027 Super El Nino
GaWx replied to Stormchaserchuck1's topic in Weather Forecasting and Discussion
Brand new BoM remains full steam ahead to a record shattering RONI! This includes once again a record rapid rise within just one month (July to August). Also, it still doesn’t fall steeply after the peak totally unlike the V-shaped CFSv2 curve: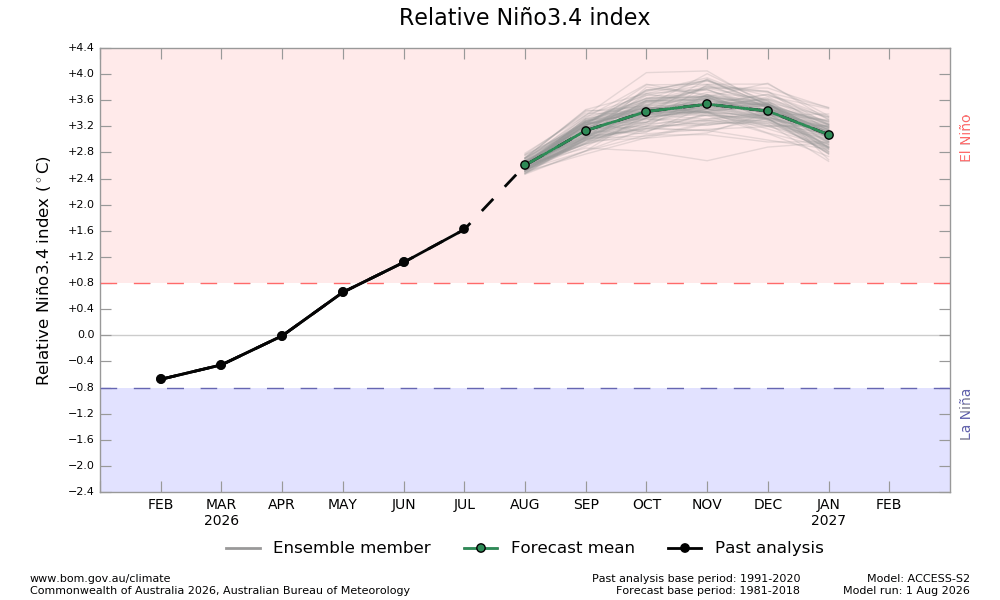
-
Viagra online price: Med Men News - Viagra generic over the counter
-
buy Viagra online: sildenafil over the counter - order viagra
-

2026-2027 Super El Nino
Stormchaserchuck1 replied to Stormchaserchuck1's topic in Weather Forecasting and Discussion
Wow! Keep in mind July 2025 currently holds the all time monthly PDO record in either state, with -4.2. Oct 2024 was the all time monthly record before that, since the mid 1800s, at -3.8. I know they edited the monthly marks so I want to double check but the site is currently down. Aug being possibly the 7th month in a row with -PNA is a big reason why it's dropping so much. Will it start effecting things different as we move toward the cold season? Perhaps, but -PDO decadal is almost as much of an anomaly as El Nino currently is. Having the two together like this is probably coming up on a 6std happening! Exciting! -
2026-2027 Super El Nino
Stormchaserchuck1 replied to Stormchaserchuck1's topic in Weather Forecasting and Discussion
I'm surprised the N. Hemisphere pattern isn't going more +AAM like, which is a GOA low (usually around -100dm even in the warm season with +4 GLAAM), and a High south of Greenland, also approaching +100dm. -
2026-2027 Super El Nino
Stormchaserchuck1 replied to Stormchaserchuck1's topic in Weather Forecasting and Discussion
Cool. I like those moving X-Y plots. There aren't enough Super Nino analogs. The database is too small, so common sense has to be used as to what it means in the northern latitudes. For example, many previous Super Nino's had a cold season +EPO and +AO/somewhat +NAO, which has less to do with ENSO. Super Nino effects the North Pacific High, primarily. -
It's good to see you back, but I disagree with your posts that deny that there's been a drought. As Bluewave has pointed out, we've been in a long term dry pattern since the fall of 2024 and the drought monitor maps have shown the type of drought we've been in. We've had serious issues with wildfires off and on the last couple years due to the very dry conditions. I'm not sure how anyone can deny that there's been a drought. Finally things have gotten better the last few weeks. The hot dry weather is very bad for gardeners. I lost some of the first tomatoes that were about to ripen up in early July due to sunscald. It was that horrific heat wave to start July (4 days in a row of 100+ degree weather) combined with the bone dry conditions. Thankfully things turned around after that with a cooler pattern and a good amount of rain the rest of July, so I've been getting a big crop of tomatoes the last couple weeks. It wouldn't have happened though had we stayed in the hot very dry pattern. We don't want too much rain, but it's important to get enough. Drought combined with heat is the worst and it makes is very difficult for gardeners. I'm glad you mentioned the Perseid meteor shower. It wasn't very good last summer due to the moon, but will be great this summer as long as we have clear conditions. Keeping my fingers crossed for good conditions next week! I'm glad you're back and I hope you decide to stay. I'm sure you were not happy about being 5 posted, and I didn't agree with that being done to you. But you can still be a strong contributor here with 5 posts per day, so I hope you keep posting.
-
2026-2027 Super El Nino
Stormchaserchuck1 replied to Stormchaserchuck1's topic in Weather Forecasting and Discussion
Another big arctic circle vortex occurring over the next few days. <5100 in the heart of Summer. Since the May 2024 aurora borealis way far south, 2024, 2025, and 2026 have all had the same +AO warm season pattern! It usually carries through Sept. -
The ground is back to being very dry here after missing out on the heavy rain earlier in the week. I didn't water the vegetable garden though due to this rain event tonight into tomorrow. Hopefully it won't disappoint. Don't want to see major flooding, but I'd like a nice 1 to 2 inches of rain. We're still in a moderate drought here.
-

Augdewst 2026: Summer's Last Stand
vortex95 replied to Prismshine Productions's topic in New England
-
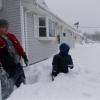
Might be a one snowstorm winter lol. Better make it good!
-
Augdewst 2026: Summer's Last Stand
CT Valley Snowman replied to Prismshine Productions's topic in New England
HRRR is close to a jack here. Don't really need or want it. Send it up Dendy's way. -
I've been debbing but this part isn't lost me--I have always viewed super niños as 50/50 for that reason. I did notice that 97-98 was the only one in the bunch that had zero chance as I didn't see even 3 consecutive days that were cold enough for snow the entire winter. At least 72-73 did have a couple cold periods but we just missed a storm, I think. Silly side note: My pattern superstition thinks because all superstition dating back to 66 have gone good-bad-good-bad-good...ack, lol
-

E PA/NJ/DE Summer 2026 Obs/Discussion
LVLion77 replied to PhiEaglesfan712's topic in Philadelphia Region
Heavy rain this evening up here near Macungie. Already crossed 1/2”.